High Performance RailA hybrid freight-passenger strategy for Ontario’s rail future
A world-class 200 km/h passenger line along the Highway 401 corridor. World-class freight on a liberated Kingston Subdivision. One set of investments. Two transformed networks.
Why ALTO as currently proposed cannot succeed
ALTO was designed for a world that no longer exists — a stable, integrated North American economy with low tariff risk. Its business case is negative. Its cold-climate engineering is unproven. Its P3 structure is untested on a scale this large.
The Business Case
The Geopolitical Reality
ALTO was conceived in a period of Canada-U.S. harmony and stable CUSMA. That world is gone.
Engineering & P3 Risks
Quick clay zones along the southern corridor
High-speed ballastless track tolerances of a few millimetres are incompatible with differential Leda settlement. No credible cost estimate in ALTO’s Business Case.
The world’s only cold-climate HSR precedent
25% budget overrun, 20% of track rebuilt pre-opening, frost heave in engineered fills, 3-year winter speed restriction. ALTO is proposed at the same latitude.
The only completed HSR demand-risk P3 in the world
Opened 2010. Liquidated by court order 2016. Traffic ran at one-third of projections. Governments nationalised the line. Private investors lost everything.
ALTO as mechanism of foreclosure
By occupying fiscal and political space, ALTO ensures the 401 co-construction window is missed, the HPR corridor infills, and the better option disappears permanently.
“ALTO HSR was designed for a stable, integrated North American economy that no longer exists. HPR was designed for the economy Canada actually has.”
Two irreconcilable optimisations
CN freight and VIA Rail passenger operations require physically incompatible infrastructure. Sharing the Kingston Subdivision forces both into a perpetual compromise.
These are not preferences that can be reconciled through better timetabling. They are physical requirements that cannot coexist on the same infrastructure. HPR separates them: passengers on a dedicated 401 corridor at 200 km/h; freight on a liberated Kingston Sub with no passenger constraints.
| CN Rail — Freight | Dimension | VIA Rail — Passengers |
|---|---|---|
| Double-stacked intermodal, 200+ wagons, up to 3 km length. Slow to accelerate and stop. | Train formation | Light electric trainsets, 200–400 m. Fast acceleration and precise stopping for tight schedules. |
| 8,000–10,000+ tonnes per service. Heavy axle loads require long clearance intervals. | Gross weight | 400–600 tonnes. Low axle load; high-frequency operation requires short headways. |
| Moderate, continuous. Economics require low-cost running at steady speed — not burst acceleration. | Operating speed | 200 km/h capability required. Every siding hold destroys journey time competitiveness. |
| Structurally incompatible. Double-stack container height (6.4 m+) exceeds catenary clearance envelope. | Electrification | Essential for performance, emissions targets, and long-term operating cost reduction. |
| Long signal blocks required. Heavy trains need extended clearance times before section can be released. | Signal spacing | Short blocks or moving-block ETCS needed for high-frequency service. Incompatible with long blocks. |
| Statutory freight priority on CN-owned track. Any interruption to flow is a direct commercial cost. | Scheduling priority | Precise minute-by-minute timetable. Freight-priority siding holds are structural, not exceptional. |
Statutory freight priority established under Canada Transportation Act, s.116.
Untangling CN and VIA
The HPR strategy is simple: build a new dedicated passenger line along the 401 corridor, and give the Kingston Sub back to freight. One new build. Two liberated networks.
HPPR to Brockville, then VIA-owned Smiths Falls Sub
~310 km at 200 km/h to Brockville; continue on Smiths Falls Sub to Ottawa. No new construction. Toronto–Ottawa in ~2 hr 50 min. 90% on-time performance.
VIA-owned Windsor–London + liberated Dundas Sub
VIA-owned corridor joins liberated Dundas Sub for 200 km/h run to Toronto. Toronto–Windsor in ~2 hr 30 min.
GO service on the existing Havelock Sub
CPKC Havelock Sub runs through Peterborough on maintained track. Reactivating GO service would cost a fraction of 1% of the ALTO budget. 83,000 people currently without passenger rail.
The Kingston Sub as a dedicated freight corridor
When passengers move to a new 401 corridor, the Kingston Subdivision becomes what CN always wanted: a dedicated freight highway. Longer trains. Optimised timetables. No passenger scheduling compromises.
Intermodal hubs: Cornwall and Belleville
Cornwall becomes the Ontario-Quebec border gateway with a direct connection to the Port of Montreal approach. Belleville becomes the mid-corridor distribution node. Together they give Eastern Ontario its first direct intermodal rail access.
Contrecoeur — the game-changer
The Port of Montreal’s Contrecoeur expansion uses a rail-at-dock design that eliminates drayage cost. Combined with dedicated freight on the Kingston Sub, CN can re-establish competitive intermodal service on the Montreal-Toronto corridor — a market it lost to trucking, and can now recover.
ALTO offers no connection to Contrecoeur. Its passenger corridor provides no freight function, no intermodal terminal, and no land-side port connection of any kind. The Contrecoeur opportunity is simply invisible to ALTO.
The historical counterfactual: why CN was privatised
And what privatisation delivered
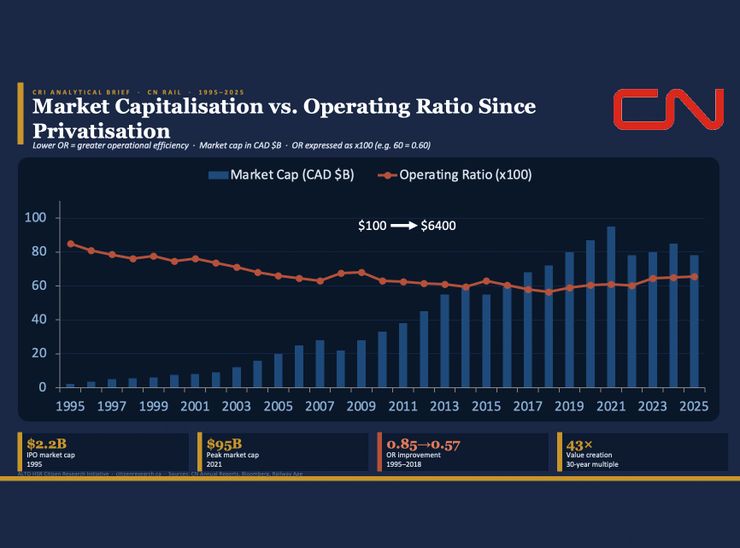
What the CPKC merger proves about single-line networks
The 2023 Canadian Pacific – Kansas City Southern merger created the first single-line freight rail network connecting Canada, the United States and Mexico. Integration is running ahead of schedule.
The warning: Milton Logistics Hub
CN’s Milton Logistics Hub
Location & Proximity
East Milton, Halton Region — 400 of 1,000 acres acquired by CN in a provincially designated employment zone, less than 1 km from ~34,000 residents, a hospital, 14 schools, and two long-term care homes.
Federal Approval & Court
325 mitigation conditions attached; Cabinet approved despite the EA Panel confirming significant adverse health effects. Federal Court (2024): no safe level of human exposure to diesel. Court of Appeal reversed, calling mitigation conditions reasonable. Three judicial levels — all legal avenues exhausted by May 2025.
Direct highway access + 2–3 km residential buffers + electrification as baseline — not as mitigation conditions retrofitted after community damage.
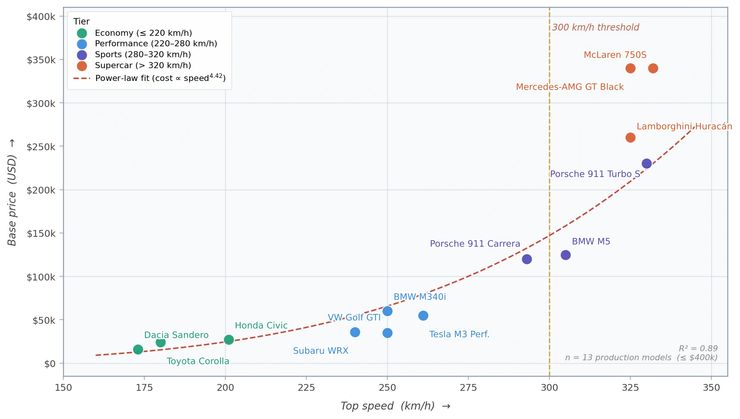
Why 200 km/h, not 300 km/h
Rail infrastructure cost scales as speed to roughly the fourth power. Moving from 200 km/h to 300 km/h is not a 50% cost increase — it is closer to a 5× increase per kilometre, before land acquisition. And passengers rank raw speed third, not first.
The G7 regression
The same signature appears in the automotive market
What passengers actually rank first
Literature review across major national passenger surveys (UK NRPS, Dutch NS, French TER, Asian HSR) finds travel time / speed in Tier 3 — below reliability, safety, seat availability, price, and access quality.
| Tier | Factor | Evidence basis |
|---|---|---|
| Tier 1 — Universal thresholds | ||
| 1 | Reliability / Punctuality | Most consistent primary driver across all major national surveys. Chronic unreliability depresses ridership long-run more than any single-incident analysis implies. |
| 1 | Safety (objective + perceived) | Platform crowding creates direct hazards. Health-safety perceptions became the dominant factor in post-pandemic demand recovery. |
| Tier 2 — Strong independent drivers | ||
| 2 | Seat availability / crowding | Among the highest-impact satisfaction drivers on long-distance services. Passengers may relocate housing or employment to avoid chronic crowding. |
| 2 | Price / Value for money | HSR fare elasticities of −1.1 to −1.9 (leisure). Premium pricing without premium service quality depresses ridership. |
| 2 | Access and egress quality | Remote or poorly-connected stations systematically underperform demand projections. |
| Tier 3 — Significant secondary | ||
| 3 | Travel time / speed | Valued, but benefits substantially mediated by whether passengers can use travel time productively. Standard clock-time savings models overstate benefits. |
| 3 | Thermal comfort / cleanliness | Independent satisfaction dimensions across all markets. |
| 3 | Information quality | Especially during disruption. Real-time information provision significantly moderates satisfaction loss. |
Moving from a 200 km/h passenger line to a 300 km/h dedicated HSR line is not a 50% cost increase for a 50% speed increase. It is closer to a 5× increase in per-kilometre capital cost — before accounting for the additional cost of greenfield land acquisition on routes that cannot follow existing corridors. And passengers rank raw speed third, not first.
International precedent — measured approaches work
A measured approach to high-speed rail
Despite three proposed HSR corridors and decades of planning, Finland has chosen incremental upgrades over dedicated new-build high-speed track. The approach emphasises cost-sharing, EU co-funding where available, and route-by-route feasibility over a single megaproject.
From ambition to abandonment
After a decade of planning a 320 km/h Stockholm–Gothenburg–Malmö network, Sweden formally abandoned its national HSR programme in late 2022. The 2026–2037 infrastructure plan reallocates roughly €45B to rail, prioritising a historic maintenance backlog and selective 250 km/h upgrades over new greenfield high-speed line.
HPPR Corridor — Toronto to Montréal
High Performance Passenger Rail along the Highway 401 corridor. 200 km/h operating speed. ~550 km. Six stops. All within existing transportation rights-of-way.
Indicative journey times from Toronto Union
HPPR vs. current VIA — full corridor
| Route | HPPR | Current VIA | Time saving |
|---|---|---|---|
| Toronto → Kingston | ~1 hr 30 | 2 hr 30 | ~1 hr |
| Toronto → Ottawa | ~2 hr 55 | 4 hr 00+ | ~1 hr 30 |
| Toronto → Montréal | ~3 hr 38 | 4 hr 30 – 5 hr | ~1 hr |
| Toronto → Windsor | ~2 hr 30 | 4 hr 00+ | ~1 hr 30 |
| London → Toronto | ~1 hr 15 | 2 hr 30 – 3 hr | ~1 hr 30 |
Crossover system — express trains stay on the 401 at 200 km/h; stopping services diverge to existing downtown stations. No choice between speed and access. 3-hour modal shift threshold — Toronto-Ottawa at ~2 hr 55 crosses the critical threshold. ECML evidence: 200 km/h rail captures more than 50% of the combined air-rail market at comparable journey times. Existing fleet — VIA’s Siemens Venture fleet (200 km/h capable) is already procured. No new rolling stock required, unlike ALTO which needs a purpose-built HSR fleet.
Why now is the only time
The 401 will not be widened again. Every 401 overpass currently being designed is either compatible with future rail co-location — or it forecloses it permanently. This is a window that closes.
Shared earthworks
Civil mobilisation, drainage, and compaction costs shared across highway and rail simultaneously. Separate mobilisation later adds 20–35% to civil costs.
Grade separations at specification
Every new 401 overpass built to rail-compatible geometry at marginal extra cost. Retrofitting later costs enormously more.
Single environmental assessment
One EA covers highway widening plus rail co-location. A standalone HPPR project later requires a full second EA across the same sensitive corridor.
One traffic management cycle
A second construction zone through Eastern Ontario — 10–15 years later — doubles disruption to freight and commuter traffic.
Grade separation geometry must be specified before 401 widening contracts are awarded. Every day of delay narrows the window.
401 corridor compatibility by design radius
Every rail line has a minimum curve radius, set by its design speed. Faster trains need gentler curves. The 401 itself has an absolute minimum radius of 832 m and a typical radius of roughly 1,500 m. Trains whose minimum radius exceeds 1,500 m cannot follow the 401 without extensive new arcs sweeping outside the right-of-way.
HPPR with tilting trains (minimum radius 1,400 m) is actually more compatible with typical 401 curves than the 401’s own typical radius. ALTO at 300 km/h (minimum radius 7,000 m) is 4.7× wider than the typical 401 curve, making the highway right-of-way essentially unusable as-is.
| Parameter | HPPR — Tiltingmin. 1,400 m | HPPR — Non-Tiltingmin. 2,000 m | ALTOmin. 7,000 m |
|---|---|---|---|
| Factor above 401 absolute min. (832 m) | 1.2× | 2.2× | 8.4× |
| Factor above 401 typical curve (~1,500 m) | 0.7×compatible | 1.2× | 4.7× |
| Pickering → Kingston compat. % | ~90–92% | ~86–89% | ~73–75% |
| Kingston → Brockville compat. % | ~81–84% | ~75–79% | ~58–60% |
| Brockville → QC border compat. % | ~87–89% | ~82–85% | ~66–68% |
| Eastern section total compatible % | ~87–90% | ~83–87% | ~68–70% |
| Incompatible curved length (eastern) | ~62–77 km | ~88–105 km | ~122–131 km |
| Land acquisition corridor per deviation | ~10–20 mcurve correction | ~20–40 m | ~120–200 mnew arc sweeps |
| Deviation terrain (Shield zone) | Within ROWminor correction | Within / adjacent ROW | Biosphere / Shield / waterfront |
The difference between HPPR and ALTO is not primarily about train technology. It is about geometry. A 200 km/h design with tilting trainsets fits inside the existing 401 right-of-way for 87–90% of the eastern corridor. A 300 km/h design requires a new corridor for roughly a third of the route, with each deviation needing a 120–200 m-wide land acquisition through the Frontenac Arch Biosphere, Canadian Shield, or waterfront.
The $42.6 billion cost of the missed window
If ALTO occupies the fiscal and political space, the 401 co-construction window is missed. The corridor infills — first logistics, then residential, then utilities — until the HPR option is no longer available at any price.
The three components
Land value escalation
Current corridor: $20K/ha agricultural. 2060 infilled: $800K/ha blended. 2,400 ha ROW × 1.4× expropriation premium.
Construction cost premium
At-grade on open land: ~$28M/km. Elevated through infilled logistics corridor: $100–200M/km. Premium across 400 km by 2060.
Foregone benefit NPV (50 yr)
Passenger modal shift ($3–8B) + HPFR freight efficiency ($7.7–9.6B) + GHG avoided emissions ($5.2–7.8B). Social cost of carbon at 4% SDR.
“The combined cost of building ALTO and foreclosing the HPR corridor is four to six times the cost of building HPR itself. This is not a marginal difference — it is the difference between a generation-defining investment and a generation-defining error.”
The infill ratchet: interchange activation (now–2035) → logistics intensification (2030–2045) → residential infill (2035–2060) → utility lock-in (2040–2070) → corridor fossilisation (2060–2100).
HPR vs. ALTO — what taxpayers actually get
HPR requires roughly one-third the annual federal support of ALTO, while delivering freight displacement, ecological benefits, and distributed regional value that ALTO cannot offer.
| Metric | HPR | ALTO |
|---|---|---|
| Net Present Value | Positive (est.) | −$21.1B |
| Annual federal cost (central ridership) | ~$1.24B/yr | ~$4.5B+/yr |
| Public capital required | ~$22B (HPPR only) | $75–113B+ |
| Total policy cost incl. foreclosure | ~$22B | $118–156B+ |
| Annual operating surplus / deficit | +$57M at 6M pax | −$600M to −$1.2B/yr at 10M pax |
The freight railway as climate infrastructure
HPR’s freight displacement benefit does not shrink as EVs proliferate. ALTO’s passenger displacement benefit does. The two projects’ carbon trajectories diverge in HPR’s favour across the entire planning horizon.
HPR annual carbon balance (central estimate)
| Component | Effect | Basis |
|---|---|---|
| HPPR traction + overhead (6M pax) | 6,548 t/yr emission | 84.5 Wh/pkm × Ontario grid 73.8 g CO₂/kWh |
| HPFR freight displacement (3,000 trucks/day) | 258,694 t/yr saving | 675 g/km net truck-rail differential × 350 km avg haul |
| Passenger modal shift (6M pax) | 113,152 t/yr saving | 70% car, 20% bus, 10% air; 175 km avg trip |
| Net annual CO₂ balance | 365,298 t/yr saving | HPR saves ~365 kt CO₂/year at central estimate |
HPR: −14.5 Mt (net saving). ALTO: +22 Mt (net emitter). ALTO payback: never at 4–8M passengers.
ALTO’s carbon payback against an EV-transition fleet (2045+)
The EV transition helps ALTO (cleaner grid lowers traction emissions) but simultaneously narrows the displacement benefit — EVs emit only 10.2 g/pkm vs. 108 g/pkm for an ICE car. Fleet electrification outpaces grid decarbonisation in most scenarios.
| Grid scenario | 4M passengers/yr | 8M passengers/yr | 12M passengers/yr |
|---|---|---|---|
| Clean grid20 g/kWh | saving: 102 kt/yrpayback: ~143 yrs | saving: 278 kt/yrpayback: ~53 yrs | saving: 464 kt/yrpayback: ~32 yrs |
| Current grid73.8 g/kWh | saving: 8 kt/yrpayback: >500 yrs | saving: 146 kt/yrpayback: ~101 yrs | saving: 322 kt/yrpayback: ~46 yrs |
| Gas-expansion130 g/kWh | Net increasepayback: Never | saving: 7 kt/yrpayback: >500 yrs | saving: 174 kt/yrpayback: ~84 yrs |
At 4M passengers/year — comparable to early-phase ridership — no scenario achieves ALTO carbon payback within any credible operating horizon once the EV fleet transition is accounted for. On the current grid with an EV-displaced fleet, annual saving falls to just 8 kt/yr, implying payback of more than 500 years against a 14.69 Mt construction debt. Ontario EVs are already cleaner than ALTO HSR at any ridership level on the current grid.
Sources: MDPI Sustainability 2018; Canadian Geotechnical Journal 2015; HS2 Carbon Reduction Report 2024; Chester & Horvath 2010; UIC Carbon Footprint HSR 2011, 2016; IESO 2024; NRCan EV Efficiency Data.
A defining decision for a defining moment
Five structural conditions have aligned simultaneously for the first time in a generation. Four are fully favourable. The fifth is open but closing.
1. Federal capital appetite for transformational infrastructure
High: post-COVID recovery, national competitiveness agenda, infrastructure renewal cycle underway.
2. Active civil groundworks on the preferred corridor
Underway: 401 widening in planning and early execution — shared mobilisation available now.
3. Public awareness of rail corridor questions
Primed: the ALTO consultation has activated public and political interest in intercity rail across Ontario.
4. Evidence base for the HPR alternative
Established: the research record provides the engineering, financial, and environmental basis across all key dimensions.
5. Window to influence 401 widening specifications
Open but closing: grade separation specifications must be set before contracts are awarded.
“Build the new passenger railway now. Give the Kingston Sub to freight. Do it while the 401 crews are mobilised and the corridor is open. Or explain, fifty years from now, why a $42.6 billion opportunity was left on the table.”
A clear, actionable policy agenda
Three time horizons. Three sets of decisions. All of them available to the current Parliament.
How HPR earns community acceptance and ALTO forfeits it
Eastern Ontario Wardens’ Caucus Resolution 2026-02, representing 103 communities, on the public record against the ALTO southern corridor. Municipal opposition from Rideau Lakes, Centre Hastings, Tyendinaga, Douro-Dummer. A 38:1 community petition ratio against ALTO.
Trucks off the 401
HPR shifts freight to rail across the full 575 km corridor. Direct quality-of-life benefit for every municipality. ALTO carries zero freight — 401 congestion unchanged on opening day.
Environmental acceptance
HPPR co-located with the already-disturbed 401 corridor. ALTO cuts greenfield through the Frontenac Arch Biosphere, Moira Karst hibernacula, and Grey Ratsnake critical habitat.
Distributed benefits
HPR delivers linear benefit from Windsor to Cornwall. ALTO concentrates benefits in Toronto, Ottawa, Montreal, Quebec City. Intermediate communities bear costs without gains.
Manufacturing + supply chain
HPFR reduces freight costs for manufacturers along the 401. ALTO provides zero supply chain benefit and zero freight impact.
Road and farm severance
HPPR follows the existing 401 corridor where grade separations are already planned. HPFR uses the existing Kingston Sub — zero new severances. ALTO imposes fresh severance on rural road networks.
K-shaped economy
ALTO primarily benefits urban knowledge workers. Rural communities, manufacturers, and agricultural workers bear costs without gains. HPR distributes benefit broadly across the income spectrum.
When ALTO opens, the Kingston Sub economics collapse. Intermediate communities lose VIA Rail. Approximately 600,000 people affected across 11 communities along the lakeshore corridor that will no longer have passenger rail access.