Engineering Complexity and Community FrictionJoint predictors of high-speed rail cost
A multivariate reference-class analysis of 16 international HSR projects. Together, engineering complexity and community friction explain 90 % of cross-project cost variance — and they predict the ALTO corridor at roughly twice its declared cost.
The Engineering Complexity Index (ECI)
Six weighted dimensions score the physical difficulty of building a rail corridor. Physical engineering dimensions carry 60 % of total weight.
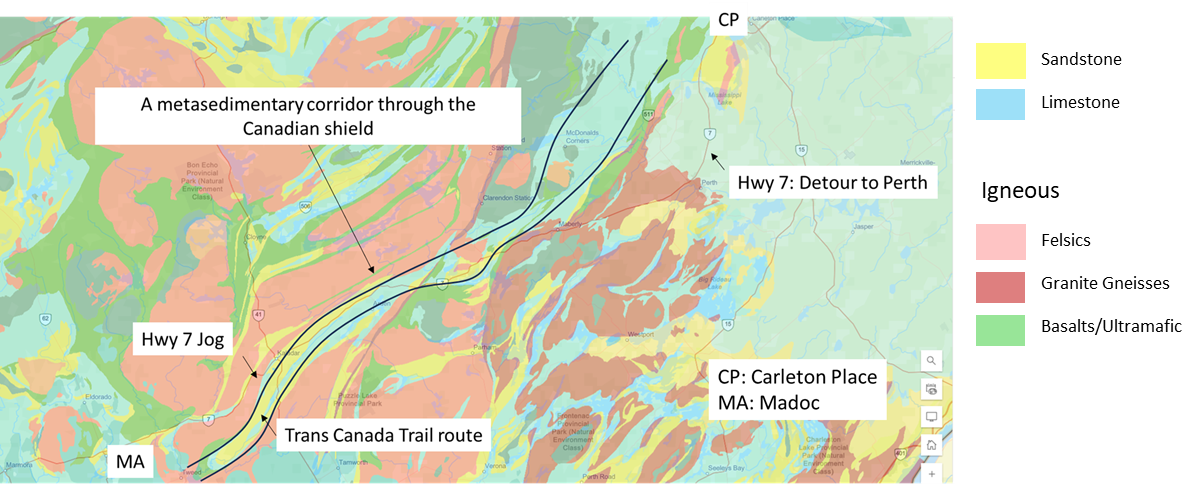
The ECI aggregates six engineering conditions that together capture the physical difficulty of constructing a high-speed rail corridor. Each dimension is scored on a 1–5 scale (routine, moderate, extreme) and weighted to reflect its contribution to construction risk. The southern ALTO corridor presents three simultaneous worst-case conditions: a metasedimentary corridor through the Canadian Shield, major hydrology crossings, and severe freeze-thaw climate loading.
| Dimension | Weight | 1 — Routine | 3 — Moderate | 5 — Extreme |
|---|---|---|---|---|
| Geotechnical conditions | 20 | Competent uniform ground, shallow stable bedrock | Mixed conditions, moderate settlement potential | Karst, sensitive marine clays, liquefaction, shear zones |
| Major structures | 20 | Minimal — at-grade with small culverts | Short bridges, one grade separation cluster | Long viaducts, deep or long tunnels, major river bridges |
| Topography and alignment | 20 | Flat, straight, generous curve radii | Rolling, some grade or curve compromises | Mountainous or constrained; grades and radii at spec limits |
| Hydrology and drainage | 15 | Few minor crossings, simple culverts | Several regulated watercourses, some floodplain | Major river crossings, wetland complexes, altered groundwater |
| Infrastructure interfaces | 15 | Greenfield, few conflicts | Several road, rail, or utility crossings | Dense urban interfaces, live rail, buried utilities |
| Climate and environmental loading | 10 | Temperate, low freeze-thaw, stable | Cold climate, moderate frost heave, snow loading | Severe freeze-thaw, permafrost-adjacent, extreme swing |
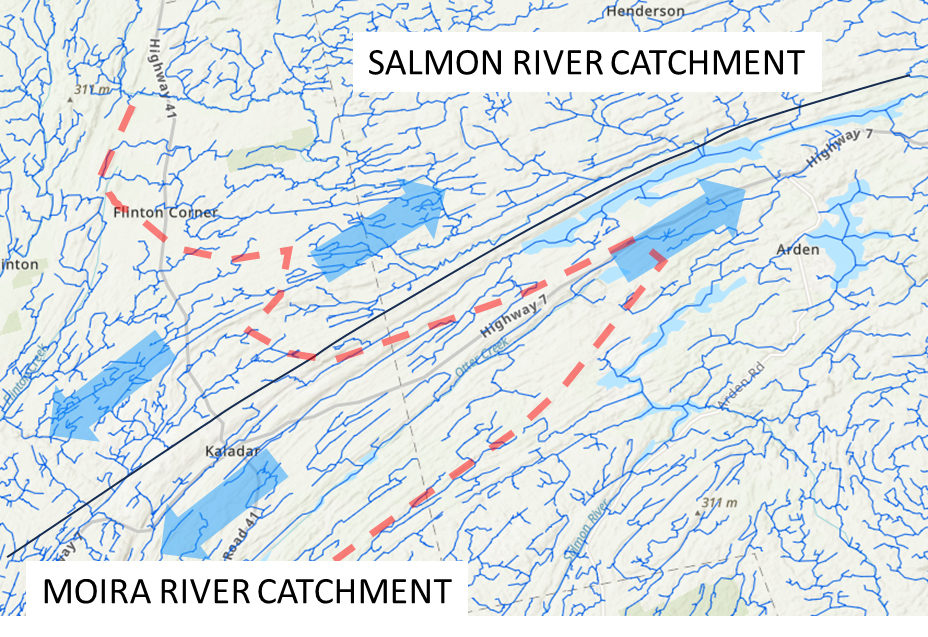
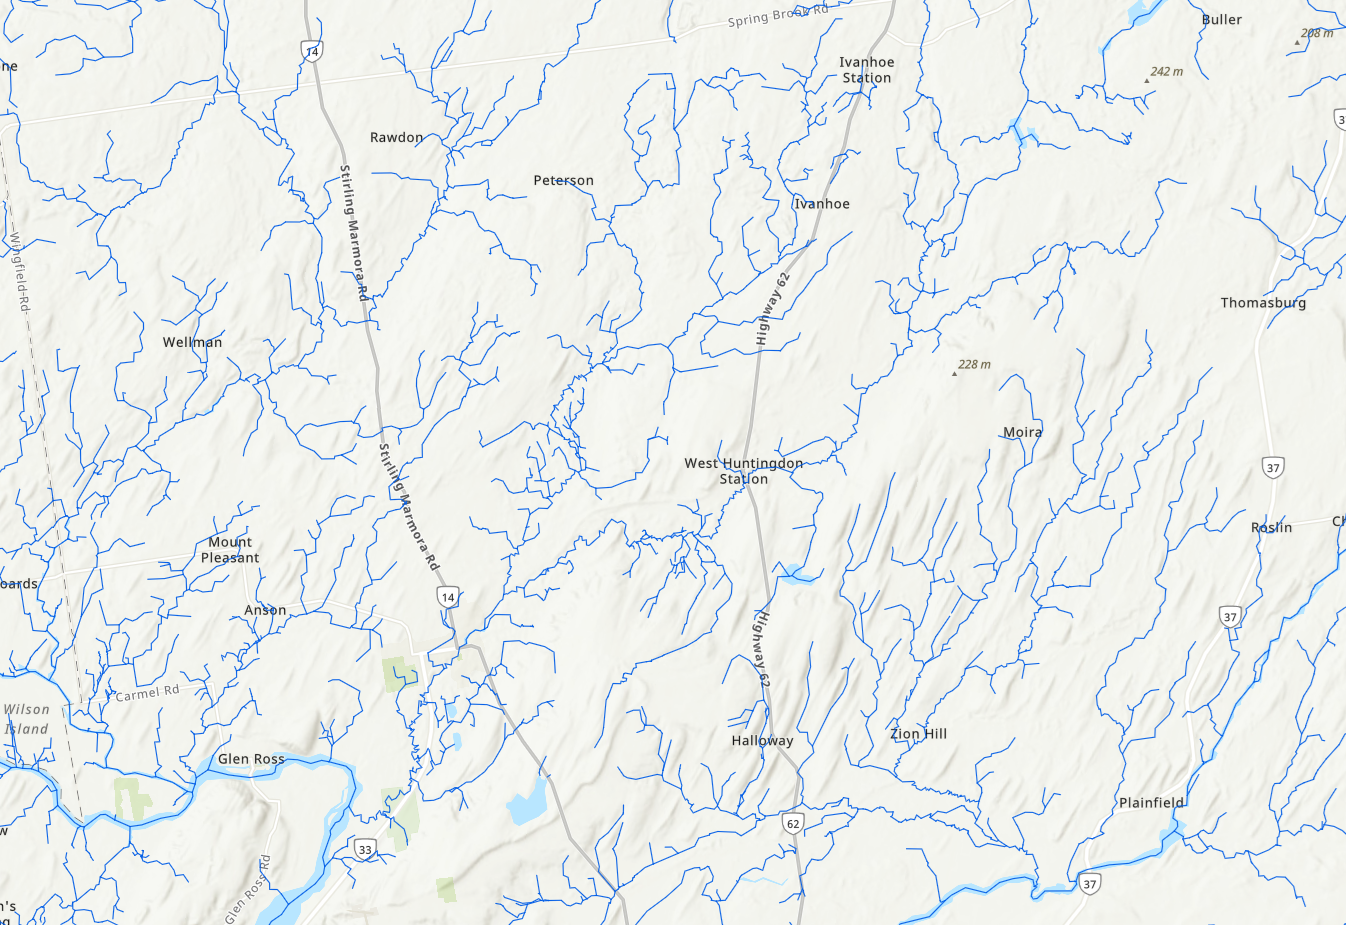
Hydrology — the corridor crosses two major watersheds
Between 3 and 5 trillion litres of water cross the proposed southern alignment each year. Two regulated catchments — the Salmon River to the north and the Moira River to the south — are each crossed by the corridor through mapped wetland complexes and headwater systems.
The ECI gives every reference-class project a single engineering complexity score between roughly 40 (easy) and 90 (extreme). ALTO’s southern corridor scores 77 — in the top quintile of the 16-project international dataset.
Cost rises with engineering complexity — but with wide scatter
Engineering complexity is a real cost driver, but leaves 43 % of variance unexplained — notably the anglophone premium on HS2, HS1 and California HSR.
0.57
Engineering alone explains 57 % of cross-project cost variance
log₁₀ (cost CAD M / km) = 0.0173 · ECIw + 0.666 · n = 20 HSR reference projects · cost in 2026 PPP Canadian dollars
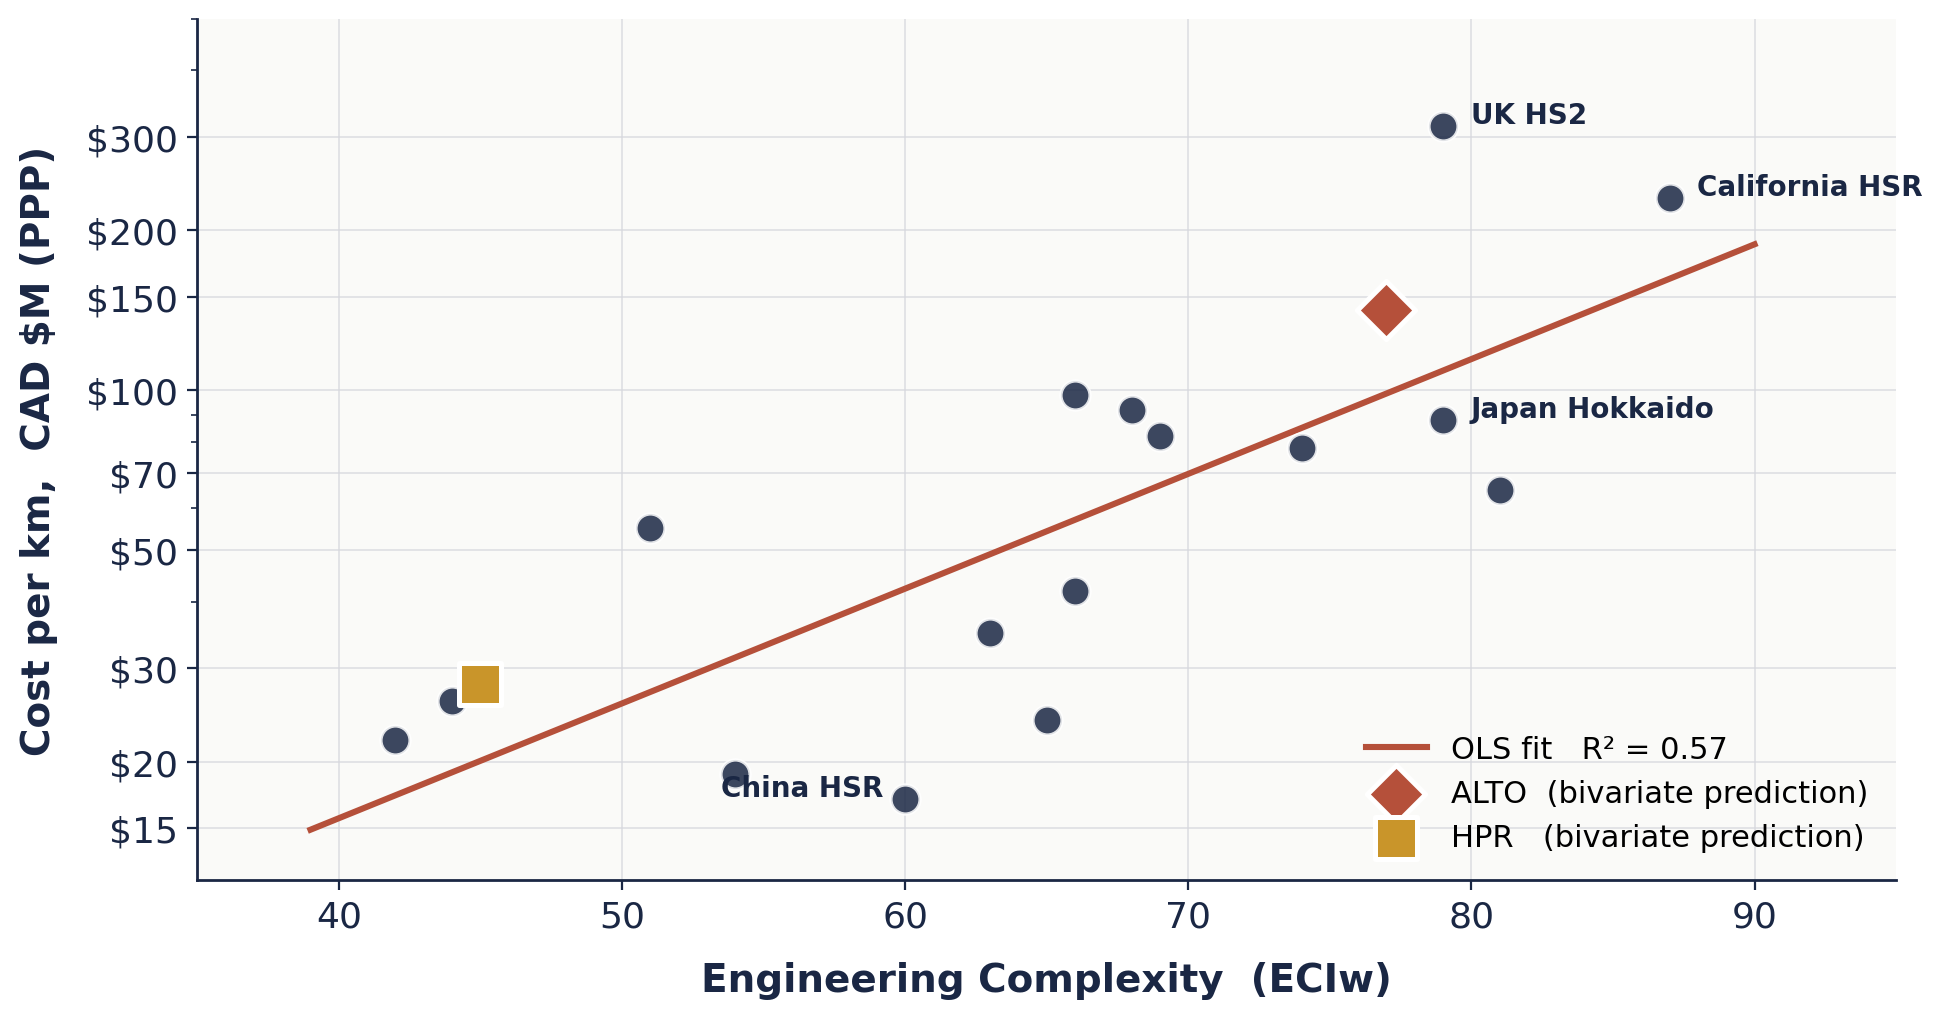
A regression of log-cost against ECI alone leaves roughly 43 % of variance unexplained. The residual pattern is not random: anglophone projects (HS2, HS1, California) consistently over-run their engineering-only predictions, while Chinese and continental European projects consistently under-run. Something beyond geotechnics is driving the gap.
The second independent variable
Community friction is a measurable, decomposable cost driver — the sociopolitical pathway that accompanies every linear megaproject through populated terrain.
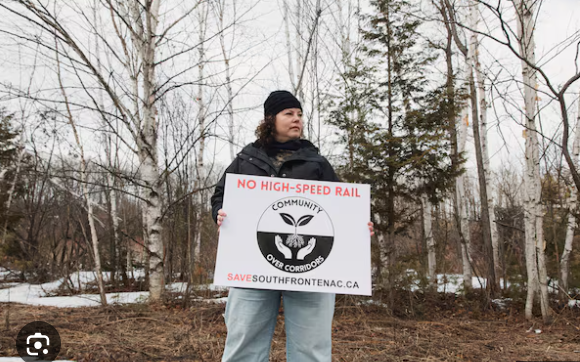
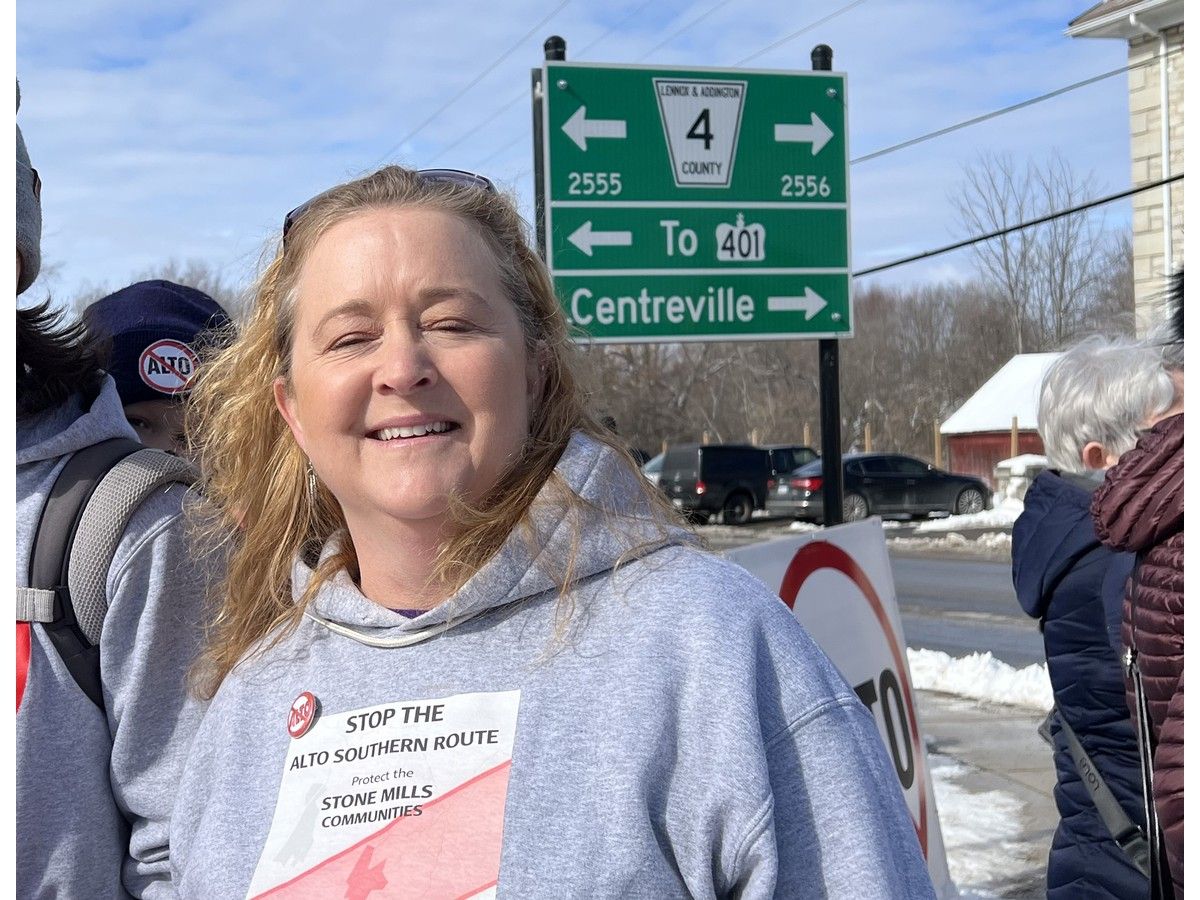
What does community friction look like?
Friction is not an abstraction. It has organised coalitions, public meetings, lawn signs, legal briefs, stakeholder letters, and faces on the evening news. It produces measurable signals — ATI requests filed, amendments moved, stop-work orders sought, parliamentary testimony given — that can be scored consistently across projects.

Five components, scored from the documented record
The CFI decomposes into five sub-components, each scored 0–20 from the documented record — consultation submissions, legal filings, route changes, regulator interventions, and the political record. Component scores sum to an aggregate CFI between 0 and 100.
Scale, organisation, and reach of grassroots opposition
Measured by consultation record, community groups, media coverage, public mobilisation.
Formal legal and quasi-legal activity against the project
Measured by ATI requests, tribunal applications, judicial review, injunctions, s. 35 litigation.
Cumulative scope, alignment, or category changes under pressure
Measured by realignments, station relocations, speed downgrades, phase cancellations.
Intensity of environmental and NGO engagement with the project
Measured by EA submissions, species-at-risk triggers, regulator intervention, stop-work orders.
Inter-party, inter-governmental, or intra-caucus political contest
Measured by Parliamentary inquiries, committee hearings, election-issue status, intergovernmental dispute.
5 components × 0–20 sub-scale = aggregate CFI (0–100). Each component is scored from the documented record — not survey, not sentiment. The scoring methodology is reproducible across projects.
People are harder than rock
Community friction is the stronger single predictor of HSR cost. CFI alone explains more variance than any engineering-only model.
0.81
Community friction alone explains 81 % of cross-project cost variance
log₁₀ (cost CAD M / km) = 0.0139 · CFI + 1.216 · n = 16 HSR reference projects · cost in 2026 PPP Canadian dollars
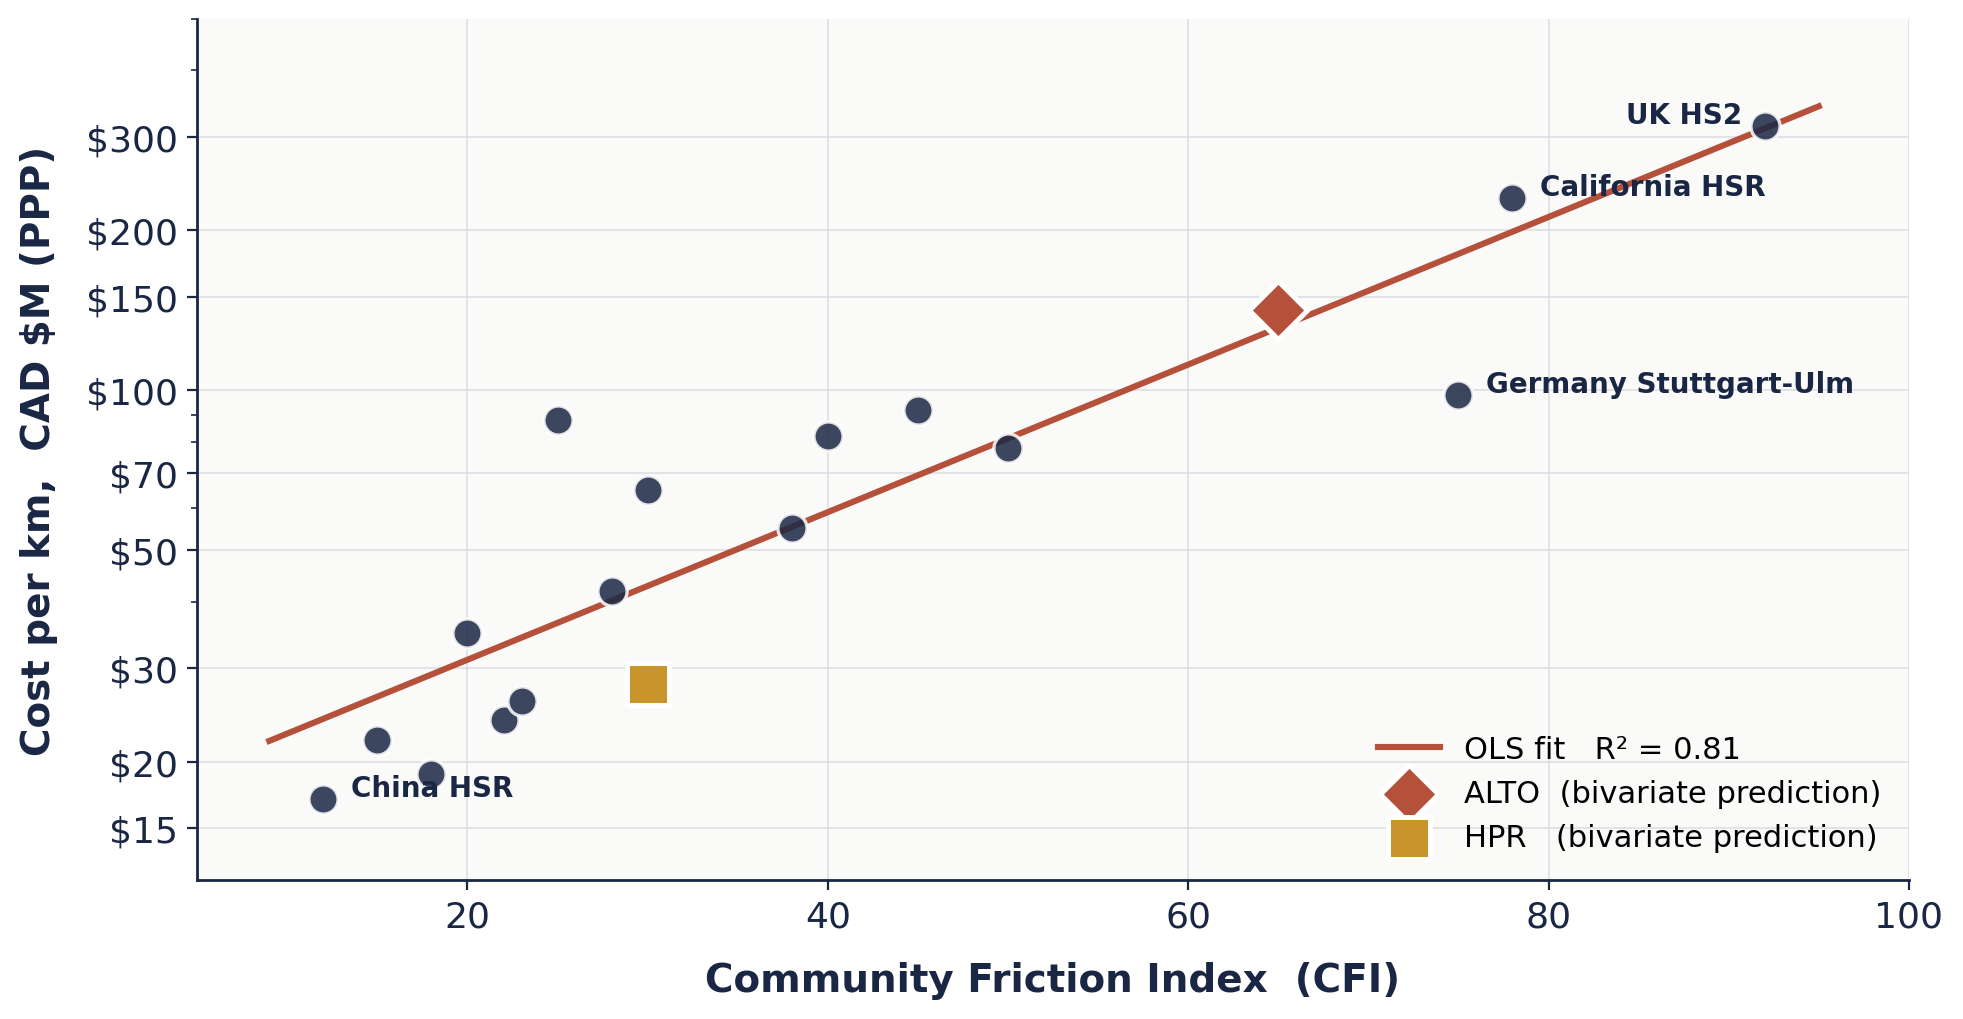
CFI alone (R² = 0.81) is a stronger predictor than ECI alone (R² = 0.57). The implication is structural: the single largest source of HSR cost risk is not what lies under the rails, but what lives next to them. ALTO’s business case does not score this dimension.
A housing analogy — two factors, one price
A house’s price depends on both its size and its location. A rail corridor’s cost depends on both its engineering complexity and its community friction. Neither factor alone tells the whole story.
“Location, location, location” is the fundamental real estate principle that a property’s desirability, value, and appreciation are primarily determined by its position, rather than the house itself.
The same logic applies to linear megaprojects. Engineering complexity — the ECI — tells you about the house: its size, its foundation, the difficulty of building it. Community friction — the CFI — tells you about the lot: the neighbours, the setbacks, the zoning, the permits, the time and money spent before a shovel enters the ground. Size without location under-explains price; ECI without CFI under-explains HSR cost. Together, they capture 90 % of cross-project variance.
Together, ECIw and CFI explain 90 % of cost variance
The bivariate model is highly significant. Completion year adds nothing once both indices are controlled for — ALTO’s cost is not being inflated by “it’s 2026 now.”
0.90
Adj. R² = 0.88 · F(2, 13) = 56.9 · p < 10⁻⁶
ECIw β = 0.35, p = 0.006 · CFI β = 0.70, p < 0.001 · Year p = 0.83 (not significant)
log₁₀(predicted cost per km) = 0.0101 · ECIw + 0.0108 · CFI + 0.671
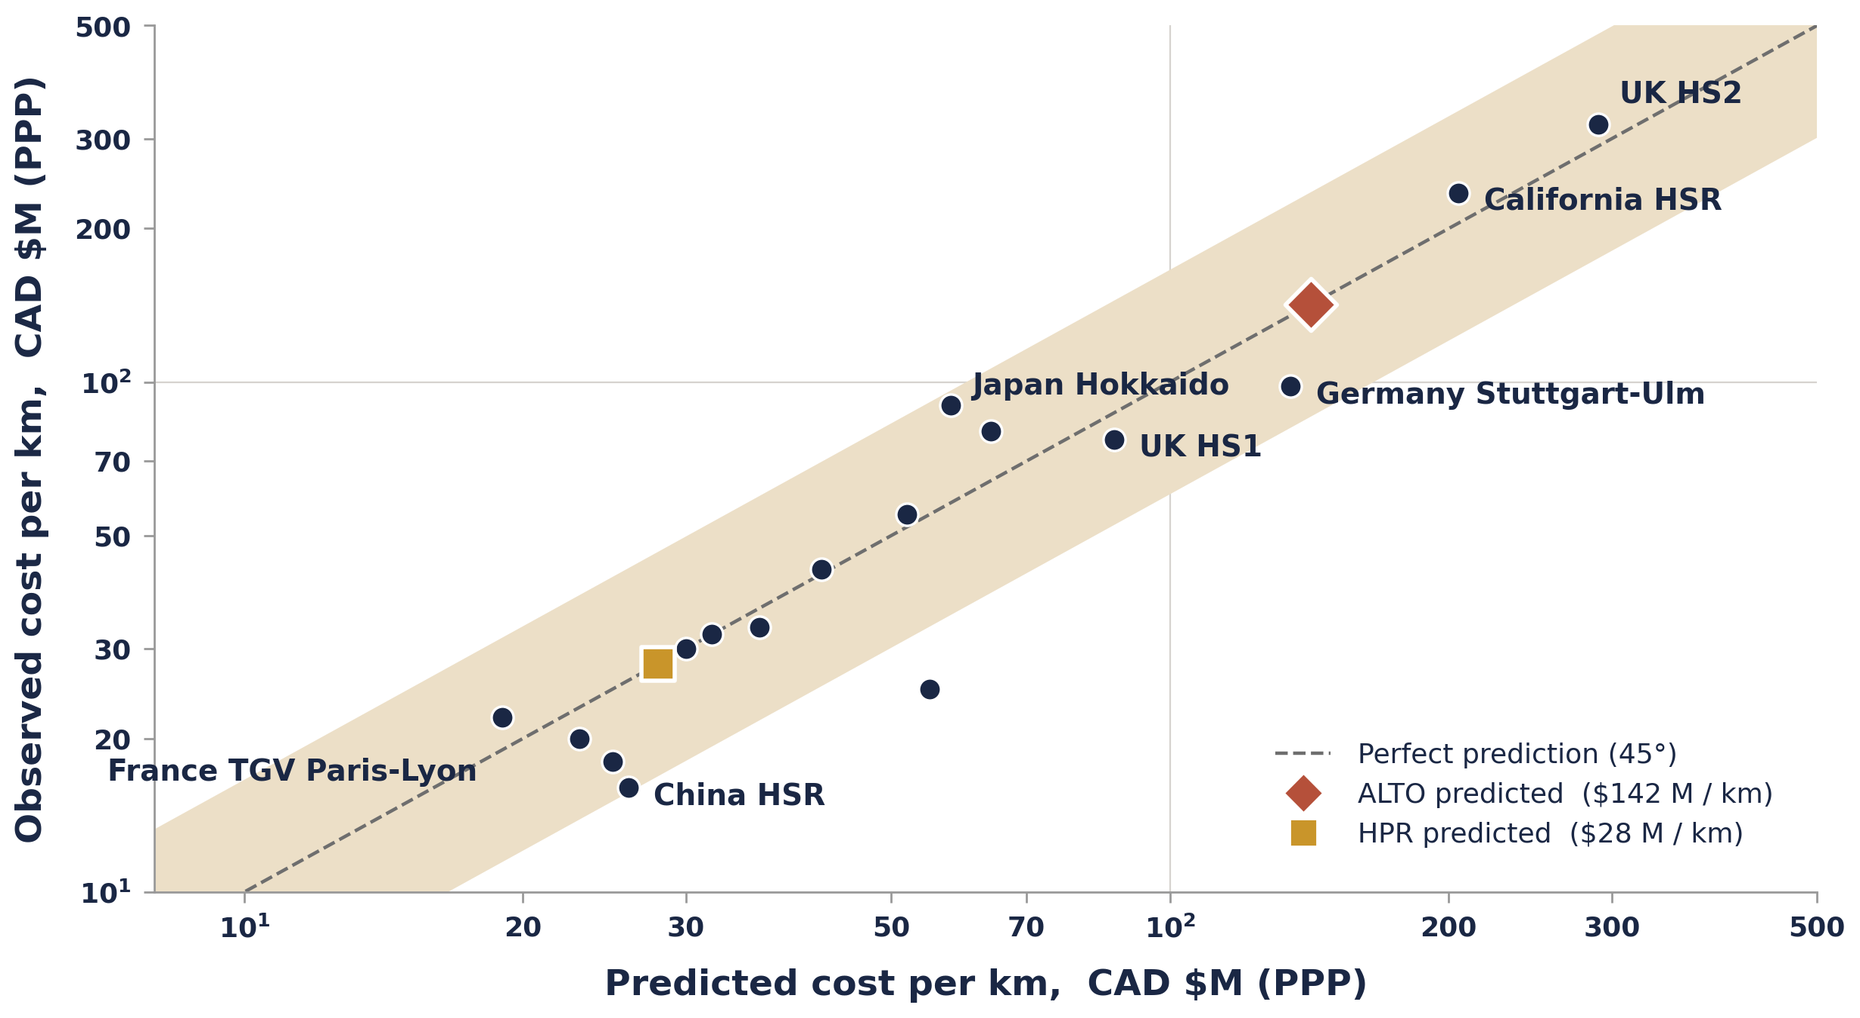
Plug ALTO’s estimated ECIw (77) and mid-energy CFI (65) into the regression: the central cost prediction is $143 B across the 1,000 km corridor, with a 95 % prediction interval of $76–264 B. The proponent’s own $75 B estimate coincides with the lowest outcome the model treats as plausible.
Current CFI: 43
Post-Bill C-15 baseline, April 2026. Moderate band (25 to 45) — two points below the High threshold.
The CFI is not a speculative projection. It is scored from the documented record as of the April 2026 consultation deadline, giving a present-day baseline of 43 — the boundary of the Moderate and High bands. Public opposition and political traction dominate the composition; forced route changes are suppressed by the Bill C-15 s. 98 CTA deeming provision.
- Public 16 Cross-sector coalition; parliamentary testimony on ALTO-specific C-15 provisions.
- Political 11 Senate pre-study across 10 committees; 82 report-stage amendments.
- Environmental 9 Coordinated NGO objections; SARA engaged as primary statutory protection.
- Legal 5 Coordinated ATI programme across HICC, TC, PSPC, VIA Rail.
- Route 2 Pre-consultation; C-15 s. 98 CTA deeming suppresses this component.
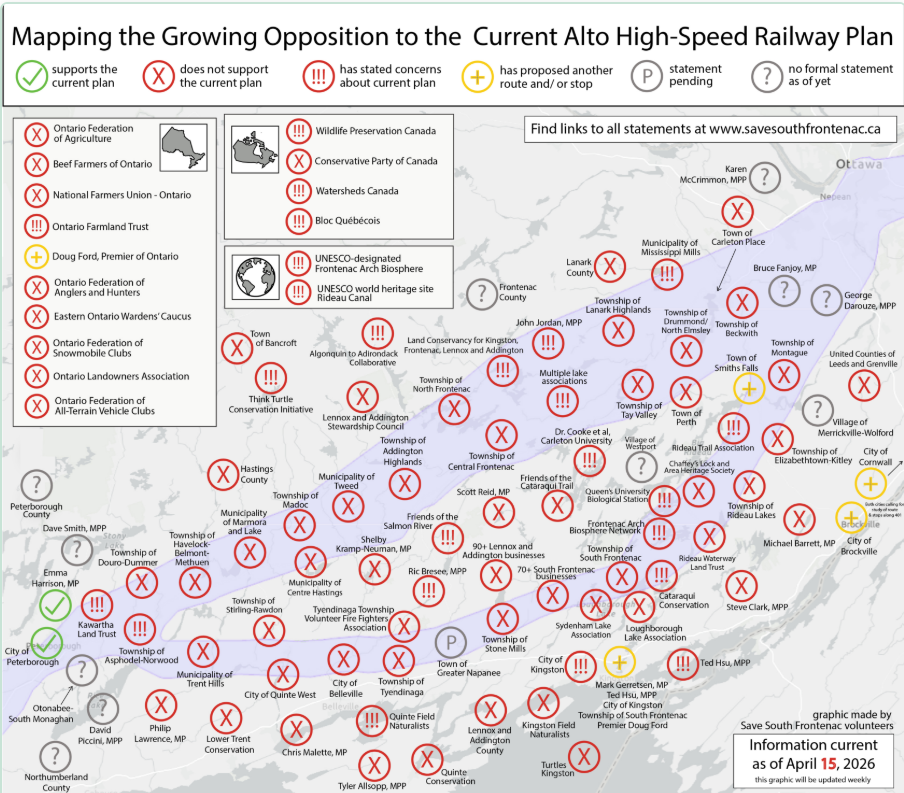
The opposition mapped
Opposition to the current ALTO plan is organised, multi-sector, and geographically continuous along the southern corridor. Ontario Federation of Agriculture, Beef Farmers of Ontario, National Farmers Union — Ontario, municipal councils, Conservation Authorities, MPs, MPPs, and dozens of community and business groups are on the public record.
Eight drivers of friction intensification
Repeatable conditions that move a project up the regression line. Multiple conditions together push scores into the Very High and Extreme bands.
Tokenistic or premature consultation
Announcing a preferred corridor before genuine engagement converts stakeholders into adversaries. HS2 and California HSR both followed this pattern.
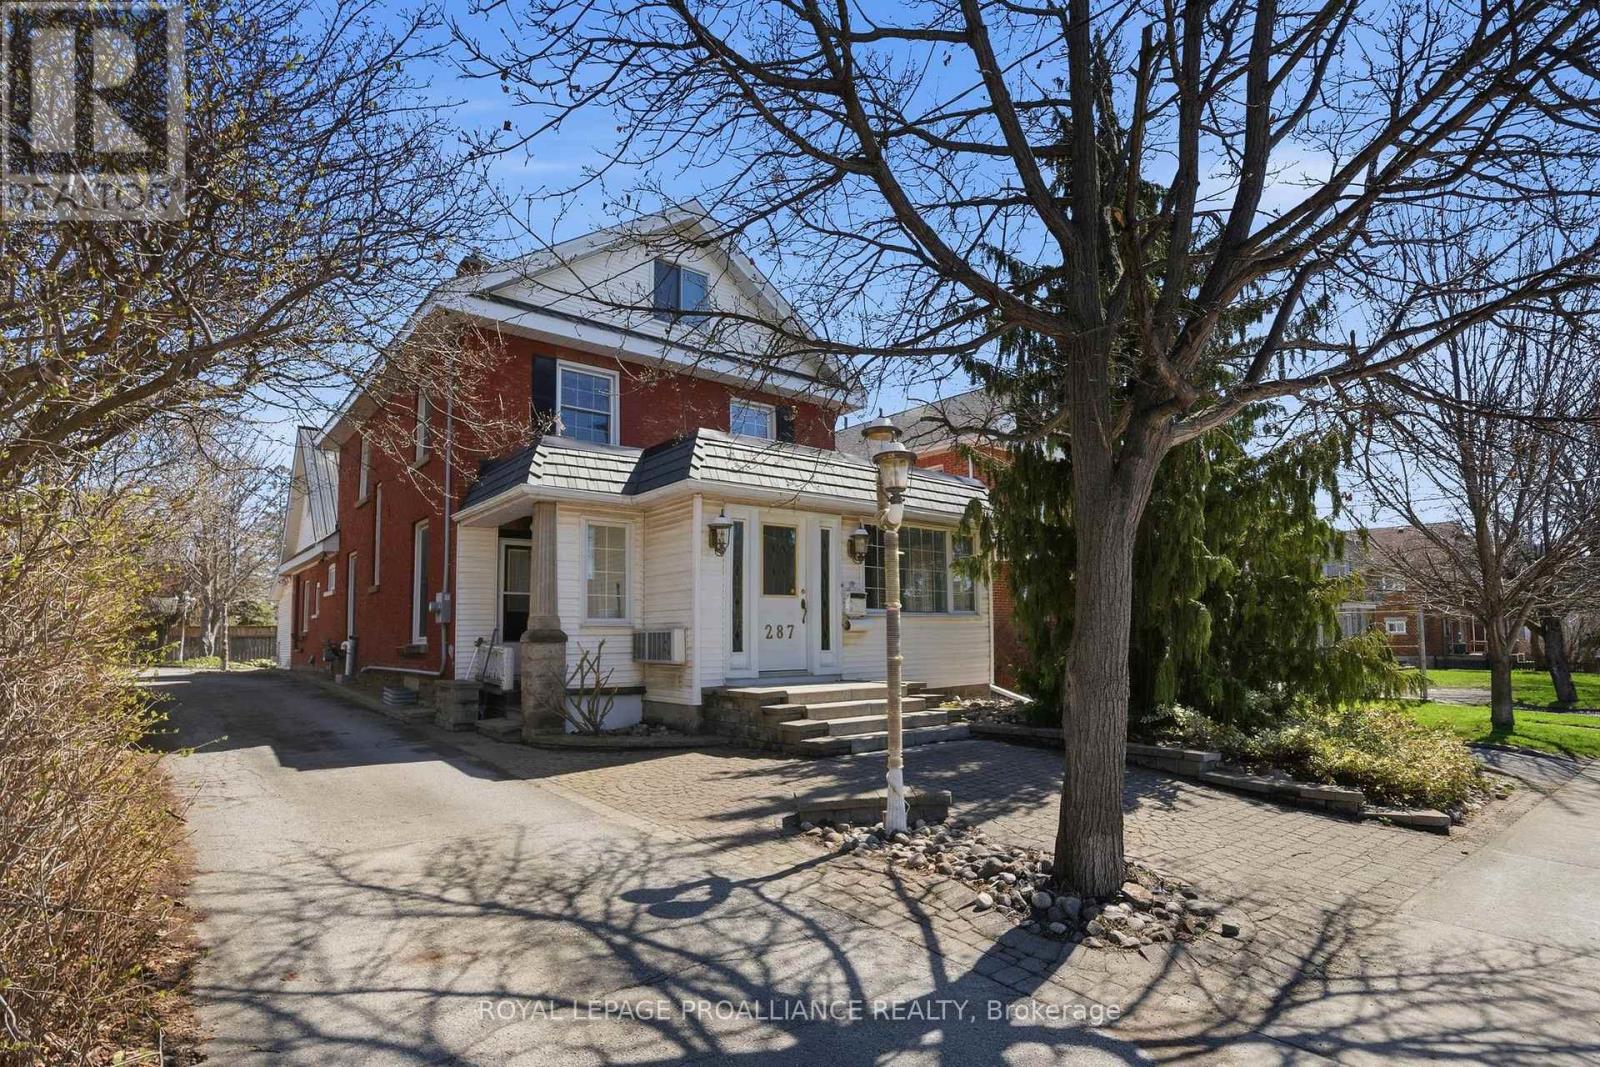
Route through farmland and established communities
Linear severance of agricultural land and rural properties generates durable opposition. Rural communities have the cohesion and time to sustain multi-year campaigns.
No transparency in corridor selection methodology
Where the technical basis for alignment is not disclosed, communities fill the vacuum with worst-case assumptions. ATI requests escalate; political risk multiplies.
Expansive or novel expropriation frameworks
Exceptional acquisition powers granted before environmental approval are experienced as an inversion of due process, attracting civil-liberties solidarity.
Business case credibility gaps
BCR visibly below standard appraisal thresholds gives opponents a legitimising narrative that attracts fiscal-conservative allies (Flyvbjerg et al., 2002).
Species-at-risk and ecological conflicts
SARA listings confer standing on environmental organisations and generate mandatory consultation obligations incompatible with project schedules.
Station location and community bypass
Remote interchange stations remove potential beneficiaries from the supporter base, creating a durable perception that the project serves external logic.
Delay and cost overrun signals
Each rescaling event increases friction. HS2 truncations and California HSR rebaselinings both reset scores upward with every announcement.
Three scenarios, one baseline
All three trajectories begin at CFI 43. The mid-energy endpoint (65) matches the parent note projection and is the basis for the $143 B central cost prediction.
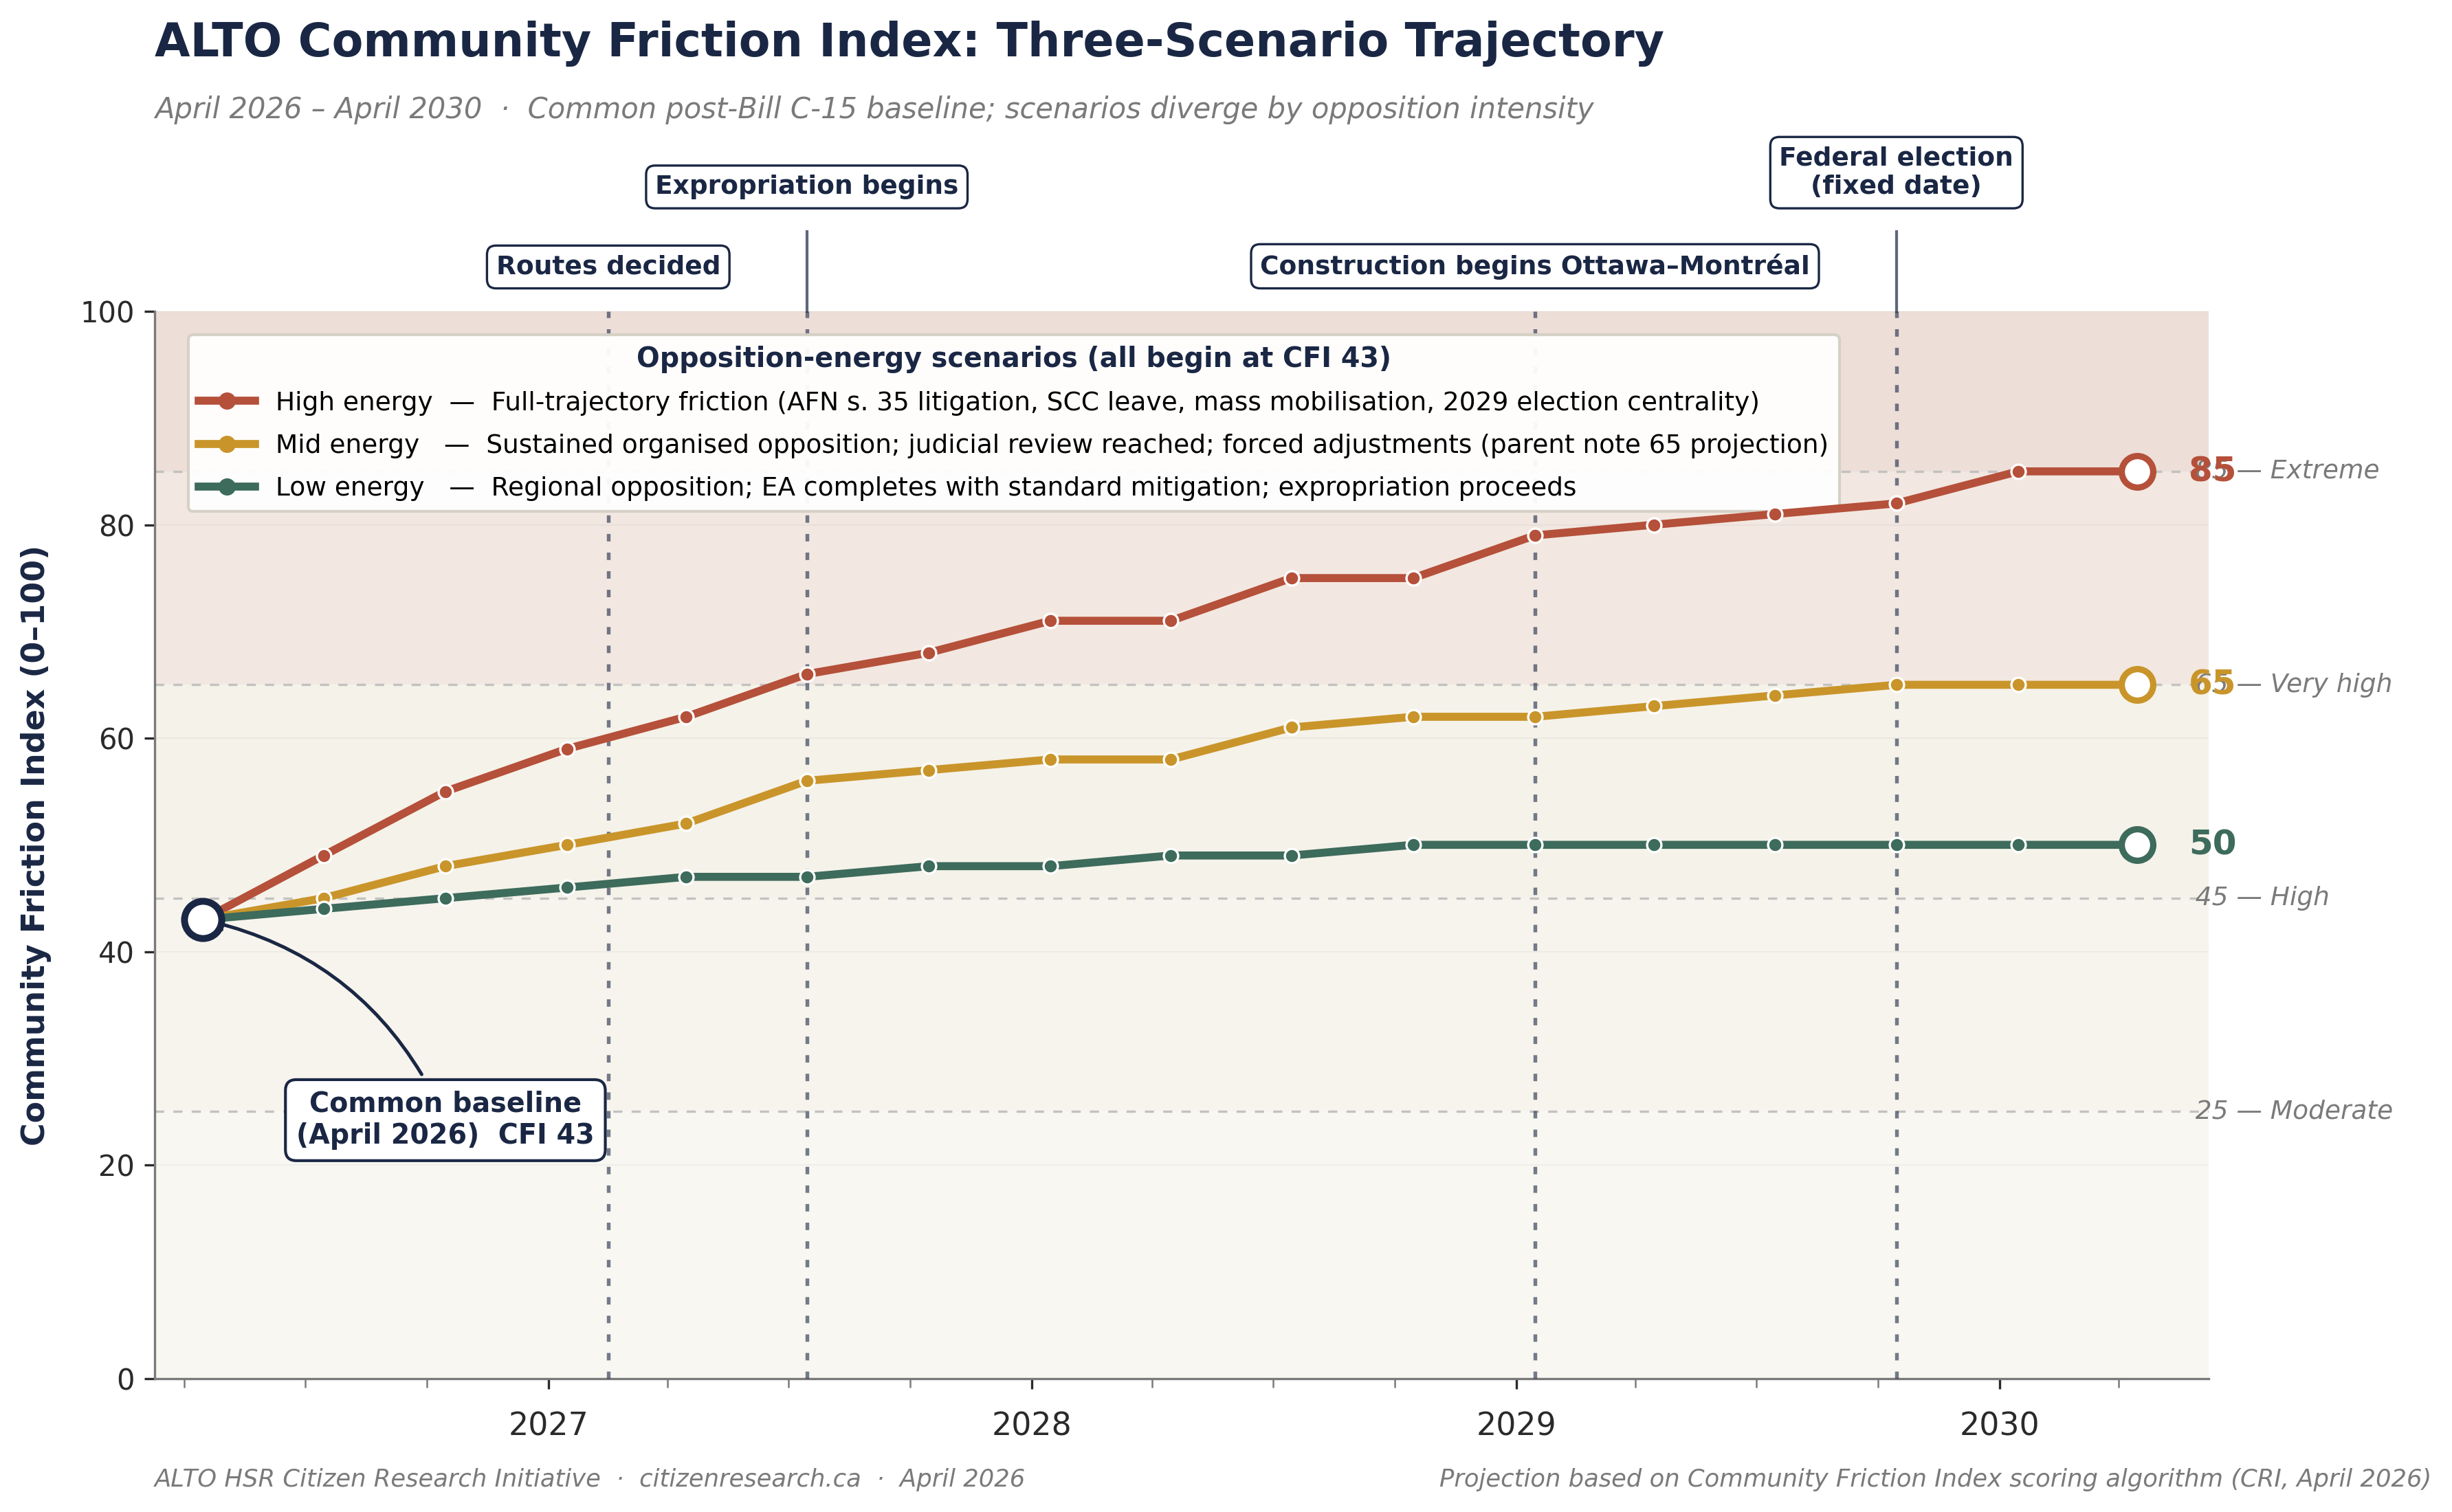
Extreme border
AFN s. 35 litigation, SCC leave, mass mobilisation, 2029 election centrality.
Very high border
Sustained organised opposition; judicial review reached; forced adjustments. Parent note projection.
High band
Regional opposition; EA completes with standard mitigation; expropriation proceeds.
What drives the mid-energy trajectory
Decomposed into its five components, the mid-energy path to CFI 65 is dominated by growth in legal activity (+8) and route challenges (+5). The Bill C-15 s. 98 CTA deeming provision caps Route growth; legal pressure is displaced into ATI, judicial review, and constitutional avenues.
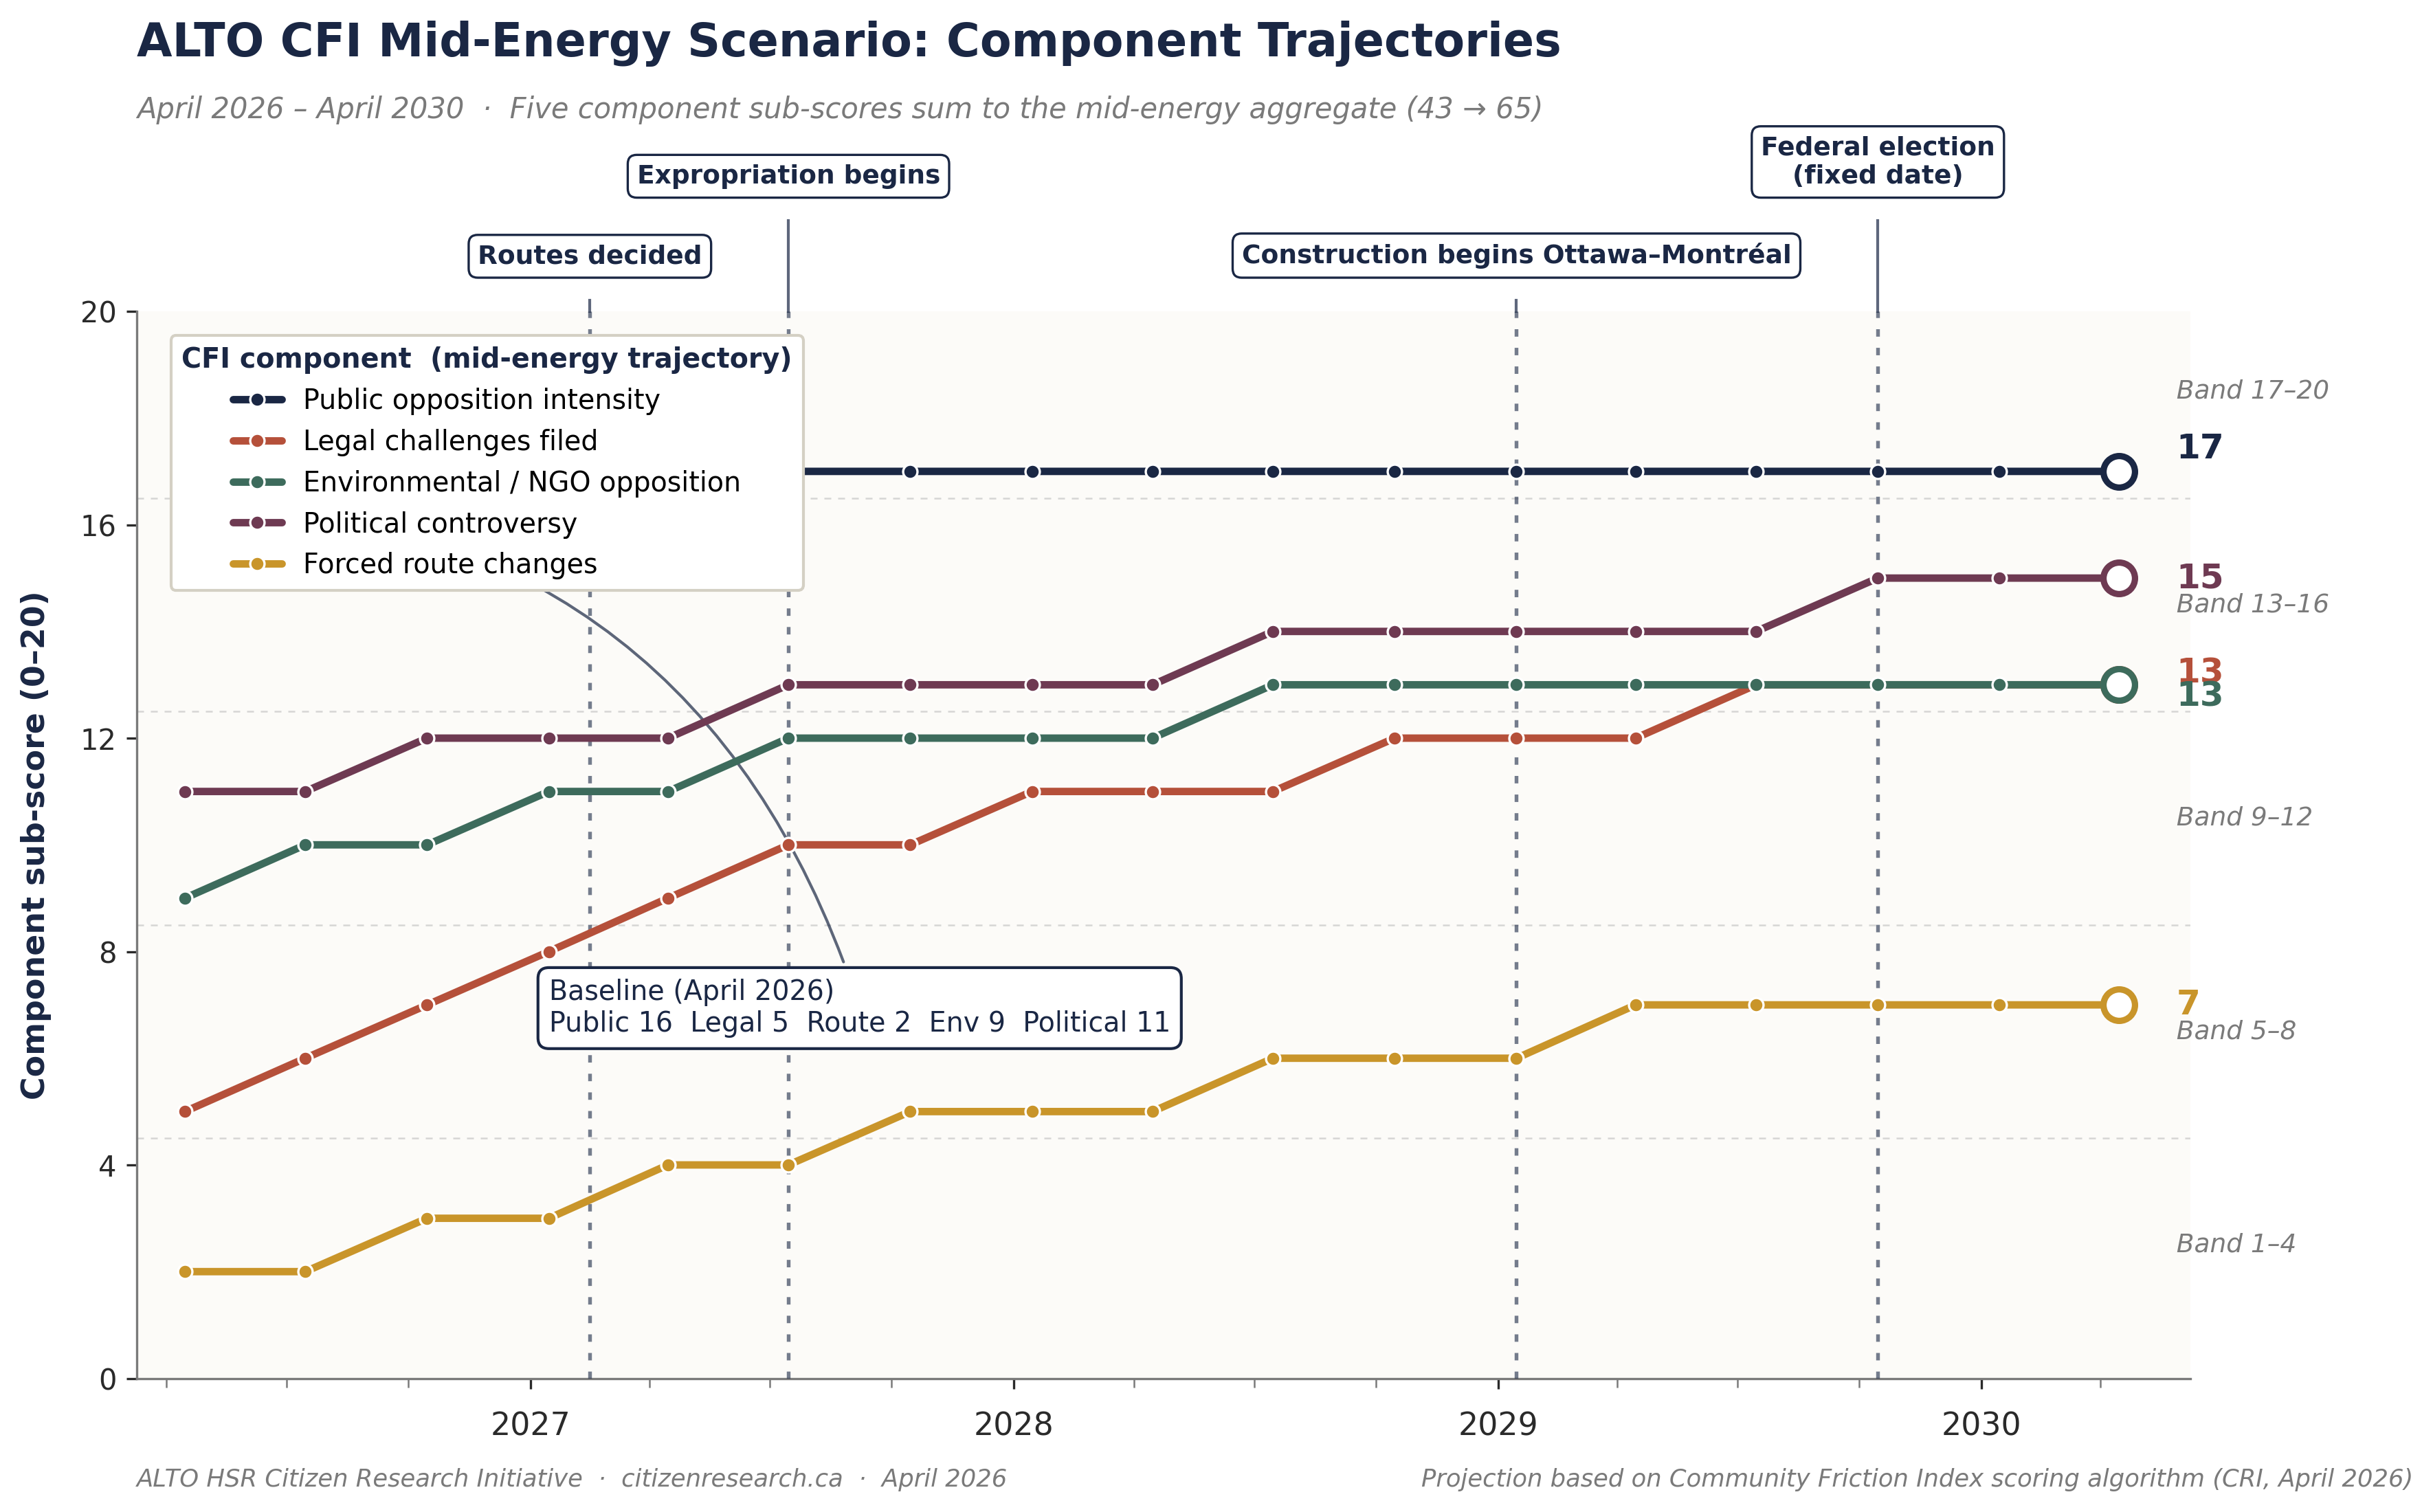
Legal +8 steepest riser; C-15 closes parliamentary channels and litigation becomes the primary pressure point. Political +4 dampened through 2027–28 (majority insulation); bumps at October 2029 election. Environmental +4 plateaus at 13; higher indicators require SARA stop-work or Indigenous parallel action. Route +5 slowest riser; s. 98 CTA deeming caps this component by statute. Public +1 near-flat; mid-energy assumes organised but non-mass-mobilisation opposition.
ALTO’s $75 B declared cost sits at the 2.5th percentile
The reference-class central prediction is $143 B. The proponent’s own figure coincides with the bottom edge of the 95 % prediction interval — a 1-in-40 outcome under the model.
The 95 % prediction interval
Under a log-normal error distribution (symmetric in log space), the reference-class model’s 95 % prediction interval runs from $76 B at the lower 2.5 percentile to $264 B at the upper 2.5 percentile. ALTO’s declared $75 B coincides with the lower boundary.
“The proponent’s own cost estimate coincides with the most extreme lower-bound outcome the reference-class model treats as plausible — roughly a 1-in-40 probability the corridor actually comes in at or below $75 B.”
ALTO at the consultation deadline
The public-facing footprint of the project dramatically outsizes its technical and environmental capacity — with the core deliverables of a credible consultation still absent at the April 24 deadline.
Construction costs · schedules · ridership forecasts · revenue models · operating costs · risk and opportunity analysis · Cadence consortium agreement.
Air Canada CEO Michael Rousseau has announced retirement by September. ALTO representatives reported to be departing amid backlash and sharper public questioning. Residents, media, and municipal bodies pressing for substantive answers.
ALTO costs five times more than HPR
The predicted cost gap is roughly half engineering, half community friction — not a function of timing. Both projects fall on the same regression surface; they sit on very different points of it.
300 km/h dedicated HSR · southern corridor
200 km/h 401 corridor · HPPR + liberated Kingston Sub
Decomposition of the 5.0× cost gap
The model decomposes the cost gap cleanly between the two independent indices. Roughly half the gap is engineering complexity (ΔECIw = 32, accounting for 47 %), and roughly half is community friction (ΔCFI = 35, accounting for 53 %). The time dimension contributes nothing — completion year is not significant once both indices are controlled for.
ECI drops because the 401 corridor is already disturbed ground with grade separations co-located with planned highway widening — most of the hardest engineering has already been done, or is about to be, for the road. CFI drops because HPR routes along an existing transportation corridor through communities that already host the 401 — not through greenfield farmland and the Frontenac Arch Biosphere.
ALTO’s predicted cost is $143 billion
The joint ECIw + CFI model explains 90 % of cross-project variance. The 95 % prediction interval runs from $76 B to $264 B over 1,000 km.
Central estimate across the 1,000 km ALTO corridor
ECIw = 77 · CFI = 65 · mid-energy scenario endpoint
“The proponent’s declared $75 B coincides with the lowest outcome the reference-class model treats as plausible.”
Read the full research
This page summarises the key figures and arguments. The full research record — data tables, scoring rubrics, references, and the complete regression output — is published in the research report and the briefing deck.