Tag: value of time

  • 3 claims 1 fare

    Three Claims, One Fare

    ALTO makes three promises about the high-speed railway. All three depend on one number it has never published — the price of a ticket.

    The argument in plain terms

    ALTO promises three things at once: that 24 million people a year will ride the new railway; that they will save 9.3 billion hours of travel time, worth $49.5 billion; and that ticket sales will cover the cost of running and maintaining the line. Each promise sits in a different part of the report, backed by different evidence.

    All three depend on one number the report never gives: the price of a ticket. Cheap tickets fill trains, which is what the first two promises need. Expensive tickets bring in the revenue the third promise needs. A fare cannot be cheap and expensive at the same time, so the three promises pull against one another.

    Work out the single fare at which all three could hold, and it comes to about 19 cents per kilometre travelled — roughly $83 for a typical 428-kilometre journey. At that price the railway breaks even only if 24 million people ride it, and 24 million people ride it only if the corridor is generating about 74 million intercity trips a year, by all modes. On ALTO’s own population figures, the corridor will generate about 34 million.

    So making all three promises at once means making a fourth one that is never stated: that by 2055 the corridor would have to be generating more than twice the intercity travel that ALTO’s own population figures produce. Nobody forecasts travel on that scale, and that is exactly the difficulty.

    ⚠ How to read the fares on this page

    Fares here are given per kilometre travelled, because that is how railway revenue is calculated. A passenger-kilometre is simply one traveller going one kilometre, so a fare of $0.15 per kilometre means a passenger pays 15 cents for every kilometre of their journey. Multiply by 428 km — the average journey — for a rough ticket price: $0.15 is about $64, $0.22 about $94, $0.28 about $120, and the $0.193 break-even fare about $83.

    Modal Shift Notes and O&M Notes, referred to throughout, are earlier papers in this series and are available at citizenresearch.ca.

    2.19×
    how much more intercity travel the corridor would have to generate for all three promises to hold: 73.9 million trips a year against 33.7 million forecast
    §6.1
    $0.193
    the only fare at which all three could hold — about $83 a journey. At that price the railway carries about 11 million riders, not 24 million
    §6.1
    63%
    the most of its running costs the railway can recover from fares at any price. Fares pay about 63 cents of every dollar; the rest comes from the public
    §8
    Download
    Three Claims, One Fare — Full Brief (PDF)
    The complete arithmetic, set out step by step, with every figure sourced so that any part of it can be checked or rejected

    Download PDF

    The Three Promises

    Three claims that are only ever made separately

    Where this comes from. ALTO is the company proposing the high-speed railway. In August 2026 it published a report, Canada’s Moment: The Economic Opportunity of High-Speed Rail, making the three claims set out below. This page is a plain-language version of an independent check of those claims against published population and travel data — in effect, a fact-check of ALTO’s report. Every step of the arithmetic is shown so that any part of it can be rejected.

    Three numbers do the persuasive work in ALTO’s report Canada’s Moment. They appear in different chapters, rest on different evidence, and are never set side by side. Put side by side, they turn out to want opposite things from the price of a ticket.

    The Promise What it needs the ticket price to do
    1. Ridership. 24 million passengers a year by 2055, rising after that. Be low. The cheaper the ticket, the more people ride — and for a family of three or more, driving already costs almost nothing extra.
    2. Economic benefit. 9.3 billion hours of travel time saved, worth $49.5 billion. Be low. Every benefit counted in the appraisal — time, car costs, safety, congestion, emissions — depends on how many people actually switch to the train.
    3. Paying its own way. “The railway pays for its own operations and maintenance.” Be high. Most of the cost of running the railway stays the same whether the trains are full or empty, so covering it depends on how much each passenger pays.

    The first two promises pull the fare down. The third pulls it up. That is not a criticism of high-speed rail; every high-speed railway ever built faces the same squeeze. The criticism is that the report presents all three as true at the same time without ever showing the fare that would deliver them.

    Why These Are One Promise

    Everything runs through the ticket price

    Picture a single dial: the price of a ticket. Turning that one dial moves all three of ALTO’s claims at the same time, because all three are calculated from it. Turn the price down and more people ride, which automatically raises the total hours saved, because total hours saved is just hours per person multiplied by the number of people. But turn the price down and each ticket brings in less money, so covering the railway’s costs gets harder. The three claims are not three separate discoveries. They are three readings taken off the same dial — and ALTO’s report never shows you the setting it used.

    The fare is not a detail to be settled later, once the business case is agreed. It is the number the business case turns on. It enters the arithmetic twice, pulling in opposite directions, and everything else follows automatically.

    1 — The fare sets how many people ride

    The fare sets how expensive the train is next to driving or flying, which sets the share of trips that choose rail. Apply that share to the total number of intercity trips in the corridor and you have annual ridership.

    2 — Ridership sets both the benefits and the revenue

    Riders multiplied by the length of the average journey gives total passenger-kilometres. That single quantity drives the hours saved and the ticket revenue. There is no way to improve one without damaging the other.

    3 — So the first two promises are the same promise

    If the hours saved per passenger are held at ALTO’s own figure, the economic benefit is simply the number of riders multiplied by a fixed amount. The $49.5 billion is the 24 million riders, restated in dollars. That leaves two propositions, not three: one about demand, one about covering costs.

    Three numbers agreeing is not three checks passing

    If one team checked ridership, another checked time savings and a third checked whether fares cover costs — each using its own method — and all three agreed, that would mean something. That is not what happens here. All three start from the same unpublished ticket price, so of course they agree. They are three shadows cast by the same object. They will always line up, and their lining up is no evidence that the object is the right shape.

    4 — And two propositions have one joint answer

    Two equations with two unknowns — the fare and the number of riders — will usually have a solution. The claims are not inconsistent with one another. The question is what that solution demands of the corridor.

    The Travel Market

    How much intercity travel there is to win

    The corridor’s total travel market is its population multiplied by the number of intercity trips each resident makes on the routes the railway would serve. Modal Shift Note 3 puts the 2025 corridor population at about 14.9 million across the cities directly served, growing at 1.0 per cent a year, and puts intercity travel at about 1.68 trips per resident per year.

    20.1M
    people living in the corridor in 2055, on the central growth path
    Modal Shift Note 3
    33.7M
    intercity trips a year in 2055, by every mode — car, air, bus and rail combined
    20.1M × 1.68 trips each
    71%
    the share of that entire market ALTO’s 24 million riders would represent
    24.0M ÷ 33.7M

    Seventy-one per cent of all intercity travel — car, air, bus and rail together — is a share no high-speed railway is known to have won. It is worth being precise about this, because the famous European figures look higher and are not the same measure. Roughly 75 per cent of Madrid–Barcelona travellers choose the train over the plane, and more than 80 per cent on Madrid–Seville; those are shares of the rail-and-air market, which excludes the car. Against a car that costs its driver almost nothing extra to fill, no comparable share of the whole market has been recorded. Nor is 71 per cent a forecast that fails at some fares and works at others. As the sections below show, no fare produces it.

    What Each Ticket Price Delivers

    Three realistic fare levels, and what each one buys

    Modal Shift Note 3 sets out three combinations of fare and subsidy spanning the realistic range of policy, and reports the share of the market each one wins. The dollar figures are this note’s translation of those descriptions into a fare per kilometre; Note 3 publishes no dollar figures, so the translation is an inference. Every figure below uses the version most favourable to the project.

    The Fare Level What it delivers
    A — Heavy subsidy. $0.15 per km (about $64 a journey). Fares held at today’s VIA Rail levels, with $2.5–4.5 billion a year of public money covering construction costs. 13.5 million riders a year — 38–42% of the market. $27.8 billion of benefit against the $49.5 billion claimed. Fares cover 54% of running costs.
    All three promises:Not met
    B — Moderate subsidy. $0.22 per km (about $94 a journey). Fares matched to airfares, with $1.5–2.5 billion a year of public money covering construction costs. The arrangement the published business case appears to assume. 10.1 million riders a year — 28–32% of the market. $20.9 billion of benefit. Fares cover 64% of running costs — the best result available at any price.
    All three promises:Not met
    C — Minimal subsidy. $0.28 per km (about $120 a journey). Fares set by a private operator to maximise revenue, above airfare levels, with $0.5–1.5 billion a year of residual public support. Closest to a commercially structured P3; ALTO has published no payment mechanism. 7.3 million riders a year — 20–23% of the market. $15.0 billion of benefit. Fares cover 63% of running costs.
    All three promises:Not met
    ALTO as published. No fare stated anywhere in the report. 24.0 million riders a year — 71% of the market. $49.5 billion of benefit. Fares cover 100% of running costs.
    Fare required to produce this:Never published

    Even on the most generous treatment — the heaviest subsidy, mature ridership rather than the slower build-up of the opening years, and ALTO’s own hours saved per passenger accepted exactly as published — the economic benefit is $27.8 billion, not $49.5 billion. That is a reduction of 44 per cent arising from the ridership side alone.

    Paying the Running Costs

    Why cheap tickets cannot fix the finances

    Think of a gym. It pays rent whether 10 people turn up or 1,000 — that cost is fixed. It also buys more towels and cleaning supplies as more people come — that cost varies with use. A railway works the same way, and the split matters more than it might sound.

    Running a railway costs money in two ways. Some costs stay the same however many people ride — track, structures, signalling, stations, head office, and buying the trains. Others grow with the number of trains you run. On ALTO’s own figures, spread over the life of the assets at its own 3.5 per cent rate, the fixed block is $1,130 million a year, and 61 per cent of the total cost does not move with ridership at all.

    That is why cutting fares to fill the trains does not fix the finances. It helps a little at first — more passengers spread across the same fixed cost — and then makes matters worse, because each extra passenger is paying less. Cost recovery does not simply improve as fares rise. It improves, peaks, and then falls back.
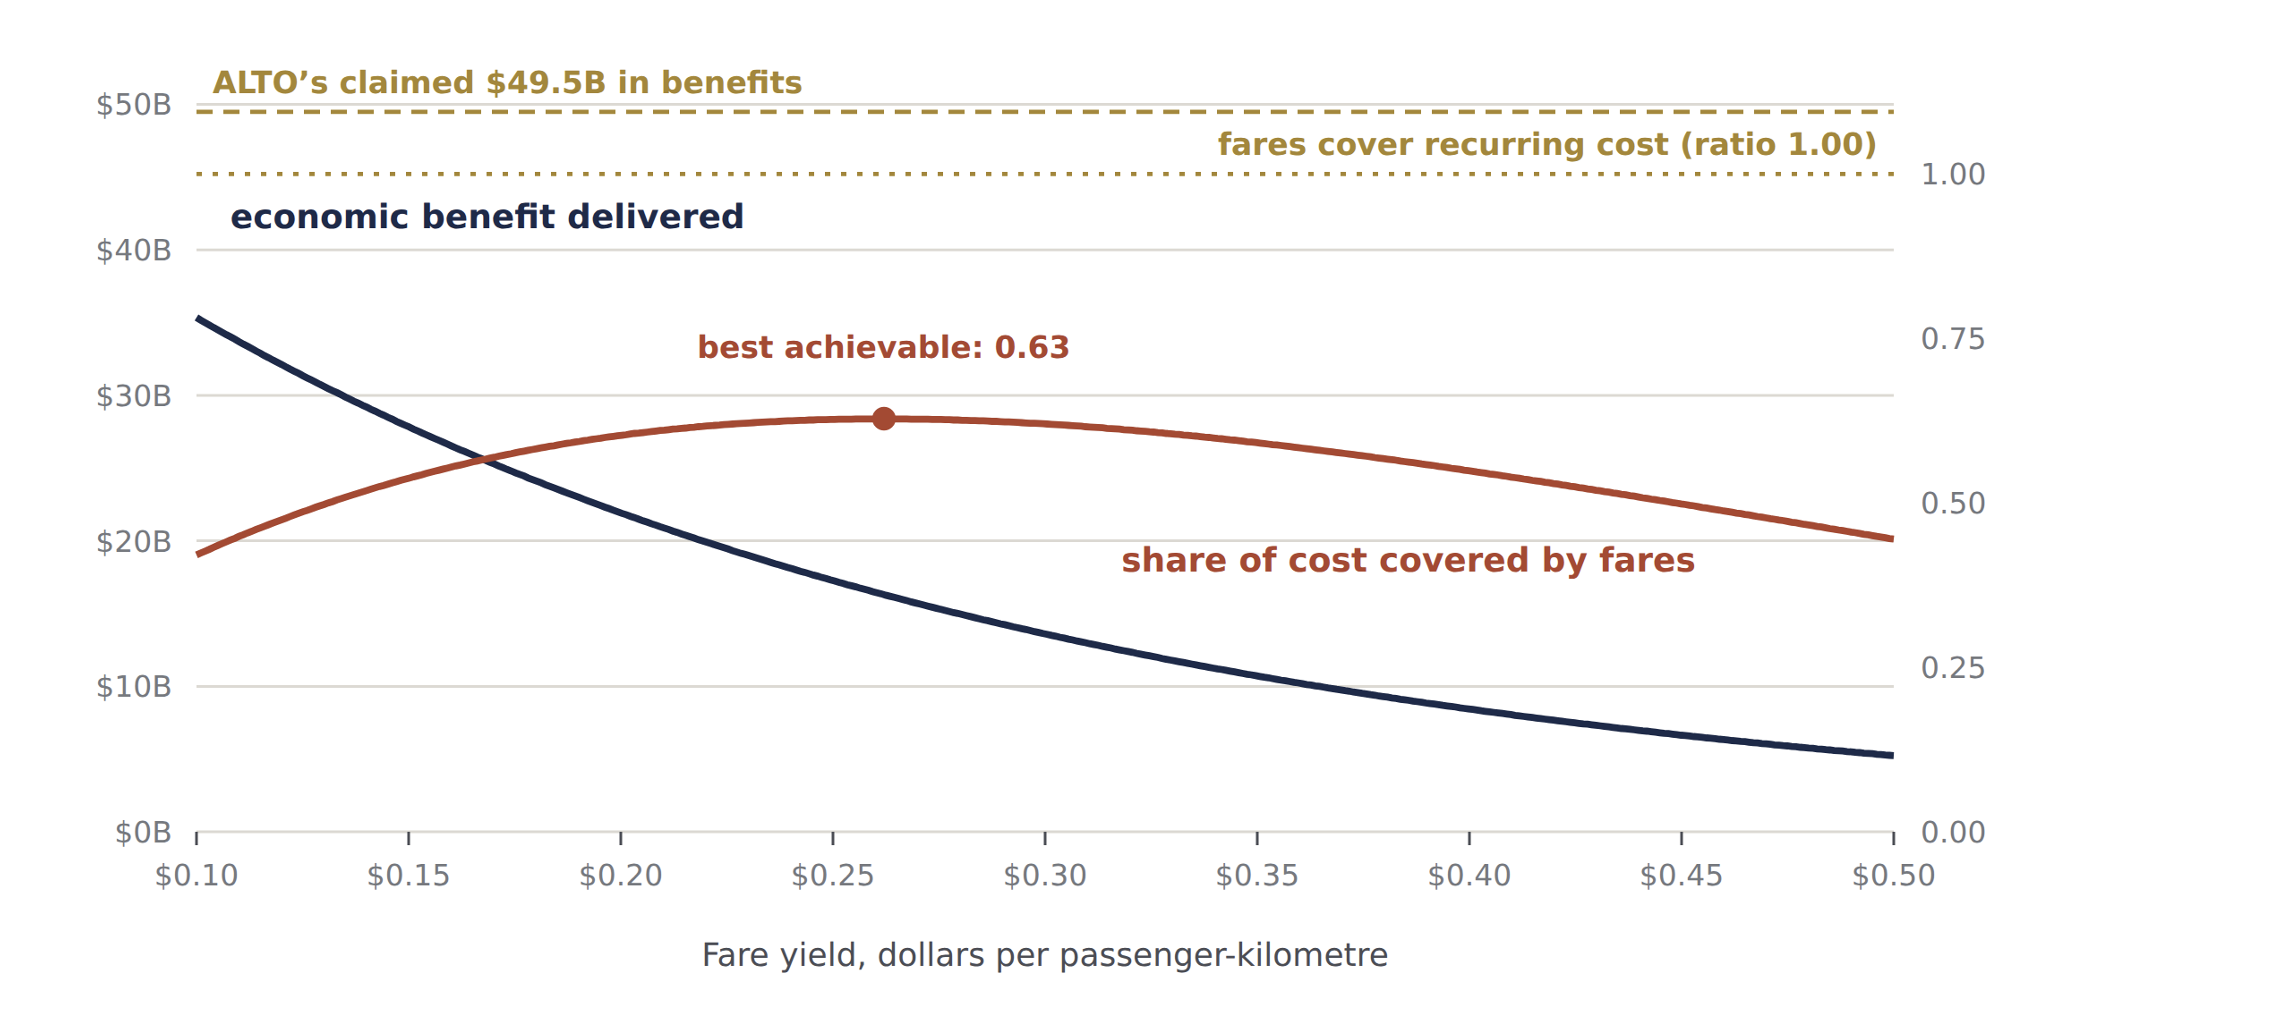
    Chart: economic benefit delivered and share of running costs covered by fares, at each fare. Neither of ALTO's two claims is ever reached.

    Figure 2. Neither promise is ever reached. The economic benefit delivered (navy, left axis) and the share of running costs covered by fares (rust, right axis), at each fare. The two gold lines are ALTO’s two claims. Benefit falls steadily as fares rise; cost recovery rises, peaks well short of covering everything, then falls away as riders drop off. The fare that comes closest to one claim is far from the other. The chart shows cost recovery as a ratio, so its peak of 0.63 is the 63 per cent described here, and the gold line at 1.00 is fares covering costs in full.

    The ceiling is about two-thirds

    The turning point sits at a fare near $0.26 per kilometre, where fares cover about 63 per cent of running costs. The best of the three published levels reaches 64 per cent. At no price in the corridor as forecast do fares cover the cost of running the railway. Fares pay about 63 cents of every dollar; the remaining 37 cents comes from the public, every year, forever.

    And the best fare for the finances is the worst for the benefits

    The fare that comes closest to paying for the railway delivers roughly $16 billion of the claimed $49.5 billion in benefits. The fare that comes closest to one promise is nowhere near the fare that delivers the other.

    Against the cost of building it, nothing reaches a dollar

    Construction of roughly $75 billion, spread across 2027–2037 and discounted at 3.5 per cent, is worth about $57 billion in today’s dollars. Measured against that, every dollar returns 49 cents of benefit at fare level A, 36 cents at level B and 26 cents at level C. ALTO’s own published benefits return 86 cents — and that failure is ALTO’s own arithmetic, not this note’s. None of these figures counts the operating shortfall above, which the public would have to fund on top.

    The Three Promises Joined Up

    There is exactly one answer, and it is about the corridor

    The obvious next step is to check the promises one at a time and report that none of them survives. That is true, and it is set out below. But it is the weaker exercise, because it invites the reply that the whole thing is merely a disagreement with three forecasts.

    A short detour, because the next step depends on it. Suppose you are told two things about a bag of marbles: it holds 18 marbles, and there are twice as many red ones as blue. Neither fact on its own tells you how many are red. Put them together and there is exactly one answer — 12 red and 6 blue. Two facts, each loose on its own, can lock onto a single exact answer once you require both to be true at the same time.

    The same move works on the railway. “24 million riders” is one fact. “Fares alone cover the running costs” is another. Neither tells you the ticket price by itself — plenty of low prices might draw 24 million riders, plenty of high ones might cover costs. Require both at the same price, and as with the marbles there is only one price where that is possible.

    The stronger exercise is to solve the two propositions together and ask what corridor would satisfy them. Covering costs fixes a relationship between the fare and the number of riders; so does the ridership promise. Two equations, two unknowns, one answer.

    The one fare, and the one market, that satisfy all three

    Covering 100 per cent of running costs at exactly 24 million riders requires a fare of $0.1935 per kilometre. At that fare the train wins 32.5 per cent of the market. For 32.5 per cent to equal 24 million riders, the corridor must be generating 73.9 million intercity trips a year. It is forecast to generate 33.7 million. The ratio is 2.19×.

    There is only one such point, and it is worth being clear about why. Above $0.193 the railway covers its costs but carries fewer than 24 million people; below it, it carries more but cannot pay for them. Only at $0.193 do the two meet, and where they meet is fixed by the size of the market. The three promises do not contradict each other. They contradict the corridor.

    That unstated assertion has a value, and it can be put in whichever units a reader finds easiest to judge:

    Expressed as Required by the three promises, against the forecast
    Intercity trips a year, all modes 73.9 million required, against 33.7 million forecast — 2.19×
    People living in the corridor in 2055 44.0 million required, against 20.1 million forecast — more people on the Toronto–Québec City axis alone than live in Canada today
    Intercity trips per resident, per year 3.68 required, against 1.68 — corridor residents travelling more than twice as often as the evidence supports, at a time when remote and hybrid working push the other way
    Annual population growth, 2025–2055 3.7 per cent a year sustained for three decades, against a central forecast of 1.0 per cent and a high forecast of 1.6

    Anyone wishing to defend all three promises therefore has exactly one thing to defend, and it is a claim about demand rather than about engineering or financing. Cheaper construction, faster trains and a different discount rate do not reach it. Only a larger travel market does.

    The Gap That Does Not Close

    No ticket price escapes the problem

    Within the corridor as forecast, is there some fare — between the three levels above, or beyond them — that escapes the problem? There is not, and the reason is structural rather than a matter of forecasting.

    Two things happen at once as the price goes up. The number of riders the railway needs in order to break even falls gently and steadily, like walking down a slope — each rider is worth more, so fewer are needed, but that effect fades out gradually. The number of riders available falls away sharply, because once the train costs about what driving costs, people stop switching to it very quickly. A gentle slope and a cliff do not meet.

    Put more precisely: raising the fare lowers the number of riders needed to break even, because each remaining passenger contributes more. But raising the fare also lowers the number of riders available, and it does so faster. The first effect tails off gradually. The second accelerates, because once the train loses its price advantage over a car that costs almost nothing extra to fill, passengers fall away sharply. The second effect always wins.
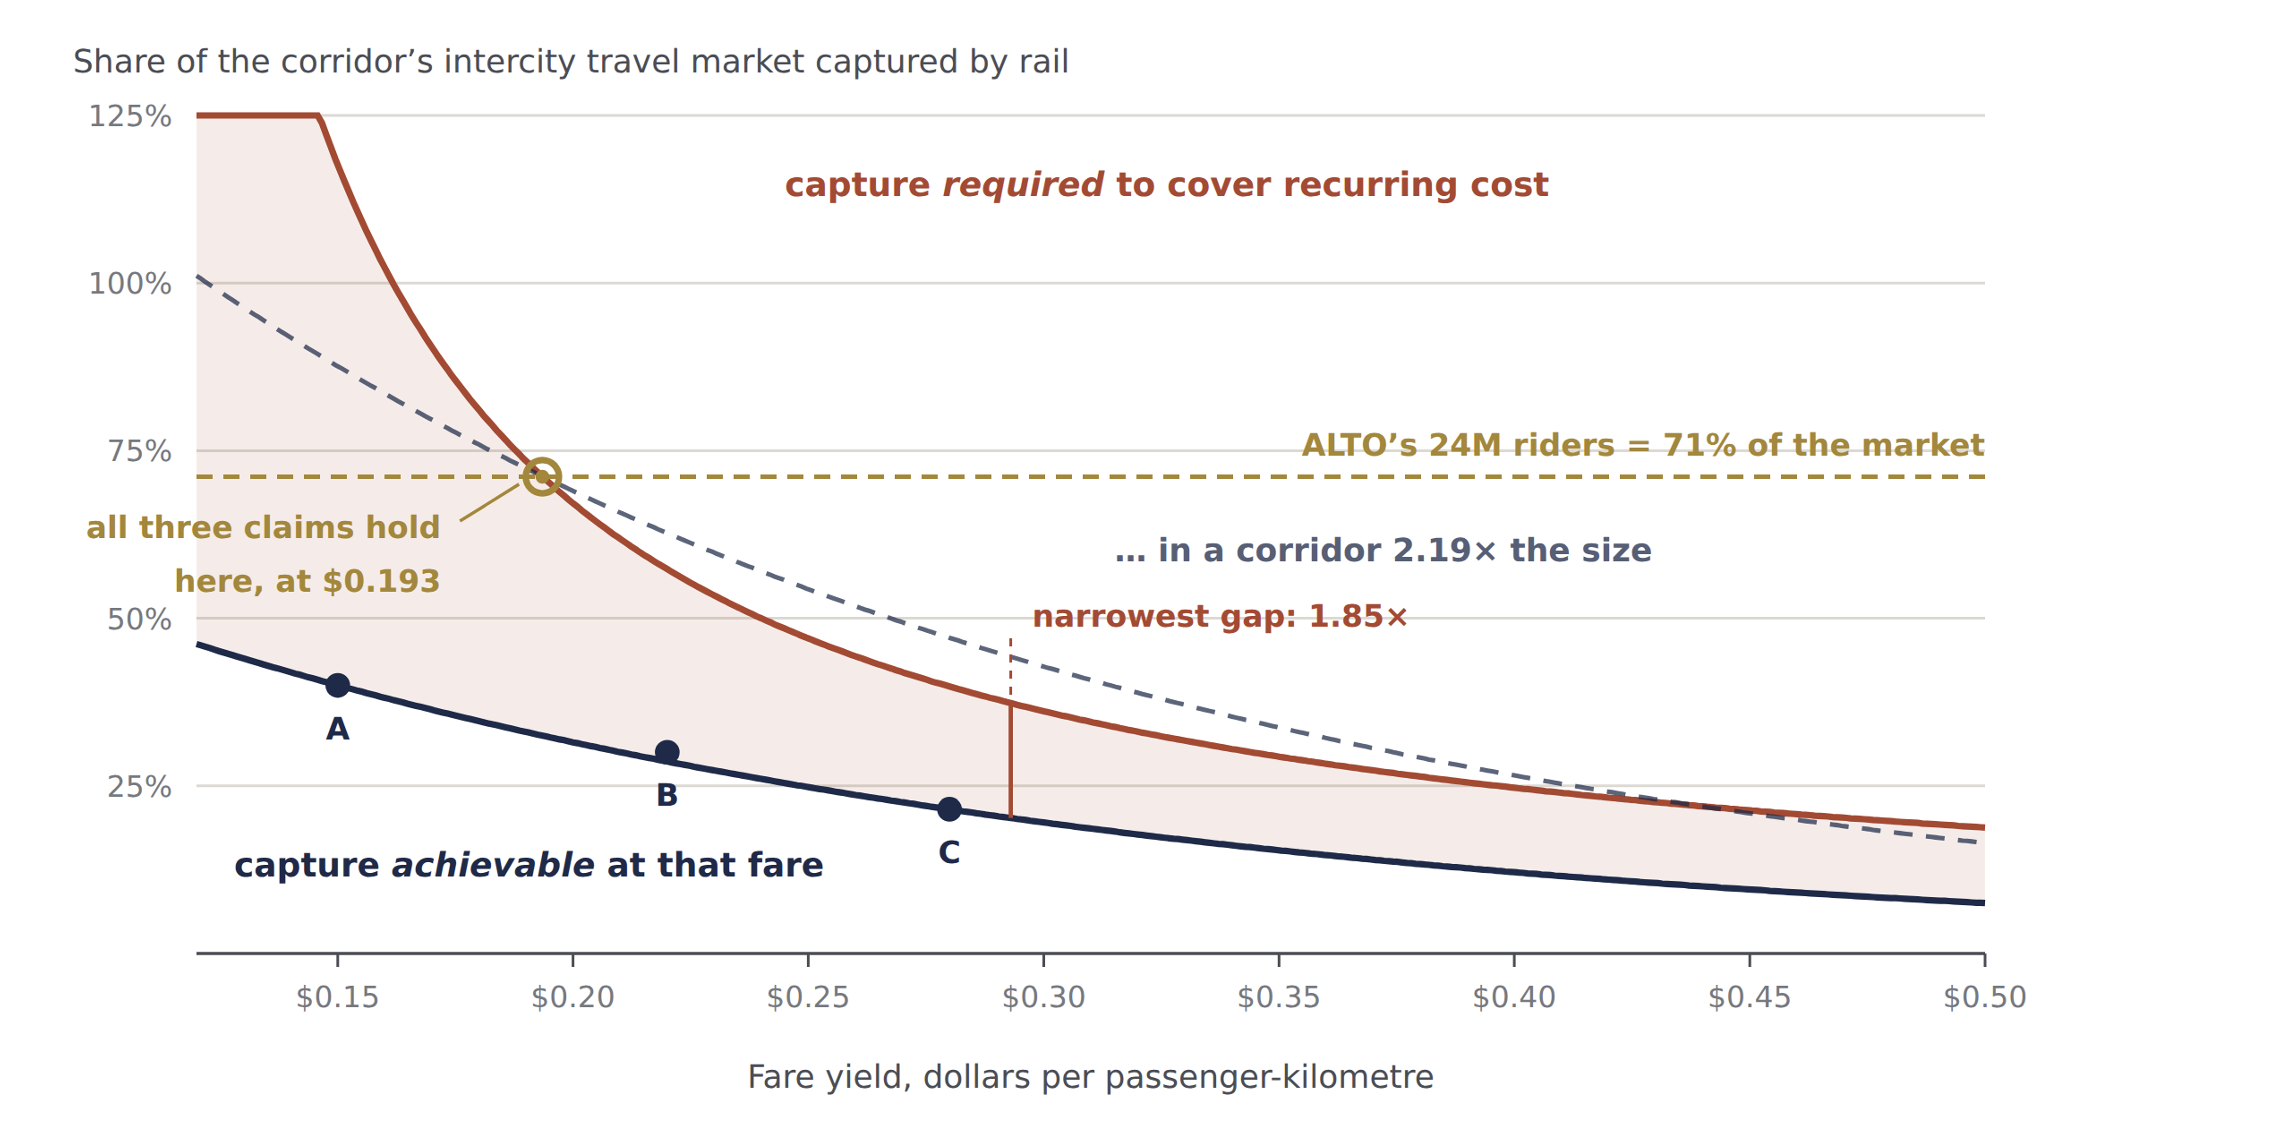
    Chart: the market share the railway needs to cover its costs, against the share it can win, at each fare. The two curves never meet.

    Figure 1. The two curves never meet at any fare. The rust curve is the share of the market the railway would need to cover its running costs; the solid navy curve is the share it can actually win. The shaded area between them is the gap. The dashed navy curve is the same demand curve in a corridor generating 2.19 times as much travel — it touches the rust curve at exactly one point, $0.193, and that point sits on the gold line marking the 71 per cent share ALTO’s 24-million forecast implies. The chart labels this share “capture”, and the fare “fare yield, dollars per passenger-kilometre”.
    At this fare Market share needed, against market share achievable
    $0.15 per km — fare level A
    about $64 a journey
    Needs 117.7% of the entire intercity market. Can win 40%. The railway would have to carry more trips than exist in the corridor at all, across every mode, simply to cover its running costs.
    $0.22 per km — fare level B
    about $94 a journey
    Needs 57.3%. Can win 30%.
    $0.28 per km — fare level C
    about $120 a journey
    Needs 39.8%. Can win 21.5%. This is as close as the gap ever comes: 1.85×, at about $0.29.
    $0.40 per km
    about $171 a journey
    Needs 24.7%. Can win 12.1%. The gap has started widening again as the ridership base collapses.

    Read the last figures as the size of the gap: at every fare, the railway needs between roughly twice and three times the market share it can actually win. There is no fare at which it closes.

    What Would Have To Change

    Fixing one promise at a time

    These are the terms a proponent is most likely to reply in. Three of the four turn out not to reach the joint answer at all.

    A larger travel market — reaches all three

    A corridor population of 34.0 million by 2055, or 2.85 trips per resident, brings 24 million riders within reach. Covering the running costs as well takes the 44.0 million of the joint answer. This is the only repair that reaches all three promises.

    Longer journeys — does not move ridership

    An average journey of 793–1,259 km, against the 428 km assumed — meaning essentially every passenger riding Toronto to Québec City end to end, and at fare level A a journey longer than the line itself. It would help cover costs. It puts nobody extra on a train.

    Lower running costs — covers costs only

    Running costs 37–46 per cent below the O&M Note estimates, with the fixed block down from $1,130 million to about $564 million. Again, nothing on the cost side puts passengers on trains.

    A stronger switch to rail — the same claim in different units

    The whole demand curve lifted by a factor of 2.19 at every fare. This is arithmetically identical to a bigger market, and equally a claim about demand.

    This is the asymmetry the brief turns on. Repairs on the cost side rescue the cost-covering promise and leave the ridership promise exactly where it was, because nothing on the cost side puts passengers on trains. Only a larger travel market reaches all three, and both routes to one — more people, or a greater willingness to switch — are the same claim in different units.

    Where Things Stand · August 2026

    Summary ledger

    Taking the promises one at a time, in the corridor as forecast, at every fare examined:

    Not met
    24 million riders a year. The ceiling across the whole fare range is 13.5 million. At the break-even fare of $0.193 it is about 11 million.
    Not met
    $49.5 billion in economic benefits. The ceiling is $27.8 billion, and that figure accepts ALTO’s own hours saved per passenger without challenge.
    Not met
    Fares cover the cost of running and maintaining the railway. The ceiling is 63–64 per cent, at any price, in the corridor as forecast.
    Robust
    The ceiling on cost recovery is the solid half of this finding. It sits inside the range of fares the modelling actually covers, and needs no projection beyond it.
    Softer
    The ceilings on riders and benefits involve projecting beyond the tested range at fares below $0.15, and a proponent is entitled to challenge them. The joint answer at $0.193 does not depend on any such projection.
    Answerable
    A proponent who accepts a 73.9-million-trip corridor is entitled to hold all three promises at once — and should be asked to say so plainly.

    The three promises are not logically inconsistent with one another, and this brief does not claim they are. There is a genuine joint answer. The difficulty is that the answer describes a corridor that does not exist — and that the fourth promise, the one about how much travel the corridor generates, is the only one ALTO has never had to defend, because it has never been stated.

    That distinction is not a technicality. A single claim that says “this project needs more than twice the travel demand anyone forecasts” invites immediate scrutiny. Three separately sourced numbers that merely happen to agree do not. Splitting one unproven assumption across three chapters is what allowed it to travel through public debate unchallenged — and catching that before tens of billions of public dollars are committed is the whole point of a review like this one.

    Download Full Brief
    Three Claims, One Fare (PDF)
    The complete arithmetic with every step shown, for anyone who wants to check or reject any part of it

    Download PDF

    Limits

    What this brief does not claim

    The translation of the three fare levels into dollars is an inference

    Modal Shift Note 3 defines the three levels by how much subsidy they need and how they compare with airfares, not in dollars per kilometre. The $0.15, $0.22 and $0.28 figures are this brief’s reading of what those descriptions imply. Anyone who rejects the reading should supply the fares the business case actually assumes — and the conclusion holds across the whole range of fares, not only at those three points.

    The 428-kilometre average journey is an assumption

    Carried over from revised O&M Note 3. It matters a great deal: revenue and hours saved both rise and fall with it.

    The construction cost figure is not ALTO’s

    The $75 billion is the midpoint of the $60–90 billion range used elsewhere in this series. ALTO publishes no comparable figure. The returns per dollar should be read as indicative, and they measure benefits against construction cost alone.

    Nothing here depends on the 9.3-billion-hour figure being correct

    It is held at ALTO’s own value throughout. If it is correct, the findings stand as stated. If it turns out to be overstated, the benefit column falls further still and every conclusion here becomes firmer, not weaker.

    The model of the train service is coarse

    A single 450-seat train type, uniformly 65 per cent full over a 1,000-kilometre corridor, is a simplification. A real railway would vary train length and frequency by section, which would cut the ridership-related costs somewhat when ridership is low. It would not touch the fixed costs, which is where the problem lies.

    Sources

    Primary documents and companion notes

    1.

    ALTO, Canada’s Moment: The Economic Opportunity of High-Speed Rail, August 2026. The 24-million ridership forecast, the 9.3 billion hours of travel time saved and the $49.5 billion total benefit figure at a 3.5 per cent discount rate.
    2.

    ALTO, Canada’s Moment, August 2026. The claim appears three times: in the chief executive’s foreword, where revenues are expected to cover all operating and maintenance costs and to offset the ongoing public subsidies conventional passenger rail has historically required; in the executive summary, where operating revenues are expected to fully cover operating and maintenance costs, transitioning passenger rail from a publicly subsidised service to a commercially viable operation; and in the financial chapter, where the project is expected to operate on a self-sustaining basis. The same chapter distinguishes day-to-day operating costs from initial capital investment and lifecycle costs, and states that revenues do not cover all costs once those are included — the distinction examined in revised O&M Note 3, which finds the claim true for day-to-day operations alone, marginal once renewals are included, and failing once the trains themselves have to be replaced.
    3.

    Modal Shift Note 3 — corridor population, starting point and growth path; intercity trips per resident. The 1.68 figure is the 2025 baseline; the working range is 1.6–1.8. Using 1.68 is marginally conservative against this brief’s own conclusion.
    4.

    Modal Shift Note 3 — market shares of 38–42, 28–32 and 20–23 per cent for the three fare levels, which Note 3 calls Regimes A, B and C.
    5.

    Revised O&M Note 3 — infrastructure $1,016M, operations $700M and fleet $127M a year, spread over the life of the assets at 3.5 per cent real; the fixed and variable split giving $1,130M fixed and $8.91M for each train per day.
    6.

    Statistics Canada, The Daily, 17 June 2026 — Canada’s total population estimated at 41,417,056 on 1 April 2026, a decrease of 55,025 over the preceding quarter.
    7.

    Fare levels, service assumptions and the joint solution are set out in full in the PDF brief, including the two equations solved simultaneously in §6.1.
  • Hours are not dollars

    Hours Are Not Dollars

    Almost none of ALTO’s $49.5 billion is money. It is time — and a saved hour cannot service a loan. Here is what that figure actually is, how it was built, and why it says nothing about who pays for the railway.

    ⚠ Where the Number Sits

    In August 2026 ALTO published Canada’s Moment: The Economic Opportunity of High-Speed Rail, reporting $49.5 billion in benefits against a construction cost of $60 to $90 billion. Those benefits are not money in a bank account. They are mostly hours — time that travellers would have spent on the road or at an airport — stretched over sixty years and converted into today’s dollars.1

    The tool that does the converting is called a discount rate. ALTO uses 3.5 per cent a year. Change that one number and the headline changes by tens of billions, without a single train or passenger changing.

    In One Paragraph

    The $49.5 billion is a measure of worth, not of funds. The tool that produces it, a discount rate, answers the question is this worth doing? It does not answer the question who pays, and how? Those are separate ledgers, and ALTO’s report is detailed on the first and thin on the second. This explainer sets out what the rate does, shows the arithmetic openly, and then follows the money to the place the appraisal never goes: the difference between what it costs the government to borrow and what a private partner needs to earn.

    One finding runs against the grain and is stated here first. Two of the adjustments ALTO leaves out would have made its benefit figure larger, not smaller. The problem is not that the number is tilted. The problem is that a reader is given one number, no range, and no way to know that any of these choices were made.

    Start Here

    What a discount rate is, in ordinary words

    Ask yourself a simple question. Would you rather have $100 today, or $100 in forty years? Almost everyone takes it today. The money is useful now, the future is uncertain, and by 2066 we will probably all be somewhat better off anyway, so $100 will matter a little less to us then than it does now.

    Economists turn that instinct into a percentage. A discount rate shrinks future amounts back to what they are worth to us today, by a fixed amount each year. At 3.5 per cent, a benefit arriving sixty years from now counts for about 13 cents on the dollar. At 8 per cent, the same benefit counts for about one cent.

    That is the whole mechanism. It sounds technical and it is arithmetically simple. But it matters enormously for a railway, because of when the money and the benefits arrive.

    13¢
    what a dollar of benefit in year 60 is worth today at ALTO’s 3.5 per cent
    23¢
    the same dollar at 2.5 per cent, the rate ALTO’s own cited manual requires be tested
    the same dollar at 8 per cent, the rate identified in 2007 Treasury Board guidance

    The timing is what makes this decisive. Construction money is spent early — from 2029 through the early 2040s — so it is barely shrunk at all. The benefits arrive later and keep arriving for sixty years, so they are shrunk heavily. Anything that changes the rate therefore hits the benefit side hard and the cost side hardly at all. A project’s whole case can move from comfortable to marginal without anything physical changing.

    The Arithmetic, Shown Openly

    How much the answer moves

    The table below is the Initiative’s own arithmetic, not a re-run of ALTO’s model. It takes a steady stream of benefits running for sixty years, beginning fifteen years from now, and asks what that stream is worth in today’s dollars at different rates. The last column simply scales ALTO’s published $49.5 billion by the same proportion, to show the size of the swing.

    Discount rate usedValue of the streamRelative to 3.5%$49.5B scaled
    2.5 per cent21.341.43×$71.0B
    3.0 per cent17.761.19×$59.1B
    3.5 per cent — ALTO’s rate14.891.00×$49.5B
    UK declining schedule15.611.05×$51.9B
    5 per cent9.110.61×$30.3B
    7 per cent5.090.34×$16.9B
    8 per cent3.900.26×$13.0B

    Assumptions, stated so the arithmetic can be checked: a level benefit stream of one dollar per year, sixty years of operation beginning in year 16, discounted back to a year-zero base. ALTO’s real benefit stream ramps up rather than running level, so the exact figures would differ; the proportions are what matter here. The scaled column is illustrative and is not ALTO’s number at those rates.

    Read the middle rows first. At 8 per cent, the same railway carrying the same passengers saving the same hours produces a benefit figure roughly a quarter the size. At 2.5 per cent it produces one roughly forty per cent larger. Nothing about the trains changed. Only the parameter changed.

    This is why appraisal manuals require the calculation to be repeated at more than one rate and the results published as a range. It is not a bureaucratic formality. It is the only way a reader can tell whether a case is robust or whether it depends on a parameter choice.

    Where 3.5 Per Cent Comes From

    A number with a family tree

    ALTO’s report attributes its rate to one source: the Business Case Manual Volume 2: Guidance, published by Metrolinx, the Government of Ontario’s transit agency for the Toronto and Hamilton region.2 That manual sets a social discount rate of 3.5 per cent, alongside an evaluation period of five to sixty years.

    The 3.5 per cent figure is not original to Metrolinx. It is the rate used by HM Treasury in the United Kingdom, and the Treasury publishes exactly how it was assembled. Three judgements are added together:

    0.5 per cent for simple impatience. People prefer good things sooner. Half a percentage point is the allowance for that.

    1.0 per cent for the risk that the future does not arrive as expected. Wars, pandemics, collapses. A benefit promised in 2080 might never materialise, so it is discounted a little further.

    2.0 per cent because people in the future will be richer. If incomes rise about 2 per cent a year, our grandchildren will be considerably better off than we are, and an extra dollar will matter less to them than it does to us. This is the largest of the three, and the most contestable.

    Those three add to 3.5.3

    Notice what the rate is not. It is not a market price, an interest rate, or anything anyone can look up. It is a set of judgements about how much weight to give people who are not yet born — and every one of the three is disputed by serious people. That is not a criticism of the figure. It is the reason a serious appraisal shows what happens when the figure moves.

    The detail that cuts in ALTO’s favour

    HM Treasury does not apply 3.5 per cent forever. The rate steps down to 3.0 per cent for years 31 to 75, and 2.5 per cent thereafter,3 and the Treasury’s supplementary guidance instructs practitioners in the same terms: the standard 3.5 per cent for years 1 to 30, and 3.0 per cent for years 31 to 75.4 The reason is uncertainty: the further out you look, the less confident anyone can be in the parameters, and the lower the rate should be.

    ALTO discounts a sixty-year stream at a flat 3.5 per cent throughout. Applying the stepped-down schedule instead would have made ALTO’s benefit total about five per cent larger, as the fourth row of the table above shows. This is a conservatism in ALTO’s favour, and it should be credited as one. It is recorded here because a reader assessing where a federal appraisal input came from deserves the whole picture, including the parts that do not fit a critical narrative.

    The Canadian Comparison

    What the federal government uses, and the gap where a manual should be

    Canada has approached the same question from the opposite end, and it is worth understanding the difference, because it produces a far higher number.

    The British method asks a question about values: how much should we care about the future? The Canadian method asks a question about alternatives: what else could this money have done? If public money invested elsewhere in the economy would have earned, say, 8 per cent, then a project has to clear that bar to be worth funding — otherwise the country was better off doing the other thing. That is what economists mean by the opportunity cost of capital.

    Neither question is wrong. They are simply different questions, and the second one produces a much tougher test than the first.

    The Treasury Board’s 2007 guidance identified 8 per cent as the appropriate rate, with sensitivity tests at 3 and 10 per cent, on that opportunity-cost basis.5 The current federal Policy on Cost-Benefit Analysis still directs departments to use the opportunity cost of capital as the discount rate, permitting a social rate only in defined cases — including where impacts run fifty years or more — and requiring that even when a social rate is used, results using the opportunity cost of capital must also be reported.6

    Two honest qualifications belong here, and neither is small. First, that federal policy governs regulations, not capital projects, so it does not bind ALTO. Second, the current edition of the Treasury Board guide is no longer published on canada.ca and is available only through an internal government wiki page,7 so the Initiative has not been able to verify the figure it now specifies.

    And the federal manual for transport projects specifically? Transport Canada’s guide to benefit-cost analysis dates from 1994.8 Thirty-two years later, there is no current, public federal appraisal manual for a project of this kind. That absence is very likely why a national railway is being appraised using a provincial transit agency’s parameters — and it is a finding about the machinery of government rather than about ALTO.

    Even the academic case for 3.5 per cent has conditions

    The most cited Canadian argument for a 3.5 per cent rate comes from the economists Boardman, Moore and Vining, who reject the 8 per cent approach. So there is a respectable Canadian case for ALTO’s rate. But it is a conditional case, and the conditions are specific.

    Condition one: the project runs under fifty years. Beyond that, they recommend a rate that steps down over time, for the same reason the UK Treasury does — nobody can see that far ahead with confidence.

    Condition two: the project must not pull money away from private investment. The money for a public project comes from taxes or borrowing, and it would otherwise have been used by someone else. Some of it would have been spent, and some would have been invested — a business expansion, new equipment, a factory. Those two are not equivalent. A dollar diverted from someone’s spending costs the economy that one dollar. A dollar diverted from investment costs more, because that investment would have gone on producing returns for years afterwards.

    And if the project does pull money from investment, there is a fix. Rather than argue about the rate all over again, you take the portion of the cost that displaced private investment and mark it up by 26 per cent before putting it in the calculation — because that is roughly what the lost investment was worth to the economy over time. Economists call the 1.26 multiplier a shadow price of capital. It is simply a way of using a generous discount rate honestly, instead of using it to pretend the money was free.5

    ALTO’s appraisal period is sixty years, which fails the first condition outright. Whether a $60 to $90 billion draw on Canadian capital displaces private investment is a real question, not a technicality — and the mark-up would apply only to the share that does, not to the whole sum. Neither condition is mentioned in the report.

    The pattern is the one the companion audit It Left the Rules Behind describes: a number travels, and the conditions attached to it stay behind.

    The Precedent

    The last time anyone published these numbers for this corridor

    ALTO’s stated reason for publishing no benefit-cost ratio is that the cost estimate is not yet mature enough to support one. It is worth knowing that a predecessor project on the same corridor did publish one, at a comparable stage, and published the funding ledger alongside it.

    In December 2021 the Joint Project Office — a body formed by VIA Rail and the Canada Infrastructure Bank — completed a Business Case Update for High Frequency Rail, the slower, cheaper predecessor to ALTO between Toronto and Québec City. It was released through access to information by the Canada Infrastructure Bank in November 2025.16

    What the 2021 business case publishedFigure
    Capital cost, with electrification (2020 prices)$27.71B
    Projected revenue over 30 years (2019 prices)$33.7B
    Operations, maintenance and rehabilitation, 30 years$32.5B
    Net present value over 30 years−$21.1B
    Benefit-cost ratio~0.13
    Expanded benefit-cost ratio~0.4
    Public subsidy over 30 years, by delivery model$37.1B to $42.2B

    Source: Joint Project Office, High Frequency Rail Business Case Update V.002, 10 December 2021. Ratios at Table 14, page 43; capital, revenue, lifecycle and net present value figures in the executive summary, pages 7 and 8; subsidy comparison at Table 4, page 8.

    A benefit-cost ratio of 0.13 means about thirteen cents of measured benefit for every dollar of cost. The wider figure of 0.4 is what the same table calls an expanded ratio, and the difference between the two is worth understanding, because it is the larger of the two numbers.

    The expansion adds two items. One is agglomeration — the economic gain from businesses being better connected — worth $0.3 to $0.9 billion. The other, worth $5.6 to $7.6 billion, is a resource correction: the fares new passengers would pay, counted as a benefit because they arrive as revenue for the operator. That single item is larger than the journey time savings and all the external benefits put together. The business case itself notes that both are relatively new to Canadian economic appraisal, which is why it reports the ratio with and without them.

    The same two sources, five years apart

    The 2021 economic case states where its parameters came from: the social discount rate, the value of time and the value of external impacts were taken from a combination of Metrolinx and Ministère des Transports du Québec guidance. Those are the same two sources ALTO cites in 2026.

    So the identical parameter lineage, applied to a $27.71 billion version of this corridor, produced a published ratio of 0.13. Five years later, on a project costing two to three times as much, the same two sources are cited and no ratio is published at all.

    And it kept the two ledgers apart

    The 2021 document also shows how the distinction this page has been drawing is meant to work in practice. Its net present value calculation used a discount rate of 2.5 per cent, sourced explicitly to the ten-year average of the 30-year Government of Canada benchmark bond — a financing rate, taken from what the government actually pays to borrow. Its economic case used the social parameters from Metrolinx and MTQ. Two questions, two rates, both disclosed, in a single document.

    Three cautions, stated plainly. High Frequency Rail is not ALTO: different technology, different speed, a $27.71 billion cost rather than $60 to $90 billion, and a thirty-year evaluation rather than sixty. The JPO described its own results as preliminary. And none of these figures transfer to ALTO by arithmetic. What the document establishes is narrower and harder to set aside: a benefit-cost ratio can be produced for a project on this corridor at this stage of development, because one was.

    One further point belongs on the record. The identical document was also released under a separate access request, and in that version the whole net present value section, the capital cost figure, the revenue figure and both ratios were blacked out — along with the subsection titles of the Economic Case within the table of contents, and the construction employment figure in the executive summary. No exemption provision is marked against any of it.17 Same document, same date, two releases, opposite outcomes.

    Following the Money

    Three different rates, and only one of them is in the report

    Here is the heart of it. People use the phrase “the discount rate” for three quite different things, and conflating them is how an appraisal result gets mistaken for a financing plan.

    1. The appraisal rate — 3.5 per cent

    Used to decide whether a project is worth doing. No money moves because of it. It turns hours saved and collisions avoided into a single present-day figure so they can be compared with the cost. Nobody charges it, nobody pays it, and no bank uses it.

    2. What it costs the government to borrow

    Real money, actually paid. When the federal government borrows for thirty years it has been paying in the region of 3.7 to 3.9 per cent during 2026. Take off inflation, which the Bank of Canada aims to hold at 2 per cent, and the true cost of the money is roughly two per cent a year.9 If the state simply builds the railway and holds it, this is what the borrowing actually costs, and it is lower than the appraisal rate.

    3. What a private partner needs to earn

    Considerably more. If a pension fund or infrastructure investor builds the railway, it is putting its own money at risk — the risk that construction costs more than planned, or that too few people ride. It requires a return for carrying that risk, and that return is paid out every year for decades. This is the rate that decides what the public actually hands over, and it appears nowhere in ALTO’s economic report.

    The gap between the second and the third is the entire public-private question. If the government borrows at 2 per cent and builds the railway itself, that is what the money costs. If a private partner builds it instead and needs 8 per cent, someone has to make up the difference — every year, for as long as the arrangement lasts. That someone is the public.

    So a project can pass the 3.5 per cent test comfortably and still require very large annual public payments to get built. The appraisal will go on saying “worth doing.” It will never say who writes the cheque, for how long, or at what return.

    Why the $49.5 billion cannot pay for anything

    This is the point most easily missed, and it is not a technicality. Nearly all of ALTO’s benefit figure is not cash. It is hours of travel time, collisions that did not happen, tonnes of emissions avoided. These are real and they matter. But a saved hour cannot service a loan, meet a payroll, or renew a worn rail.

    The money that actually funds a railway comes from two places only: fares, and government payments. ALTO’s report handles that second ledger in a few pages, supported chiefly by the operating margins of three foreign railways, and it publishes no fare, no revenue figure and no farebox recovery ratio. So the document is expansive about whether the project is worth doing and close to silent about how it would be paid for.

    A Canadian Example, Fully Documented

    How the Montréal REM is actually funded

    The Réseau express métropolitain is a 67-kilometre automated light metro in Greater Montréal, built, owned and operated by CDPQ Infra, a subsidiary of the Québec pension fund manager. It is the clearest Canadian illustration of what the third rate looks like once it becomes money, and its terms are public.10

    Who put up the capital
    CDPQ Infra $2.95B; the Government of Québec $1.283B; the Government of Canada $1.283B; Hydro-Québec $295M; the regional transit authority $512M. The construction estimate rose from $6.3 billion in 2018 to $7.95 billion by 2023, an increase CDPQ Infra absorbed under its agreement.11
    How the money returns
    Not through fares. The regional transit authority pays CDPQ Infra 72 cents for every kilometre every passenger travels, indexed annually to the Consumer Price Index. That single rate covers construction, operation and long-term maintenance.12
    If ridership beats forecast
    The rate steps down. CDPQ Infra has described trips beyond 15 per cent above forecast being paid at roughly 57 cents, and trips beyond 40 per cent above forecast at the user fare itself.13
    The two return targets
    8 to 9 per cent for CDPQ Infra. 3.7 per cent for the governments. Both were set at the outset and publicly reaffirmed during construction.14

    That pair of numbers is the whole point of this section, made concrete. The same railway, the same track, the same passengers — and two participants requiring returns that differ by more than double. The difference is not a rounding error in an appraisal. It is paid out, in cash, on every passenger-kilometre, for as long as the agreement runs.

    Why this case and not another. The REM is not an analogy picked at random. CDPQ Infra leads Cadence, the consortium selected in February 2025 as ALTO’s private development partner. AtkinsRéalis — formerly SNC-Lavalin, a member of the group that built the REM and, with Alstom, of the group that supplies and operates its trains — is also a Cadence member. The other Cadence members are SYSTRA Canada, Keolis Canada, SNCF Voyageurs and Air Canada.18 The REM is the lead sponsor’s own model, which CDPQ Infra presents publicly as an innovative approach to delivering public infrastructure. That is what makes it the most informative available guide to how a private partner’s return might be priced here.

    An important caution. ALTO is nonetheless not the REM, and this is not a prediction. Canada is to retain permanent ownership of the ALTO network, which was never the REM arrangement; the project is in a co-development phase running to 2029; and no payment mechanism has been disclosed. Cadence is a different group with different members and a different contract. The REM is offered as the one Canadian case where the arithmetic of a private partner’s return has been made public — which is exactly what has not yet happened for a project several times its size.

    Notice what a payment mechanism does with risk. Because CDPQ Infra is paid per passenger-kilometre, a shortfall in riders is a shortfall in its own revenue — the investor carries the demand risk. Under a different structure, where the public pays for the railway simply being available, a shortfall in riders changes nothing the partner receives and everything the public pays.

    Same railway, same disappointing ridership, opposite consequences. Which of those applies to ALTO has not been published.

    Limits of This Explainer

    What this does not claim

    On the rate

    3.5 per cent is not wrongIt is a mainstream, well-supported choice for long-lived public investment. This explainer does not argue that ALTO’s rate is too low.
    Two omissions favour ALTOBoth the stepped-down schedule and the sensitivity test its cited manual requires would have produced a larger benefit figure. The omissions do not all run one way.
    The arithmetic is illustrativeThe table uses a level benefit stream and a stated start year. It shows the shape of the sensitivity, not a recalculation of ALTO’s result.
    The 2021 ratios are not ALTO’sHigh Frequency Rail was a different and cheaper project assessed over thirty years, and its authors called the results preliminary. Those figures are cited as evidence that a ratio can be produced at this stage, not as an estimate of ALTO’s.

    On the comparisons

    Nothing here binds ALTOMetrolinx guidance, UK Treasury practice and federal regulatory policy carry no legal force over this project. They are offered as points of comparison, one of which ALTO chose to cite itself.
    The federal figure is unverifiedThe 8 per cent rate is documented from 2007 guidance through peer-reviewed sources. The current edition of that guide is not publicly posted, and the Initiative does not assert what it now specifies.
    We do not say whyWhere the report does not state something — a fare, a payment mechanism, a sensitivity test, a range — this page says so rather than inferring it, and makes no claim about why any figure was or was not published, or about the intentions of anyone who prepared it.
    This is a public report, not a business caseA submission to Cabinet in 2029 may contain material this document does not. What is examined here is what has been placed in public.
    What Would Settle It

    Two questions, answerable without releasing a model

    1. Who absorbs it if the passengers do not come?

    Not a forecasting question but a contract question. If a partner is paid per passenger, a shortfall reduces its return. If it is paid for availability, a shortfall costs the partner nothing and the public a great deal. Identical ridership, opposite outcomes — and ALTO has published neither the mechanism nor the cost of capital behind it.

    2. What fare, and what revenue?

    No fare level, average yield or farebox recovery ratio appears in eighty-three pages. Without one, the funding question cannot be examined by anyone outside the project.

    Neither requires access to ALTO’s models, cooperation from its staff, or agreement about what the correct discount rate for a national railway ought to be. Both are answerable from work already done.

    A third question — whether the calculation was ever run at any rate other than 3.5 per cent — belongs to the companion audit It Left the Rules Behind, which sets out the full list of tests the cited manual requires at this project’s scale and which of them appear in the report.

    Sources

    Primary documents

    1.
    ALTO, Canada’s Moment: The Economic Opportunity of High-Speed Rail, August 2026, 83 pp. Discount rate, sixty-year appraisal period and price base in the Appendix A methodology box, sourced at footnote 65 to the Metrolinx manual; capital cost and AACE Class 5 estimate at pp. 5 and 65; direct-benefit tables headed “upper estimate”. Analysed in full in the Initiative’s companion brief Two Parameters, None of the Conditions, summarised at It Left the Rules Behind.
    2.
    Metrolinx, Business Case Manual Volume 2: Guidance, August 2021, 222 pp. Economic parameters at Table 5.8: social discount rate 3.5 per cent, evaluation period five to sixty years, single blended value of time. Verified as the current edition, 21 August 2026. metrolinx.com
    3.
    HM Treasury, Review of discounting in the Green Book: Terms of Reference, 16 December 2025. Sets out the derivation of the 3.5 per cent Social Time Preference Rate. The Treasury specifies four parameters — pure time preference, catastrophe risk, the elasticity of marginal utility and the growth rate — the last two of which multiply to the 2.0 per cent component described above as a single judgement. and the declining schedule of 3.0 per cent for years 31 to 75 and 2.5 per cent thereafter. gov.uk
    4.
    HM Treasury, Green Book supplementary guidance: discounting, updated 5 February 2026. Instructs practitioners to use 3.5 per cent for years 1 to 30 and 3.0 per cent for years 31 to 75. gov.uk (PDF)
    5.
    A. E. Boardman and M. A. Moore, “The Social Discount Rate for Canada Based on Future Growth in Consumption,” Canadian Public Policy, vol. 36 no. 3 (2010), pp. 325 onward. Records the Treasury Board Secretariat’s 2007 interim recommendation of an 8 per cent social discount rate with sensitivity rates of 3 and 10 per cent on a weighted social opportunity cost of capital basis; argues instead for 3.5 per cent, conditional on a horizon under fifty years and no crowding out of private investment, with a shadow price of capital of 1.26 applied to investment flows, and a declining schedule beyond fifty years. Canadian Public Policy
    6.
    Treasury Board of Canada Secretariat, Policy on Cost-Benefit Analysis, in force since 1 September 2018. Requires departments to use the opportunity cost of capital specified in the TBS guide, with a social discount rate permitted in defined cases including impacts of fifty years or more, and requires opportunity-cost results to be reported in any event. canada.ca
    7.
    Treasury Board of Canada Secretariat, “Requirements for developing, managing and reviewing regulations,” canada.ca, page updated 26 November 2025, accessed 21 August 2026. States that the most current version of Canada’s Cost-Benefit Analysis Guide for Regulatory Proposals is available exclusively on the Cabinet Directive on Regulation GCwiki page. The 2022 edition remains catalogued in Government of Canada Publications as an archived document. canada.ca
    8.
    Transport Canada, Economic Evaluation Branch, Guide to Benefit-Cost Analysis in Transport Canada, Ottawa, 1994. Catalogued in the Transport Research International Documentation database. TRID
    9.
    Bank of Canada, selected benchmark bond yields, accessed August 2026; Bank of Canada policy interest rate held at 2.25 per cent through mid-2026 against a 2 per cent inflation target. Long-bond yields move daily and should be checked against the source rather than quoted from this page. bankofcanada.ca
    10.
    Réseau express métropolitain, “Information about the agreement with the ARTM and its rate mechanisms.” Sets out the 72-cent per passenger-kilometre invoice to the regional transit authority, the reduction once ridership projections are exceeded, and the turnkey scope covering construction, operation and long-term maintenance. rem.info
    11.
    Capital structure as reported on award of the construction contracts: CDPQ Infra $2.95B, Government of Québec $1.283B, Government of Canada $1.283B, Hydro-Québec $295M, ARTM $512M, against a construction cost of $6.3B. The estimate was revised to $7.95B in September 2023, with CDPQ Infra absorbing the increase under its agreement with the Québec government. International Railway Journal
    12.
    Gouvernement du Québec, ARTM and CDPQ Infra, “Release of the management and implementation agreement and of the integration agreement for the Réseau express métropolitain,” 23 April 2018. Confirms the $0.72 per passenger-km base cost and annual indexation to Canada’s Consumer Price Index, and the cap limiting additional municipal costs to roughly $45 to $60 million a year in then-current dollars. quebec.ca
    13.
    CDPQ Infra, “7 myths about the REM de l’Est,” February 2022. Describes the ridership relief mechanism: the rate falls by about 20 per cent, to roughly $0.57, for trips above 15 per cent over forecast, and equals the user fare for trips above 40 per cent over forecast. Published in the context of a later project; the mechanism described is the REM’s. cdpqinfra.com
    14.
    Réseau express métropolitain, semi-annual project update, 3 June 2021. Reaffirms the 72-cent rate set in the 2018 agreement and states the performance targets: 8 to 9 per cent for CDPQ Infra and 3.7 per cent for the government partners. rem.info
    15.
    Discounting arithmetic in this explainer computed by the Initiative on the stated assumptions: a level annual benefit stream, sixty years of operation beginning in year 16, discounted to a year-zero base; the declining-schedule row applies 3.5 per cent to years 1 to 30, 3.0 per cent to years 31 to 75, per source 3.
    16.
    Joint Project Office (VIA Rail Canada and the Canada Infrastructure Bank), High Frequency Rail Project: Business Case Update, V.002, 10 December 2021, 150 pp., released by the Canada Infrastructure Bank under the Access to Information Act, November 2025. Capital cost breakdown and 30-year revenue at p. 7; benefit-cost ratio, net present value and the Table 4 subsidy comparison at p. 8; economic appraisal parameters sourced to Metrolinx and MTQ guidance at p. 40; incremental capex and opex at Table 9; other impacts at Table 12; impact results and both ratios at Table 14, p. 43; net present value assumptions, including the 2.5 per cent discount rate sourced to the ten-year average 30-year Government of Canada benchmark bond, at Figure 38, p. 85.
    17.
    The same document released as Annexe A to access request 22-2207 (148 pp., stamped Demande d’accès à l’information #22-2207 AI(D)). In that version, section 9.7 Net Present Value Analysis survives as a heading at p. 84 with pp. 84–86 otherwise blank; section 9.8 Financial Structuring at p. 87 is withheld in full; the capital cost and 30-year revenue sentences are truncated mid-clause at p. 21, leaving the grammar intact around the removed figures; and the subsection headings of section 7 Economic Case are withheld within the table of contents, together with the title of section 8 and all of its subsections, which appear as bare dot leaders against pp. 40–43 and 44–63. The construction employment sentence at p. 21 is severed in the same way: “an estimated ___ annual equivalent jobs could be created.” That figure — 71,000 to 96,000 annual equivalent — is disclosed in full in the Canada Infrastructure Bank release at note 16. No exemption provisions are marked against any of the severed passages. Both versions held by the Initiative.
    18.
    Cadence consortium membership and CDPQ Infra’s leadership role: Cadence, “About us,” and CDPQ Infra, “Alto high-speed rail,” both accessed August 2026; consortium announced as preferred private development partner 19 February 2025, co-development agreement signed March 2025. AtkinsRéalis (formerly SNC-Lavalin) was a member of NouvLR, which held the REM engineering, procurement and construction contract, and of the group now operating as Pulsar with Alstom under the rolling stock, systems, operations and maintenance contract. cadence.info
  • It left the rules behind

    ALTO Used the Rulebook’s Numbers. It Left the Rules Behind.

    ALTO’s new economic report takes two key figures from an Ontario appraisal manual and names that manual as its source. The manual attaches conditions to those figures. The report uses the figures and leaves the conditions out.

    ⚠ The Document Under Examination

    In August 2026 ALTO published Canada’s Moment: The Economic Opportunity of High-Speed Rail, an 83-page report setting out the economic case for the Toronto–Québec City high-speed rail corridor. Its central figure is $49.5 billion in benefits to travellers and society, set against a construction cost of $60 to $90 billion.

    To turn sixty years of future benefits into one number in today’s dollars, the report needs two things: a rate at which to shrink future benefits back to present value, and a price for an hour of a traveller’s time. For both, it names one source — a public appraisal manual published by Metrolinx, the Government of Ontario’s transit agency for the Toronto and Hamilton region.

    Critical Finding

    The Metrolinx manual does not simply publish those two numbers. It publishes them as part of a package. For any project over $500 million, the same manual requires that the numbers be re-tested at different values, that results be reported as a range rather than a single figure, that early-stage construction costs be topped up to correct for known optimism, and that the project’s benefit-to-cost ratio be published. ALTO’s project is roughly a hundred times larger than that threshold.

    None of those requirements appears in ALTO’s report. There is no test of the discount rate, no range around the $49.5 billion, no optimism adjustment to the cost, and no benefit-cost ratio. The two numbers were carried across. The conditions attached to them were not.

    This brief does not argue that ALTO used the wrong discount rate. The rate it used is a mainstream, defensible choice. The finding is narrower and, we think, harder to answer: the report presents a set of choices as though they were simply facts, and a reader has no way of knowing that anything was chosen at all.

    Download
    Two Parameters, None of the Conditions — Full Brief (PDF)
    Full research brief with page references, parameter tables, and sources
    Download PDF
    Start Here

    Why this matters

    Imagine a builder quotes you a price for an extension. Asked where the figures come from, they name the standard industry pricing guide. That guide does set those rates. It also says that on a job this size the quote must show a high and a low figure rather than a single number, must add a fixed percentage on top because early quotes are almost always too low, and must set the total against the value of what you are getting.

    The builder uses the guide’s rates and does none of the rest. The quote may well be sound. You have no way of telling — and nothing on the page tells you that anything was left out.

    That is the situation this brief describes. ALTO’s economic report takes two figures from a public appraisal manual and names that manual as its source. The same manual attaches a set of mandatory checks to those figures for projects of this size. The figures were used. The checks are absent, and their absence is not disclosed.

    It matters because of what rests on the result. The $49.5 billion benefit figure is the number now appearing in news coverage and public statements as the reason to build a railway costing $60 to $90 billion of public money, ahead of a federal decision in 2029. Presented as a single figure with no range, it reads as something measured. The report’s own tables call it an upper estimate.

    What the report gives you

    One benefit figure, $49.5 billion, built on a rate and an hourly value of time presented without explanation of where they came from or what else was possible. No range. No benefit-to-cost ratio.

    What its own cited source requires

    The same figures re-tested at different values, results published as a range with a confidence level, a 64 per cent top-up on early-stage construction costs, and the benefit-to-cost ratio reported.

    What that leaves a reader with

    No way to judge how firm the headline number is — and no indication in the document that this is a question worth asking.

    One thing this brief does not do: argue that the numbers ALTO chose are wrong, or that high-speed rail is a bad idea. The rate it used is a mainstream choice, and the one test the manual requires would, if anything, make the benefits look larger. The ask is simply that the tests be run and published, as the cited manual says they must be.

    The Two Numbers

    What the report borrowed, and from where

    3.5%
    the discount rate ALTO uses, taken from the Metrolinx manual
    Appendix A, footnote 65
    $22.32
    the value of one hour of a traveller’s time, the same figure for every trip
    justified as following Metrolinx method
    64%
    the top-up the same manual requires on construction costs at this stage of design
    not applied in the report

    The discount rate. A benefit that arrives in 2085 is not worth as much to us today as the same benefit next year. Economists handle this by shrinking future amounts back to a present-day value at a fixed annual percentage — the discount rate. ALTO uses 3.5 per cent a year, applied over a sixty-year period. The rate matters enormously: over sixty years, small changes to it move the headline benefit figure by billions.

    The value of time. Most of the $49.5 billion is not cash. It is hours — time that travellers would otherwise have spent on the road or waiting at an airport. To put a dollar figure on those hours, you have to decide what an hour is worth. ALTO uses $22.32, and applies the same figure to every trip: business or holiday, commuter or tourist. The report tells us its own ridership model did separate business from non-business travel, and that this distinction was set aside in favour of one blended figure.

    Where both come from. The footnote attached to the discount rate cites one document and one only: the Business Case Manual Volume 2: Guidance, published by Metrolinx in August 2021. The single blended value of time is defended on the grounds that it follows Metrolinx method. So a manual written for regional transit projects in the Toronto and Hamilton area is the published authority for how a national intercity railway has been appraised.

    Metrolinx guidance is not binding on a federal Crown corporation, and nothing here suggests otherwise. But a citation carries the terms of the thing cited. If you name a manual as your authority, it is fair to look at what else that manual says on the same page.

    The Manual’s Own Terms

    The numbers come as a set, not a menu

    The 3.5 per cent rate appears in a table of standard parameters. The text introducing that table is direct about their status: any departure from them has to be explicitly agreed during the work, with a clear justification recorded. It is a list of defaults you may leave, provided you say so. Below is how each of those defaults is treated in ALTO’s report.

    What the Metrolinx manual specifiesWhat ALTO’s report does
    Discount rate: 3.5 per cent. The rate at which future benefits are shrunk to present value.3.5 per cent. Adopted exactly as specified, and correctly footnoted to the manual.
    Status:Carried across
    Value of time: one blended figure. A single hourly value across all modes and all trip purposes, rather than separate values for business and leisure travel.One blended figure, $22.32. Adopted, and expressly justified by reference to the manual — in preference to the business and non-business split that ALTO’s own ridership model had already produced.
    Status:Carried across
    Growth cap: stop escalating benefits 30 years out. The manual caps growth in the inputs thirty years after the base year, expressly to reflect the fact that nobody can see that far ahead. User benefits are named as covered by the cap.Applied to two small lines, not the big one. Accident rates are capped after twenty years, and vehicle emission factors run to 2050. No cap is stated on travel-time benefits — which are 78 per cent of the total.
    Status:Applied selectively
    One price year throughout. All values discounted and escalated to a single common year, fixed at the start of the study, so that every figure in the document is in the same money.Two price years in one report. The appraisal and the capital cost are in 2024 dollars; the economy-wide GDP result is in 2019 dollars.
    Status:Not consistent
    Test the value of time at 0.75 per cent real growth. The manual’s base case assumes the value of an hour does not rise in real terms — but pairs that assumption with a required test of what happens if it does.Zero growth assumed; no test run. The assumption was carried across. The test that the manual attaches to the assumption was not.
    Status:Left behind

    One footnote on the money. Adjusting the manual’s 2021 value of time for inflation to 2024 gives roughly $21.40 — within a few per cent of ALTO’s $22.32. We are not claiming ALTO derived its figure that way, and ALTO does not say how it did. The point is simply that the figure sits where you would expect a Metrolinx-derived figure to sit, which makes the omission of the accompanying test harder to explain as an oversight.

    The Missing Tests

    What a project this size is supposed to publish

    The Metrolinx manual scales its requirements to the size of the project. Anything above $500 million is treated as large scale, and a specific list of tests and disclosures becomes mandatory. ALTO’s cost estimate is $60 to $90 billion — roughly a hundred times that threshold. Here is that list, and where each item stands in ALTO’s report.

    Re-run the numbers at a different discount rate

    The manual requires the calculation be repeated at 2.5 per cent so the reader can see how sensitive the answer is to the rate. Not done, and not mentioned. Note the direction here: the required test is at a lower rate, which would make the benefits look larger. Nothing in the manual supports an argument that ALTO’s rate is too generous. What it supports is the narrower point that the manual’s author expects the rate to be tested and the test to be shown.

    Re-run the numbers with a rising value of time

    Required at 0.75 per cent real growth per year. Not done.

    Run the costs and assumptions through a range analysis

    The manual requires costs and modelling assumptions be run thousands of times with the inputs varied, and the result reported as a range with a stated confidence level. Not done.

    Report the odds that the project is worth doing

    The manual asks specifically for the probability that benefits exceed costs. Not reported — the report publishes no benefit-cost ratio at all.

    Publish the standard indicators

    Net present value, benefit-cost ratio, capital utilisation, return on investment, internal rate of return. None published.

    Model low, medium and high growth scenarios

    Required, with the ridership growth rate stated for each. A ridership range is shown; the underlying growth scenarios are not stated.

    This is not a theoretical requirement

    The manual works the method through on a real example: an extension of the Yonge subway line in Toronto, at an early stage of design. A single cost estimate of $5.65 billion becomes a range of $6.16 to $6.84 billion, with the confidence level attached. The reader is shown a central figure, a spread, and how sure anyone is about it.

    That project is roughly one per cent the size of ALTO. On uncertainty, the manual ALTO cites tells its reader more about a subway extension than ALTO’s report tells its reader about a national railway.

    The Missing Lower Number

    The report concedes a range it never publishes

    The two tables carrying the entire $49.5 billion case are both headed with the words upper estimate. Every figure in the narrative is prefixed the same way: up to 24 million riders, up to 9.3 billion hours saved, up to 400 fatalities avoided, up to 39.1 million tonnes of emissions.

    An upper estimate is one end of a range. The other end does not appear anywhere in the document.

    The claim built on top of those figures goes further still. The report states that the benefits hold across a wide range of scenarios, and repeats the point in its conclusion. But demonstrating that a result holds across a range of scenarios is exactly what the missing sensitivity analysis does, and exactly what the cited manual requires be reported at this scale. The scenarios may well have been run. Their results are not shown.

    And the report clearly knows how to show them. Elsewhere in the same document, the ridership forecast comes with multiple scenarios and a published band around it. The economy-wide GDP figure rests on nearly a hundred separate model runs with the assumptions varied. Between a tested input and a tested output sits the largest single number in the report, presented as a single column of point estimates.

    The Optimism Adjustment

    A top-up the manual requires, and the report does not mention

    Early cost estimates for big infrastructure projects are, as a matter of record, too low. Not occasionally — routinely. The Metrolinx manual is explicit about the evidence behind this: in an international sample of 258 rail projects, ninety per cent were undercosted, by an average of forty-five per cent.

    The manual’s response is a mandatory top-up applied to the construction cost when it is compared with benefits, over and above whatever contingency is already in the estimate. The size of the top-up depends on how far the design has progressed. At the earliest stage — nought to ten per cent designed — it is 64 per cent.

    ALTO’s cost estimate is described in its own report as an AACE Class 5 estimate, which is the earliest and least developed class there is. Applied as the manual directs, a cost of $60 to $90 billion would enter the comparison at roughly $98 to $148 billion, before any comparison with benefits is attempted. That range is our own arithmetic on ALTO’s published estimate at the manual’s stated uplift; ALTO publishes no uplifted figure.

    The report applies no such adjustment and does not mention the concept. It is worth noting where this reasoning comes from: the manual grounds the adjustment in the research on transport megaproject cost overruns that this Initiative has drawn on since its first publication. That reasoning is already embedded in the appraisal manual ALTO chose to cite.

    The Central Inversion

    Too early to divide, but not too early to multiply

    The report declines to publish a benefit-cost ratio — benefits divided by costs, the single number a reader would most want. Its stated reason is that the cost estimate is too immature to support one.

    Under the framework ALTO cites, that reasoning runs backwards. The manual sets out what is required at each stage of a project’s life. At the earliest stage, the very stage ALTO is at, the requirement is a single line: conduct sensitivity testing to understand the key drivers and the level of uncertainty in each option.

    Early-stage uncertainty is not an exemption from testing. It is the reason testing is required. The report treats it the other way round: immaturity on the cost side is given as grounds for publishing nothing, while single-point figures are published on the benefit side of the same ledger. The same uncertainty is treated as decisive for one number and immaterial for the other.

    And a business case for this corridor has already done it. In December 2021 the Joint Project Office — VIA Rail and the Canada Infrastructure Bank — published a benefit-cost ratio for High Frequency Rail, the cheaper predecessor to ALTO, at a comparable stage of development: about 0.13, or roughly 0.4 on an expanded basis counting fare revenue and agglomeration as benefits. It published a net present value of minus $21.1 billion and a thirty-year public subsidy of $37.1 to $42.2 billion alongside it. Its economic parameters were drawn from Metrolinx and Ministère des Transports du Québec guidance — the same two sources ALTO cites. Immaturity did not prevent a ratio then. The companion explainer Hours Are Not Dollars sets out those figures in full, including why 0.13 rather than 0.4 is the anchor.

    A related point arises elsewhere in the report. In explaining why one set of results is excluded from the welfare account, it refers to those results as therefore not being included in the benefit-cost ratio — speaking of it as a thing with a settled boundary about what enters it. One page says a meaningful ratio cannot yet be produced. Another treats the ratio as already drawn up. The two are difficult to read together, and the report does not reconcile them.

    Limits of This Analysis

    What this brief does not say

    Stated here rather than left for others to find.

    On the analysis

    The rate is not wrong3.5 per cent is a defensible choice, used by the United Kingdom Treasury and by Metrolinx, and well supported for long-horizon public investment. This brief does not argue that ALTO’s rate is too low or too high.
    Metrolinx does not bind ALTOA provincial agency’s manual has no legal force over a federal Crown corporation. The argument is about the coherence of a citation, not about jurisdiction.
    One choice runs in ALTO’s favourThe 3.5 per cent rate is applied flat across sixty years. The UK Treasury, whose Social Time Preference Rate this figure matches, steps its rate down to 3.0 per cent after year 30. Applying that schedule would have made ALTO’s benefit total larger, not smaller.
    One cited source was not reviewedGuidance from the Ministère des Transports du Québec is cited separately for the value of time. The Initiative has not reviewed it and takes no position on what it requires.

    On the report and its source

    The report does apply conservatism in placesAccident reductions are capped after twenty years, and car emission factors are assumed to improve to 2050, which the report notes limits the emissions benefit. These are the two smallest monetised lines. No equivalent constraint is disclosed for travel time, which is 78 per cent of the total.
    The manual itself is datedMetrolinx said in 2021 that a revised version with updated values would follow in 2022. Five years on, it has not. That is a limitation of the source document, not a fault of ALTO’s — but a reader assessing where a federal appraisal input came from is entitled to know it.
    Which figures are whoseEvery figure attributed to ALTO, Metrolinx, the Joint Project Office, HM Treasury or Statistics Canada is quoted from the sources listed below and can be checked there. Three figures are our own arithmetic and are marked as such where they appear: the $98 to $148 billion uplifted capital range, the $21.40 inflation-escalated value of time, and the five per cent effect of the declining Green Book schedule. Where the report does not state something, we say so rather than inferring it, and we make no claim about why any requirement was or was not carried across.
    This is a public report, not a formal submissionA business case submitted to Cabinet in 2029 may well contain material this document does not. The claims examined here are the claims ALTO has chosen to put in public.
    What Would Settle It

    Two questions ALTO can answer without releasing a model

    Both are answerable from work ALTO has already done. Neither requires disclosure of a model, cooperation from staff, or agreement about what the correct discount rate for a national railway ought to be.

    1. Was the calculation ever run at a rate other than 3.5 per cent?

    And if so, what were the results? A negative answer is itself informative — it would mean the required test was never performed. An affirmative answer is the sensitivity table the report does not contain.

    2. Which parts of the cited guidance were applied, and which were departed from?

    The Metrolinx document requires that any variation from its parameters be agreed and clearly justified. The report records no variations at all — while, on the evidence above, departing from several.

    Where Things Stand · August 2026

    Summary ledger

    Measured against the requirements of the manual ALTO names as its authority:

    Carried across
    The 3.5 per cent discount rate, correctly cited to the manual.
    Carried across
    The single blended value of time, expressly justified by reference to the manual.
    Partial
    The thirty-year cap on benefit growth: applied to accident and emissions lines, not stated for travel time, which is 78 per cent of the benefits.
    Partial
    A single price year throughout: the appraisal is in 2024 dollars, the GDP result in 2019 dollars.
    Left behind
    Discount rate sensitivity test at 2.5 per cent.
    Left behind
    Value of time sensitivity test at 0.75 per cent real growth.
    Left behind
    Range analysis of costs and assumptions, reported with a confidence level.
    Left behind
    The probability that benefits exceed costs, and the benefit-cost ratio itself.
    Left behind
    The standard set of performance indicators: net present value, benefit-cost ratio, capital utilisation, return on investment, internal rate of return.
    Left behind
    The optimism-bias top-up on construction costs, 64 per cent at this level of design — not applied and not mentioned.
    Left behind
    The lower end of the range, on figures the report itself labels an upper estimate.

    ALTO names an appraisal manual twice — once for its discount rate, once to justify a single blended value of time — and leaves behind the testing, the ranges, the optimism adjustment and the benefit-cost reporting that the same manual attaches to those figures at this project’s scale. What remains is a column of numbers labelled an upper estimate whose lower estimate is never shown, resting on parameters presented as facts rather than as selections, in a report that declines to divide that column by the cost while describing the benefits as holding across a wide range of scenarios.

    Every document relied on here is public. Nothing in this analysis requires access to ALTO’s models, cooperation from its staff, or a view on what the correct discount rate for a national railway ought to be.

    Download Full Brief
    Two Parameters, None of the Conditions (PDF)
    Full research brief with page references, parameter tables, worked figures and sources
    Download PDF

    If the terms in this brief are unfamiliar — what a discount rate actually does, why a benefit figure is not money, and who ends up paying — the companion explainer Hours Are Not Dollars covers the same ground in plain language, and sets out the 2021 business case figures in full.

    Sources

    Primary documents

    1.
    ALTO, Canada’s Moment: The Economic Opportunity of High-Speed Rail, August 2026, 83 pp. Discount rate, appraisal period and price base in the Appendix A methodology box, sourced at footnote 65 to the Metrolinx Business Case Manual Volume 2; value of time and the single-parameter justification in the same appendix, with Ministère des Transports du Québec guidance at footnote 66. Direct-effects tables headed “upper estimate, $2024 CAD”; benefit-cost ratio discussion at p. 62 and reference to the benefit-cost ratio at p. 80; capital cost and AACE Class 5 at pp. 5 and 65; scenario-robustness claims at pp. 3 and 69.
    2.
    Metrolinx, Business Case Manual Volume 2: Guidance, August 2021, 222 pp. Economic parameters at Table 5.8; sensitivity requirements at Tables 5.1 to 5.3; optimism bias at Tables 5.4 to 5.6; worked range example at Table 5.7; Economic Case lifecycle requirements and key performance indicators; business case principles at pp. 11 and 13; guidance revision cycle at p. 4. metrolinx.com
    3.
    Metrolinx, “Business Cases — Resources,” accessed 21 August 2026. The Business Case Guidance link resolves to the Volume 2 file under an asset version token corresponding to 15 September 2022; no Volume 2 revision has been issued.
    4.
    B. Flyvbjerg, Procedures for Dealing with Optimism Bias in Transport Planning (UK Department for Transport, 2004), cited in the Metrolinx Guidance as the basis for the optimism-bias uplift.
    5.
    Statistics Canada, Table 18-10-0004-01, consumer price index, used for the 2021 to 2024 escalation of the Metrolinx value of time. The comparison is arithmetic and is not an attribution of method.
  • Would an Alto stop help kingston

    Would an ALTO Stop Help Kingston?

    Kingston has one of the busiest stations on the network. The question that matters is not whether it gets a stop, but whether a stop would leave more people riding the train, or fewer.

    ⚠ What has been said, and what has not been published

    On 22 July 2026 ALTO’s chief executive, Martin Imbleau, told CBC Radio’s Ottawa Morning that Kingston will probably get a station, and that most ALTO trains would pass through without stopping.1 Neither the timetable nor the location of the station has been published.

    Those two missing facts are exactly the ones that decide the outcome. This brief therefore tests the range: today’s railway, a faster conventional railway using the existing station, and ALTO with a station either inside the city or a twenty‑seven‑minute drive north of it, at normal fares and at fares 25 per cent higher. Every number that goes into the model is listed, so any of them can be argued with.

    The short answer

    Of the options tested, only one leaves Kingston with more rail trips than it has today: a faster conventional railway serving the existing station, at about 12 per cent more. The best ALTO case — a station inside the city, at normal fares — roughly matches today. Every other ALTO case comes out below today’s service, by 8 to 17 per cent.

    The reason is simple. Speed is only one part of what makes a train trip worth taking. ALTO’s faster run to Toronto is worth about 10 per cent more trips on its own. But cutting the number of daily stops from eighteen to eight gives that back. Charging 25 per cent more gives it back again. Moving the station twenty‑seven minutes north of the city costs another 6 to 8 points on top.

    Running more trains cannot rescue it by itself. Even at eighteen stops a day, matching what Kingston has now, an out‑of‑town station at a premium fare still comes out around 9 per cent below today. And about 8 per cent of Kingston’s trips — Belleville, Brockville, Cobourg, Napanee, Oshawa — have no ALTO equivalent at any frequency, because high‑speed trains do not stop at those places.

    Download
    Kingston’s ALTO Ridership Analysis — Full Brief (PDF)
    Full method, all parameters, sensitivity ranges and break‑even tables
    Download PDF
    The Comparison

    Six versions of Kingston’s railway

    The table below is the whole brief in one place. The first row is what Kingston has today. The second is a faster conventional railway from the same station. The last four are ALTO, differing only in where the station sits and what the ticket costs.

    +12%
    faster conventional railway, existing station, same number of trains, normal fares
    the only option that grows ridership
    0%
    best ALTO case: station in town, normal fares, eight stops a day
    matches today, does not beat it
    −17%
    ALTO station 27 minutes north, eight stops a day, fares 25% higher
    central case for an out‑of‑town station

    Table 1 · Headline comparison

    OptionTo TorontoStops a dayFare premiumAnnual tripsChange
    Today’s service135 min18none450,000
    Faster conventional railway, existing station95 min18none502,000+12%
    ALTO, station in town80 min8none449,0000%
    ALTO, station in town80 min8+25%403,000−10%
    ALTO, 27 min north80 min8none416,000−8%
    ALTO, 27 min north80 min8+25%376,000−17%

    All four ALTO rows assume eight stops a day and that today’s conventional service is withdrawn. They differ only in where the station is and what the ticket costs. No fare structure for intermediate stations has been published, so both possibilities are shown rather than assumed. The faster conventional railway is the 240 km/h new‑build line proposed under the High Performance Rail framework, serving the existing station.

    Starting Point

    Why Kingston already rides the train

    Kingston’s place among the busiest stations on the network gets cited as the reason it should have a high‑speed stop. But what produces that ridership decides whether a different kind of station would reproduce it. Four things do most of the work, and a high‑speed alignment north of the city removes two of them.

    It gets two sets of trains, not one

    Kingston sits halfway along the Toronto–Montréal mainline, and the Toronto–Ottawa trains use the same track as far as Brockville. So Kingston collects two timetables instead of one, and ends up with a level of service beaten only by the three biggest cities on the corridor. Frequency matters to ridership on its own, quite apart from speed: in intercity rail, a 10 per cent increase in service typically brings 4 to 7 per cent more trips.

    The station serves a region, not a city

    Napanee, Gananoque, Amherstview and the western Thousand Islands have no intercity rail of their own, so people drive to Kingston to catch the train. Ridership credited to a city of 132,485 is actually generated by an area several times larger; the Kingston census metropolitan area is 172,546.6

    The population is unusually inclined to take the train

    Some thirty‑nine thousand post‑secondary students study in a city of 132,485: Queen’s enrols 32,585, St. Lawrence College about 4,000 full‑time equivalents at its Kingston campus, and the Royal Military College of Canada 2,418.5 That is about twenty‑nine students for every hundred residents — against roughly twenty‑three in Sherbrooke and twenty‑one in Guelph, the two Canadian cities most often set beside Kingston on this measure.7 Many come from the Toronto and Ottawa regions and travel without a car. Kingston also has a large retired population, for whom avoiding the highway is the point of the trip, and an unusually high share of hospital, university, military and public‑sector jobs where travel is expensed and defaults to rail.

    But that ridership is hard to charge a premium for

    This travel is not spread evenly. It piles up at term boundaries, Thursday and Sunday afternoons, reading weeks and holidays, and it creates a matching flow of families travelling to Kingston. These are the travellers most sensitive to how often trains run and how far the station is from where they are going, and the least able to just drive instead. They are also the least profitable: peaked, price‑sensitive, and largely outside the weekday business hours a high‑speed operation’s revenue depends on.

    Two things worth being clear about

    The ridership figure itself is not published. Kingston’s standing as one of the busiest stations rests on statements by the operator and the Minister, not on released station‑level data. That is the first item on the list of things that should be published, at the end of this brief.

    Existing demand is not the same as new demand. Busy today proves Kingston already travels by train. It does not prove that a different station would generate additional trips. Only new trips add ridership to the corridor.

    There is also no flight from Kingston to Toronto. Elsewhere, high‑speed rail wins its premium passengers off aircraft. In Kingston those passengers are already on the train, so there is nobody to convert. Extra trips can only come out of cars, or be created from nothing.

    Both of the things that built Kingston’s ridership — frequent trains, and a station within the city, roughly ten minutes from the core and the university — are the two things a high‑speed alignment north of the city takes away. That is what the model is built to test.

    Method

    How the numbers were worked out

    Every trip is priced in minutes. Add up the time on the train, the time getting to and from the station at each end, the waiting created by having fewer trains, and the fare converted into minutes using what an hour is worth to that kind of traveller. Time spent driving to a station or standing on a platform counts for more than time sitting on a moving train, because people dislike it more. Journeys that involve changing trains carry an allowance for the change. That matters for one market in particular: ALTO reaches Montréal from Kingston by way of Ottawa, so some of those journeys involve a change, where a direct lakeshore railway does not.

    That total is the real cost of the trip. If it goes up, fewer people travel. If it goes down, more do. The response used here is roughly one for one: make the total 10 per cent better and you get about 10 per cent more trips.

    Travellers are split into four destinations and four types, each divided by whether they have a car available: thirty‑two groups, each worked out separately and then added up. That matters because a student without a car and an expensed public‑sector traveller react to a distant station in completely different ways.

    Table 2 · Everything the model assumes

    InputValue used
    Trips today450,000 a year through the station (tested from 400,000 to 550,000)
    Where people goToronto 58%, Ottawa 22%, Montréal 12%, other corridor stations 8%
    Who travelsStudents 30%, seniors and leisure 25%, public sector 20%, other 25%
    Share without a carStudents 85%, seniors and leisure 50%, public sector 15%, other 20%
    Worth of an hour$14, $20, $48 and $24 respectively, in the same order
    Time on the trainToday 135 / 120 / 160 min; ALTO 80 / 45 / 105 min (Toronto / Ottawa / Montréal)
    Getting to the stationExisting station 10 min by car, 20 by transit; ALTO 27 by car, 35 by shuttle
    How that time is weighted1.5 times if a car is available, 2.0 times if not
    WaitingHalf the gap between trains, weighted at 0.5, across a fifteen‑hour day
    ALTO fare premium25% in the central case; 0% and 40% also tested
    Sensitivity of demandOne for one in the central case (tested from 0.8 to 1.2)

    Far‑end access time is held identical in every scenario, which is a conservative choice: it gives ALTO the benefit of the doubt at the Toronto and Ottawa ends.

    Two possible futures for today’s trains

    Every service level is tested twice, because the answer depends less on ALTO than on what happens to the service Kingston already has.

    Replacement

    ALTO becomes Kingston’s rail service to Toronto, Ottawa and Montréal, and conventional service is withdrawn or cut below a useful level. Trips to Belleville, Brockville, Cobourg, Napanee and Oshawa lose their train altogether.

    Both together

    Today’s service keeps running at present frequency and ALTO is added on top. Travellers pick whichever is cheaper in total, and only the improvement over the better of the two creates new trips.

    What is assumed rather than known

    Four inputs are estimates, not published data: the number of trips today, where those trips go, ALTO’s journey times (the alignment for this stretch has not been published), and where the station would be. All four appear on the list at the end of this brief. The model also applies a constant response to a very large change in trip cost, which is at the outer edge of where this method behaves well. The direction of the results is solid. The exact sizes are indicative.

    Result One

    Where the speed gain goes

    Start with today’s service and change one thing at a time. This is the clearest way to see why a faster train can still end up with fewer passengers.

    Table 3 · One change at a time

    StepAnnual tripsChangeEffect of this step
    Today’s service, as it runs450,000
    Cut the Toronto run to 80 minutes, change nothing else496,000+10%+10 pts
    Cut stops from 18 a day to 8449,0000%−10 pts
    Add a 25 per cent fare premium403,000−10%−10 pts
    Move the station 27 minutes north376,000−17%−6 pts

    The second row is the entire value of high‑speed running time at Kingston: about 10 per cent. Each of the three things that come with it takes back as much or more. This calculation already leaves out trips to other corridor stations, which a high‑speed line cannot serve at any frequency.

    Result Two

    More trains cannot fix it on its own

    Suppose the number of stops is the thing that gets negotiated. Hold the station twenty‑seven minutes north and the fare 25 per cent higher, and vary how often ALTO calls.

    Table 4 · ALTO at a station 27 minutes north

    Stops a dayAnnual tripsChangeRangeIf today’s trains stay
    6359,000−20%−17% to −24%0%
    8376,000−17%−13% to −21%0%
    10387,000−14%−10% to −18%+0.2%
    18408,000−9%−4% to −14%+1.6%
    12 (six each way)394,000−12%−9% to −17%+0.5%
    16 (eight each way)404,000−10%−6% to −15%+1.3%
    20 (ten each way)411,000−9%−3% to −14%+1.9%

    The range covers the whole plausible span of the model’s assumptions, at a 25 per cent fare premium. The bottom three rows read six, eight and ten as stops each way, which is the most generous reading available. It improves the result without changing the sign. The last column is the “both together” case, where today’s service survives: ALTO then adds almost nothing, because travellers only switch when it is genuinely better for them.

    The fare premium matters more than the timetable

    Table 5 · What moves the answer

    Stops a dayNormal faresFares +25%Fares +40%Station 25 min outStation 45 min out
    6−12%−20%−24%−17%−23%
    8−8%−17%−21%−13%−20%
    10−5%−14%−19%−10%−17%

    The last two columns hold the fare premium at 25 per cent and vary the drive from the station to downtown; the central case is 27 minutes. Notice that going from normal fares to a 25 per cent premium costs more than doubling the distance to the station.

    How many trains would it actually take?

    The more useful question is what it would take for an out‑of‑town ALTO station to be no worse for Kingston than the service it already has. At normal fares the answer is nine stops a day for everyone. At a 25 per cent premium, the answer falls apart.

    Table 6 · Daily stops needed just to match today, Toronto trips

    Who is travellingAt normal faresAt a 25% premium
    Public sector and institutional (expensed)913
    Other business and leisure927
    Seniors, leisure, visiting family948
    Students and young adults9no number works

    Forty‑eight stops a day is a train every twenty minutes all day. For students, no frequency at all makes up for a distant station plus a premium ticket, because their time is worth less than the fare increase costs them.

    One case runs the other way and should be said plainly: expensed public‑sector travel between Kingston and Ottawa is better off under ALTO in every scenario tested, because today’s service on that pair is slow and indirect. It is a real gain, and it is a small share of the total.

    Under the friendliest assumptions available — normal fares, a station twenty‑five minutes out, today’s trains kept running alongside, ten stops a day — the best figure the model will produce for an out‑of‑town Kingston station is about +8 per cent. Getting there means giving up the premium pricing the revenue case depends on everywhere else.

    Result Three

    What if you just made today’s trains faster?

    Now reverse the test. Keep the existing station, keep eighteen stops a day, keep normal fares, and change nothing but speed on the existing route.

    Table 7 · Speed alone, from the existing station

    Toronto journey timeTime savedAnnual tripsChange
    135 min, as it runs today450,000
    118 min, reliable 160 to 177 km/h13%471,000+4.6%
    95 min, a 240 km/h conventional railway30%502,000+11.6%
    80 min, upper bound for this station41%525,000+16.6%

    The last row applies high‑speed running time to the existing station. It is there to separate speed from station location, frequency and fare, not as a proposal.

    The comparison that matters

    Eighty minutes to Toronto from the existing station, eighteen stops a day, normal fares: about +17 per cent. The same eighty minutes from a station twenty‑seven minutes out of town, eight stops a day, fares 25 per cent higher: about −17 per cent.

    The time on the train is identical. The two outcomes are thirty‑four points apart, and every one of those points is station location, frequency and fare.

    Speed gives diminishing returns

    Roughly speaking, every 1 per cent cut in journey time buys about 0.4 per cent more trips. A 30 per cent time saving buys about 12 per cent more passengers. For most of Kingston’s travellers, time on the train is a minority of what the trip really costs them — fare, getting to the station and waiting make up the rest, and speed does nothing about any of those. The gain concentrates where an hour is worth most: on a 95‑minute conventional railway, public‑sector travel grows about 17 per cent, business and leisure 13, seniors and leisure 12, students 10.

    A conservative figure, and a warning

    These figures are cautious. The response to journey time implied here is weaker than the rail literature usually finds, because the fare term in the calculation dampens it. Using a more standard figure, the same 30 per cent time saving would give about +22 per cent rather than +12. Table 7 should be read as a floor, with the 95‑minute case plausibly worth anywhere from +10 to +25 per cent. The comparisons earlier in the brief are unaffected, because they compare like with like.

    The warning is that fares erode the gain fast in either direction. Raising tickets 10 per cent to help pay for an upgrade cuts the benefit from about +12 per cent to about +7 — two‑fifths of the speed gain eaten by a 10 per cent fare rise. That is the same mechanism that sinks the high‑speed cases, working here on the alternative. It is an argument for funding an upgrade from capital rather than from the farebox.

    What It Means

    A stop is not the same as service

    Three things set whether Kingston gains or loses, and speed is not one of them: how far the station is from where people are actually going, what the ticket costs, and whether today’s trains survive. Frequency cannot rescue the result on its own. At eighteen stops a day, matching today, an out‑of‑town station at a premium fare still comes out around 9 per cent down.

    A public debate about whether Kingston gets a station, and how many trains stop there, is a debate about the wrong variables.

    The two things ALTO has said do not fit together

    A station justified by strong ridership, but served by a minority of trains, has its timetable set by the express service rather than by the demand used to justify it. Table 6 shows why that is not a workable compromise: the frequency needed to make the station work at a premium fare is far above what an express pattern tolerates. The usual international answer is two tiers, express and semi‑fast, which needs somewhere for fast trains to overtake at the intermediate station. Whether the cost estimate includes that overtaking capacity is a question with two possible answers, and both are informative.

    A conventional railway does better here

    A new conventional railway built for 240 km/h, running typically at 200, serves Kingston without moving the station, without the fare premium high‑speed operation needs, and without cutting the number of trains that stop. It captures a smaller share of the theoretical time saving and a larger share of the ridership. That is the trade the tables above quantify.

    What Would Change the Answer

    Three commitments, and four documents

    None of this is a prediction that a Kingston station must fail. The results turn on assumptions, and those assumptions are all things the project could settle.

    Would help
    A station much closer to the core, or a frequent connection to it that is committed and timed to the trains rather than hoped for.
    Would help most
    Normal fares on Kingston journeys. Table 6 shows this is the single decisive variable. A premium fare is what makes the arithmetic unrecoverable for students, seniors and leisure travellers.
    Would help
    A binding commitment that service on the existing line is maintained, which turns the replacement case into the both‑together case, plus a published timetable, so frequency becomes a fact instead of an assumption.

    Four things that should be published

    Before any of these figures are treated as more than an order of magnitude, four inputs should be replaced with real data:

    Not published
    Station‑level boardings and destinations. This alone would settle both the number of trips today and where they go. A matter for the operator.
    Not published
    The calling pattern assumed for the Toronto–Ottawa segment — how many trains actually stop, and where.
    Not published
    The fare structure for intermediate stations. On the evidence above, this matters more than anything else on the list.
    Not published
    The station location, with the assumed travel time from it to downtown Kingston.

    The first sits with the operator. The other three sit with the project and its joint project office, whose report and business case remain unpublished.

    The finding that matters

    It is not that a Kingston station would fail. It is that the service Kingston already has is the benchmark the project has never been asked to beat — and on the assumptions set out here, it does not beat it.

    How to read the numbers on this page

    Every number here other than the two quoted statements is output from our own model, built on the parameters listed in the full brief. Those parameters are assumptions, not measurements, and the four listed above as needing publication are the ones that move the result. The model is set out so that any parameter can be replaced and the arithmetic re-run: the direction of the findings holds across the ranges tested, the exact magnitudes are indicative.

    Where ALTO has not published something — a timetable, a station location, a fare — we say so rather than inferring it, and we make no claim about why it has not been published.

    Sources
    1.
    CBC News, “Kingston probably getting high-speed rail stop, says Alto CEO,” 22 July 2026 — interview with Martin Imbleau on CBC Radio’s Ottawa Morning. He says Kingston will probably receive a station, citing ridership, and that most ALTO trains would pass through without stopping, along with Laval and Trois-Rivières, to preserve express service between the larger cities. cbc.ca
    2.
    City of Kingston, Council Meeting Minutes 2026-06, 17 February 2026, Resolution 2026-73, carried as amended 9–2 — support for a southern route contingent on Highway 401 corridor development and on a stop being added in Kingston, as close to the urban core as possible. Examined in the companion brief Which Trains Stop in Kingston?
    3.
    Elasticity ranges: intercity frequency elasticities of +0.4 to +0.7 and journey-time elasticities of −0.6 to −0.9 are the conventional ranges in the rail demand literature, used here as reference values rather than as findings of this brief. The generalised-cost elasticity of −1.0 central, banded −0.8 to −1.2, is our own choice and is tested across that band throughout.
    4.
    Current journey times are as timetabled by VIA Rail. ALTO journey times are our assumption, since no alignment has been published for the Toronto–Ottawa segment.
    5.
    Queen’s University, 2025–26 Enrolment Report, as at 1 November 2025 — 28,561 full-time students, plus 1,704 part-time undergraduate, 1,389 part-time graduate and 931 online undergraduate, giving 32,585 in total. St. Lawrence College reports about 4,000 full-time equivalents at its Kingston campus. Royal Military College of Canada: 1,209 full-time and 587 part-time undergraduate, 276 full-time and 346 part-time graduate students, giving 2,418 in total. RMC’s part-time and graduate enrolment includes serving officers studying at a distance, so it is counted here on the same all-enrolment basis as Queen’s rather than as a resident population; on full-time enrolment alone the city total is about 38,000, and the ratio is about twenty-nine per hundred either way. macleans.ca queensu.ca (PDF)
    6.
    Statistics Canada, 2021 Census of Population — City of Kingston (census subdivision) 132,485; Kingston census metropolitan area 172,546, comprising the City of Kingston, South Frontenac, Frontenac Islands and Loyalist Township. statcan.gc.ca
    7.
    Comparators, on the same all-institutions basis where the data allow. Sherbrooke: about 40,000 students across eight institutions in a city of 172,950, roughly twenty-three per hundred residents. Guelph: 29,617 full-time equivalents at the University of Guelph in a city of 143,740, roughly twenty-one per hundred — a figure that excludes the Conestoga College campus and is therefore a floor. ocul.on.ca
    Download Full Brief
    Kingston’s ALTO Ridership Analysis (PDF)
    Full method, all thirty‑two market segments, sensitivity bands and break‑even calculations
    Download PDF