Tag: Bent Flyvbjerg

  • Procured and then

    ALTO HSR Citizen Research Initiative · Brief · September 2026

    Procured, and Then?

    ALTO commissioned the outside view. Whether it changed anything is the one question the record does not answer.

    In Plain Language

    The standard fix for over-optimistic infrastructure forecasts is to check them against what comparable projects actually cost and carried, rather than trusting the project’s own bottom-up numbers. That check is called reference-class forecasting, and ALTO commissioned one. It hired the firm founded by the researcher who developed the method.

    That is to ALTO’s credit. But commissioning a check and acting on it are different things, and only one document would show which happened: a comparison putting ALTO’s own published figures beside the ones the check produced. The Initiative asked for that record. The response was extended to 18 September 2026, with notice that a third party would be consulted — a step the Act provides for where an institution intends to release records that may contain a supplier’s commercial information.

    Meanwhile, in June 2026, ALTO published two studies putting large dollar values on the project’s benefits. Neither sets those benefits against what the line would cost. This brief looks at all three documents and asks what they show about how the project’s numbers are being assembled — and what a single unredacted release would settle.

    Download
    Procured, and Then? (PDF)
    The full brief, with sources
    Download PDF
    Related
    HPR Research Report, Chapter 1
    The forecasting framework this brief applies, set out in full
    Read Chapter 1
    01 · The Instrument

    ALTO commissioned the outside view

    Chapter 1 of the HPR Research Report sets out the method this brief relies on, so it is only summarised here. Large infrastructure forecasts miss in a consistent direction: costs come in high, benefits come in low. The established corrective is to stop treating a project as unique and instead compare it against the recorded outcomes of projects like it. The technique has a name — reference-class forecasting — and a literature behind it.

    In 2024 ALTO issued an advance contract award notice, PAS240625-002-00, for reference-class forecasting, should-cost and should-schedule modelling, and a series of Challenge Boards. An advance contract award notice is the instrument used when a department intends to award without competition, on the basis that only one supplier can do the work. The named supplier was Oxford Global Projects, the consultancy founded by Bent Flyvbjerg and Alexander Budzier.

    This is worth stating plainly, because it cuts against the easy criticism. ALTO did not ignore the outside view. It went out and procured it, from the people who developed it.

    02 · The Question

    Buying the instrument is not the same as letting it bind

    Reference-class forecasting corrects a forecast only if the number it produces is permitted to move the decision. A should-cost that is commissioned, delivered and then filed next to an unchanged inside-view estimate has not corrected anything. The method’s own literature is explicit that the failure mode is not the absence of the outside view but its subordination — the number produced, and then declined.

    So the decisive record is not the existence of the forecast. It is the comparison: does ALTO’s published capital cost reflect its own reference-class should-cost, or diverge from it? One document would answer that — the inside view and the outside view set side by side.

    A test, not an accusation

    This yields something better than a claim about anyone’s conduct: a prediction that can be checked. If the commissioned reference-class figures are more conservative than the numbers ALTO has published, the outside view was procured but not applied. If they match, the Initiative’s cost critique weakens accordingly.

    We do not know which. Nothing in this brief asserts that ALTO set the analysis aside. The point is that the question is answerable, that a single document answers it, and that the document exists.

    03 · The Clock

    The record will arrive after the decision has moved on

    The Initiative requested the reference-class records under access to information — the workbook, the should-cost and should-schedule outputs, and above all any document setting the inside view beside the outside view. Request A-2026-0004 was met in June 2026 with a ninety-day extension carrying the response to 18 September 2026, together with a notice invoking third-party consultation under section 27.

    Section 27 consultation is a routine step, and it is worth being precise about which way it points. The section applies where the head of an institution intends to disclose a record that may contain a third party’s commercial information: the notice tells that third party of the intention to release and gives it twenty days to make representations against disclosure, and invoking the section is what permits the response time to be extended. The notice on A-2026-0004 therefore records that Alto has turned its mind to releasing the reference-class records and has given Oxford Global Projects the opportunity to object. It is not a signal that the material will be withheld.

    What remains is a question of timing rather than intent. The third party may object and the institution may then withhold some of the figures; equally it may not. What can be said is the sequence: the record capable of testing the decision will arrive after further commitment has been made. What it contains, the disclosure itself will settle.

    Why timing decides this

    An outside-view check disciplines a decision only while the decision is still open. Once enough money is committed, the arithmetic changes: the cost of stopping is subtracted from the cost of continuing, and a project can show better value for money the more has already been spent on it. Britain’s High Speed Two reached exactly that point — the National Audit Office found in June 2026 that the ratio for completing the programme had risen even as the programme grew more expensive, because the estimated cost of cancelling had more than quadrupled.

    The cheapest moment to apply the test is before that crossover, not after it.

    04 · The Benefit Case

    Two studies, no cost side

    In June 2026, two months after the consultation closed, ALTO released two commissioned studies. A computable general equilibrium assessment by Aviseo Consulting reports a national real GDP gain of about $24.4 billion a year. A corridor tourism study by CPCS with HDR adds up to $3.9 billion in GDP and 43,000 jobs.

    Neither nets a cost. The macroeconomic study excludes construction and operating expenditure by design; the tourism study has no cost side to exclude. Both are benefit totals unaccompanied by the outlay required to obtain them. Both, to their credit, describe their outputs as illustrative and order-of-magnitude rather than forecasts, and make the largest figures conditional on tourism policy the railway itself does not deliver.

    The scenario range has a floor and no ceiling on the downside

    Each study is built as a fan of scenarios, from pessimistic to optimistic. In both, the entire fan sits above zero. The macro study reports welfare increasing in every scenario; the tourism study’s weakest case is still $177 million and two thousand jobs. The modelled question is how large the gain is, never whether there is a loss.

    Adverse mechanisms are identified but do not reach the total

    The tourism study acknowledges that faster trains shorten stays and convert overnight visits into day trips, and shows length of stay falling in several cities. The aggregate rises regardless.

    The two studies disagree, and each resolves the disagreement upward

    The macro study omits domestic tourism on the ground that it is largely substitution from other household spending, with little net effect on national output. The tourism study builds most of its $33.7-billion base, and most of its headline uplift, from precisely that in-corridor domestic travel — counted through gross multipliers that assume no such displacement. The two treatments diverge, and in each case the treatment adopted is the one that yields the larger figure for that study.

    The studies import the literature’s upside but not its realisation record

    Both studies draw their benefit magnitudes from the international high-speed rail literature — the same comparison set the Initiative uses. What they import is the size of the upside. What they do not import is that literature’s record on realisation: rail benefits arriving at about two-thirds of forecast, and passenger numbers overstated by roughly a hundred per cent.

    Each of the four observations above is a description of what the documents contain. Taken together they describe a benefit case in which every point of divergence has resolved in the same direction — which is the pattern the forecasting literature says to look for, and the reason an independent outside-view comparison matters more, not less, once numbers of this size are in circulation. The same two studies are examined in detail in the Initiative’s briefs Two Point Two Trillion and At Face Value.

    05 · The Ask

    Publish the comparison

    The Initiative’s recommendation is narrow and does not require anyone to accept a word of its own analysis.

    01
    Release the comparison in full. ALTO should publish its reference-class should-cost and should-schedule outputs alongside its published capital cost and benefit-cost figures, unredacted. The outside view was commissioned to be seen, not filed.
    02
    Publish the benefit studies against a cost. A $24.4-billion annual benefit figure is not interpretable without the outlay required to obtain it. The two June 2026 studies should be accompanied by an appraisal that nets one against the other.
    03
    Apply the test before further commitment. The window in which an outside-view check can still change a decision is open now. It narrows with every disbursement.

    It requires one document to be made public. The framework behind the request is set out in full in Chapter 1 of the HPR Research Report; what ought to be built instead is the subject of the chapters that follow it.

    How to read this brief

    Every figure attributed to Alto, Aviseo, CPCS, the National Audit Office or a published paper is quoted from the source listed below and can be checked there. Nothing else here is a calculation of ours: the argument rests on what the documents contain and on the sequence of dates, not on a competing estimate.

    Where a record has not been released, this brief says so rather than inferring its contents, and makes no claim about why any extension was taken or any figure was or was not published. The prediction in section 02 is stated in both directions and will be settled by the disclosure, not by us.
    Sources

    Documents relied on

    1
    Alto (VIA HFR – VIA TGF Inc.). Advance Contract Award Notice PAS240625-002-00 — project management and control expertise; pre-identified supplier Oxford Global Projects UK Limited. 2024.
    2
    Alto (VIA HFR – VIA TGF Inc.). Notice of extension, Access to Information request A-2026-0004. June 2026. On file with the Initiative.
    3
    Aviseo Consulting. An Overview of the Structural Economic Impacts of Alto: Computable General Equilibrium Modelling Approach to Assessing High-Speed Rail in the Toronto–Québec City Corridor. Prepared for Alto. June 2026.
    4
    CPCS, in association with HDR. Tourism in the Alto Corridor: Current Conditions and Potential Impacts. Prepared for Alto. June 2026.
    5
    National Audit Office. High Speed Two reset. Report by the Comptroller and Auditor General, Session 2026-27, HC 52. London: National Audit Office, June 2026.
    6
    Flyvbjerg, Bent. “Quality Control and Due Diligence in Project Management: Getting Decisions Right by Taking the Outside View.” International Journal of Project Management 31, no. 5 (2013): 760–774.
    7
    Flyvbjerg, Bent. “Top-Ten Behavioral Biases in Project Management: An Overview.” Project Management Journal 52, no. 6 (2021): 531–546.
  • Deconstructing the Megaproject Playbook

    Coalition for Better Rail · ALTO HSR Citizen Research Initiative · The HPR Research Report

    Deconstructing the Megaproject Playbook

    Why big rail projects almost always cost more and carry fewer riders than promised — and how to check a project’s numbers against the real-world record, not just its own promises.

    This chapter explains the method behind every number in this report. It’s based on the work of Bent Flyvbjerg, an Oxford researcher who has spent decades studying how big infrastructure projects around the world actually turn out, compared to what they promised. His findings have been confirmed again and again, across many countries and many kinds of projects. We use his method for every forecast in this report — and we’re explaining it here first, before any of our own results, so you can see the rules before you see the numbers.

    Download
    Chapter 1: Deconstructing the Megaproject Playbook (PDF)
    The full chapter, with footnotes and sourcing
    Download PDF
    1.1 · The Track Record

    The iron law of megaprojects

    Here’s an uncomfortable fact: big public infrastructure projects almost always cost more, take longer, and carry fewer passengers than promised. This isn’t bad luck on any one project — it’s been true again and again, everywhere records have been kept, for decades. Researcher Bent Flyvbjerg calls this the iron law of megaprojects: over budget, over time, under benefits — over and over again, regardless of country, project type, or how sophisticated the planning was.

    1.40×
    What rail projects actually cost, on average, vs. what was first promised
    0.66×
    The benefits rail projects actually deliver, on average, vs. what was promised
    52%
    Average budget overrun for high-speed rail specifically
    106%
    How much rail projects overestimate rider numbers, on average
    9/10
    Rail projects that predicted more riders than they actually got
    +45%
    How much longer construction takes than planned, on average

    Our own analysis of ALTO finds the same pattern. The published benefit-cost ratio — a standard measure of whether a project’s benefits are worth its costs — is already far short of break-even. The December 2021 business case for the predecessor project put it at about 0.13 over 30 years, or about 0.4 once some newer and less established benefit categories are counted. A ratio of 1.0 is the point where benefits merely equal costs. Correct the cost and ridership numbers using the real-world track record, and that ratio falls further still. This doesn’t mean going over budget is inevitable. It means any assessment that ignores this well-documented pattern is starting from an unrealistic place — not by accident, but by leaving out the most relevant evidence available. ALTO’s risk profile isn’t an unlucky exception. It’s exactly what you’d expect from a project of this size, this type, and this level of political backing.

    1.2 · Two Reasons Forecasts Go Wrong

    Honest mistakes and strategic misrepresentation

    There are two different reasons a project forecast can turn out to be wrong — and it matters which one is at play, because they call for very different fixes.

    Optimism bias — the honest mistake

    Planners genuinely believe their numbers. They aren’t lying — they’re not even aware they’re being too optimistic. This is a well-documented pattern in psychology: people naturally focus on the details of their own project and forget to check how similar projects have actually gone in the past. It’s a fixable process problem — the fix is forcing real-world comparisons into every estimate.

    Strategic misrepresentation — telling people what they want to hear

    Costs get underestimated and benefits get overestimated on purpose, to get a project approved and funded. Writing about the research record as a whole, Flyvbjerg borrows a word from ethics and calls this what it is: lying. It’s an incentive problem — and it’s only fixed by changing what forecasters are rewarded and held accountable for.

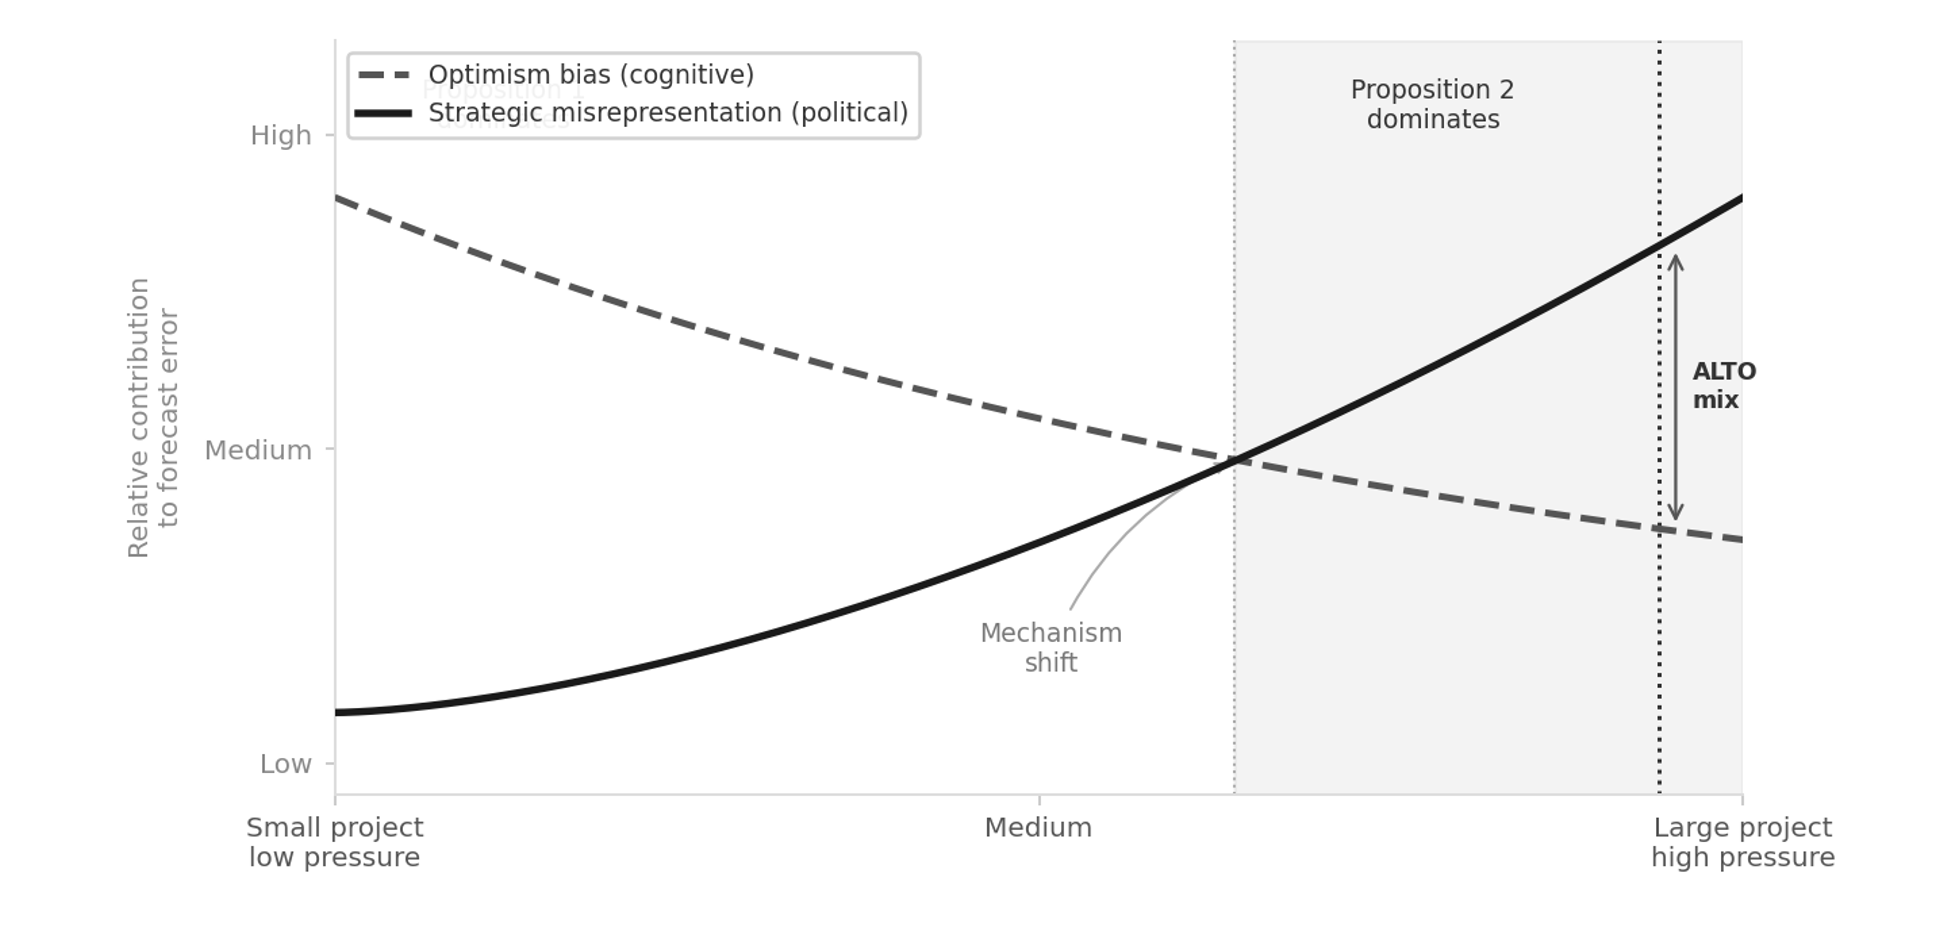
    In real projects, both are usually present together, and the mix shifts with the stakes. For small, low-attention projects, honest mistakes tend to be the bigger factor. For large projects with strong political backing — the kind a minister or a Crown corporation needs approved — strategic misrepresentation tends to dominate, with honest optimism layered on top rather than absent.

    The pattern, stated plainly

    Underestimate the cost, overestimate the benefit, and you get funded. This isn’t random. It points in exactly the direction that wins the competition for a limited pool of money.

    1.3 · Structural Profile

    Where ALTO sits on the scale

    Flyvbjerg’s research lets us predict, in general terms, which kind of error is more likely for a given project — without needing to know what’s in anyone’s head. For small projects that don’t attract much political attention, honest mistakes are usually the bigger factor. For large projects with major political weight behind them, strategic misrepresentation usually is — with honest mistakes still layered on top.

    Diagram showing how the mix of honest mistakes and strategic misrepresentation shifts with project size and political pressure
    Figure 1.1. How the mix of honest mistakes and strategic misrepresentation changes as a project gets bigger and more politically important. Honest mistakes (dashed line) matter more for small, low-pressure projects and fade — but never fully disappear — as projects grow. Strategic misrepresentation (solid line) is close to zero for small projects but rises sharply and takes over for large, high-pressure ones. Large, politically backed projects competing for scarce funding sit at the right-hand end of this scale.

    ALTO checks every box that predicts heavy political pressure. It’s run by a federal Crown corporation with a multi-billion-dollar budget. It has had public backing from successive governments. And it’s competing against every other federal priority for a limited pot of money. By this framework’s own logic, projects in that position sit at the end of the scale where the research expects political pressure, rather than honest error, to account for most of the pattern across the class. The pressure to look good is strongest exactly where the numbers matter most for getting funded.

    Flyvbjerg calls this the survival of the unfittest: it isn’t necessarily the best projects that get built — it’s the ones that look best on paper. The approval process quietly rewards optimistic numbers over honest ones: a proposal with realistic costs and realistic ridership loses the funding contest to one that doesn’t. Seen this way, the fact that ALTO has survived several rounds of budget approval isn’t proof its numbers are wrong — but it is a reason to look at them carefully rather than take them at face value.

    To be clear

    None of this requires anyone at ALTO to be lying. An honest mistake would produce errors that go in both directions about equally — some projects under budget, some over. What actually happens, again and again, is that the errors all point the same way: costs come in higher, benefits come in lower. That one-directional pattern is the tell. It is why this report checks ALTO’s published figures against the real-world record instead of accepting them on their own terms. Nothing here identifies the cause of any particular number, and this report makes no claim about the honesty of any person or organisation.

    1.4 · The Uniqueness Trap

    Why “it’s different this time” doesn’t hold up

    One of the most common — and most costly — mistakes in big project planning is treating a project as one-of-a-kind, and therefore exempt from comparison with anything else. ALTO has been promoted as Canada’s first true high-speed railway, on uniquely Canadian geology, on an unprecedented corridor. That’s exactly the kind of claim researchers have found, again and again, opens the door to over-optimistic forecasting.

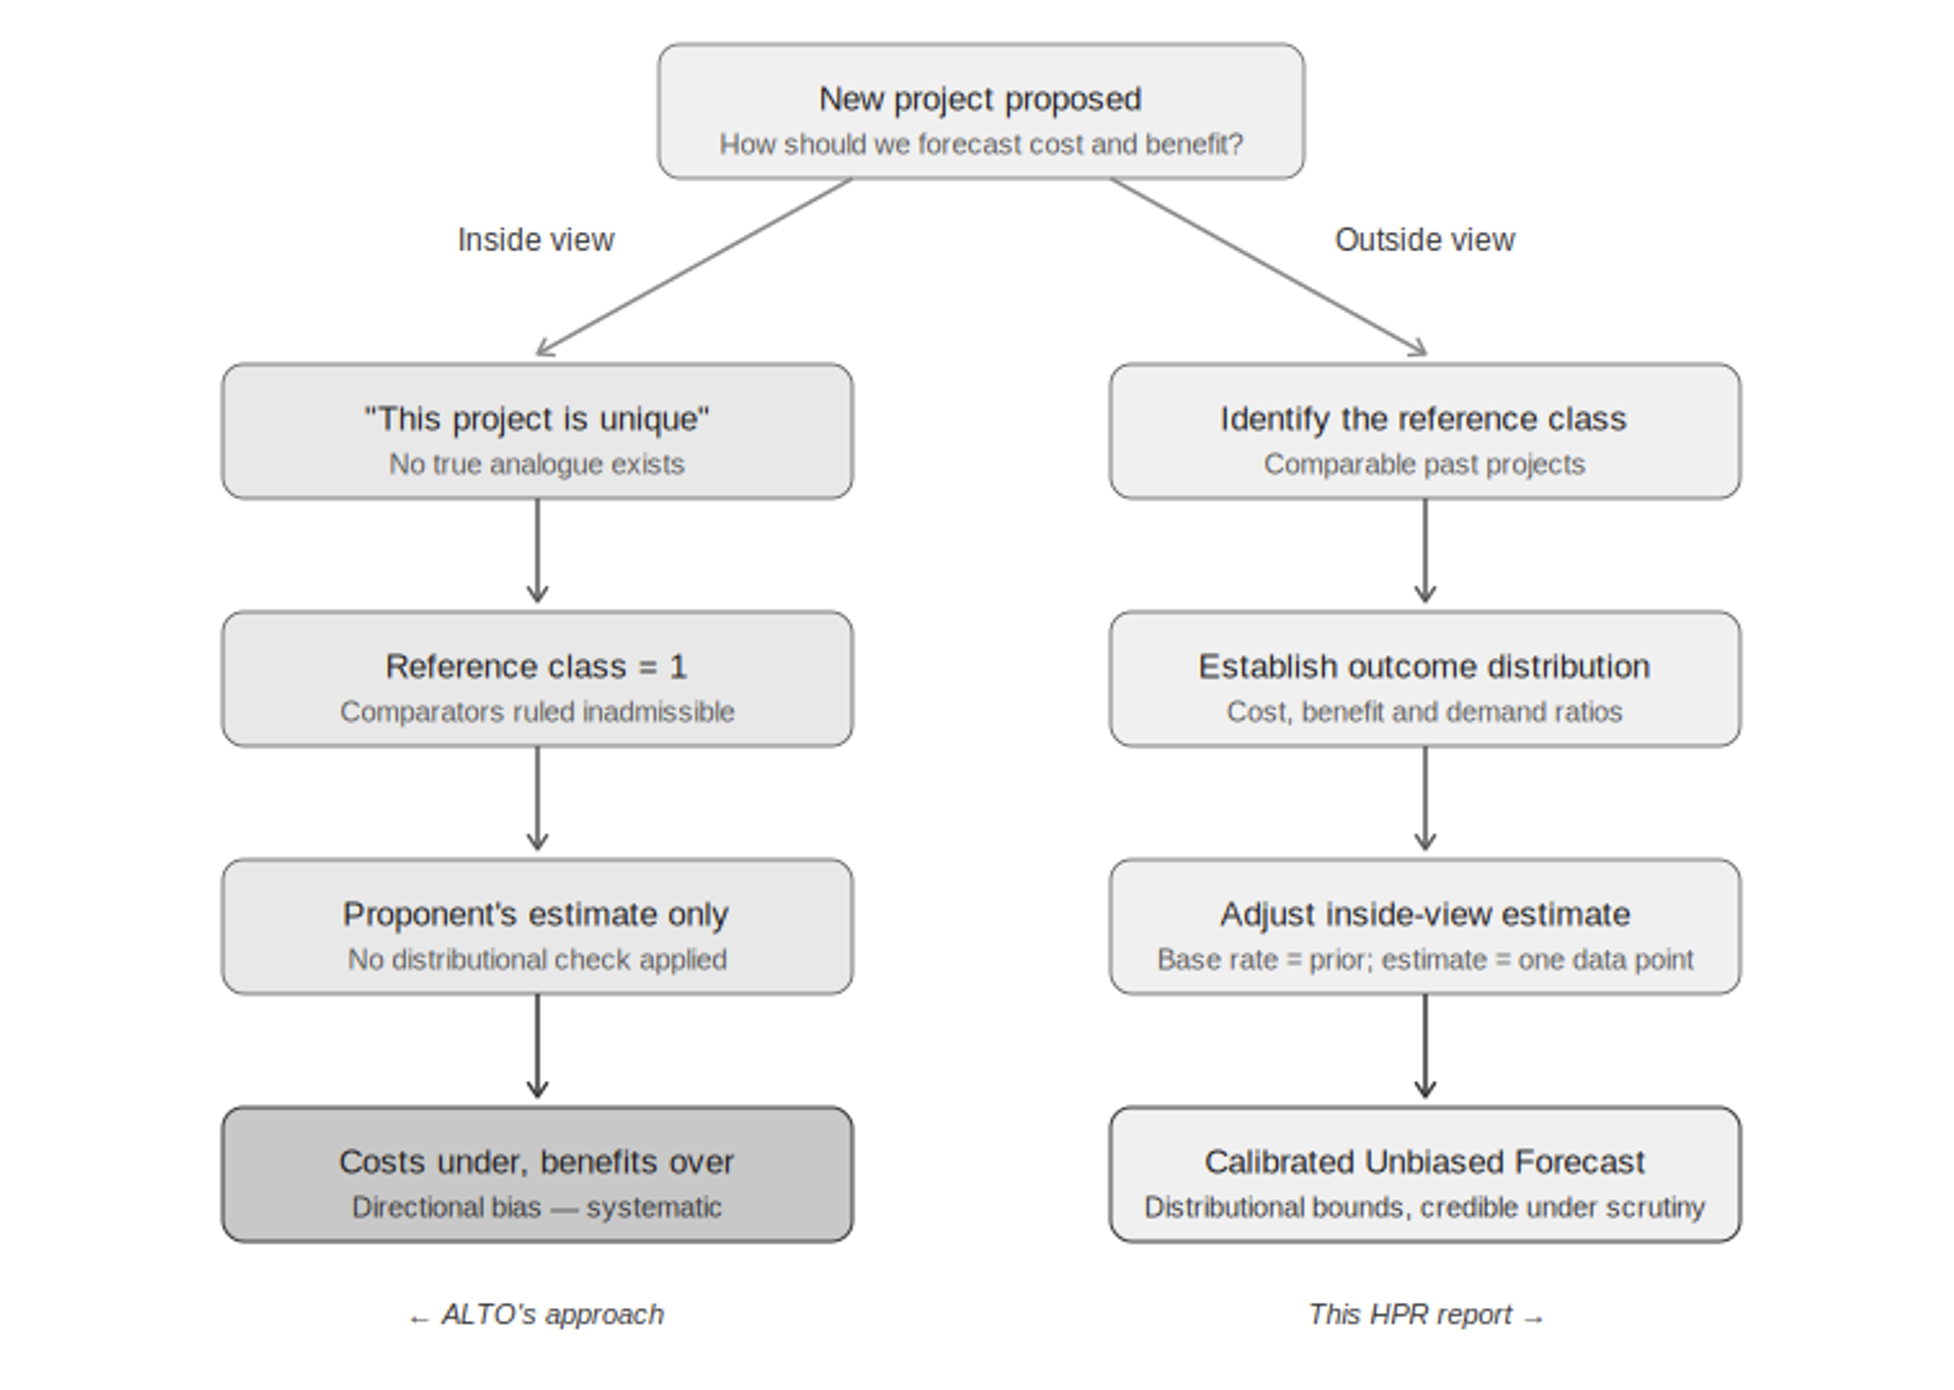
    Diagram contrasting a uniqueness claim, which leaves nothing to compare a project against, with the outside view, which checks the estimate against similar projects elsewhere
    Figure 1.2. The uniqueness trap. Claiming a project is unique (left) leaves nothing to compare it to, so all you can do is trust the project’s own estimate. Looking at similar projects elsewhere (right) means checking that estimate against real-world evidence instead. This report takes the second approach throughout.

    Here’s why the “unique” claim matters so much. If a project is truly one of a kind, there’s nothing to compare it to — which means the only evidence left is the very estimate you’re trying to check. Every comparable project, every real-world outcome from similar lines, gets waved away as not relevant. This report takes the opposite view: ALTO is one example of a well-studied category — high-speed and intercity rail megaprojects — and there’s plenty of real-world data on how that category actually performs. That data is the most relevant evidence available.

    What the disagreement is really about

    The disagreement between this report and ALTO’s own numbers isn’t really about any single figure. It’s about whether ALTO should be judged purely on its own terms, as a one-off case — or against how similar projects have actually turned out.

    1.5 · Risk of Bad Surprises

    Why standard contingency budgets fall short

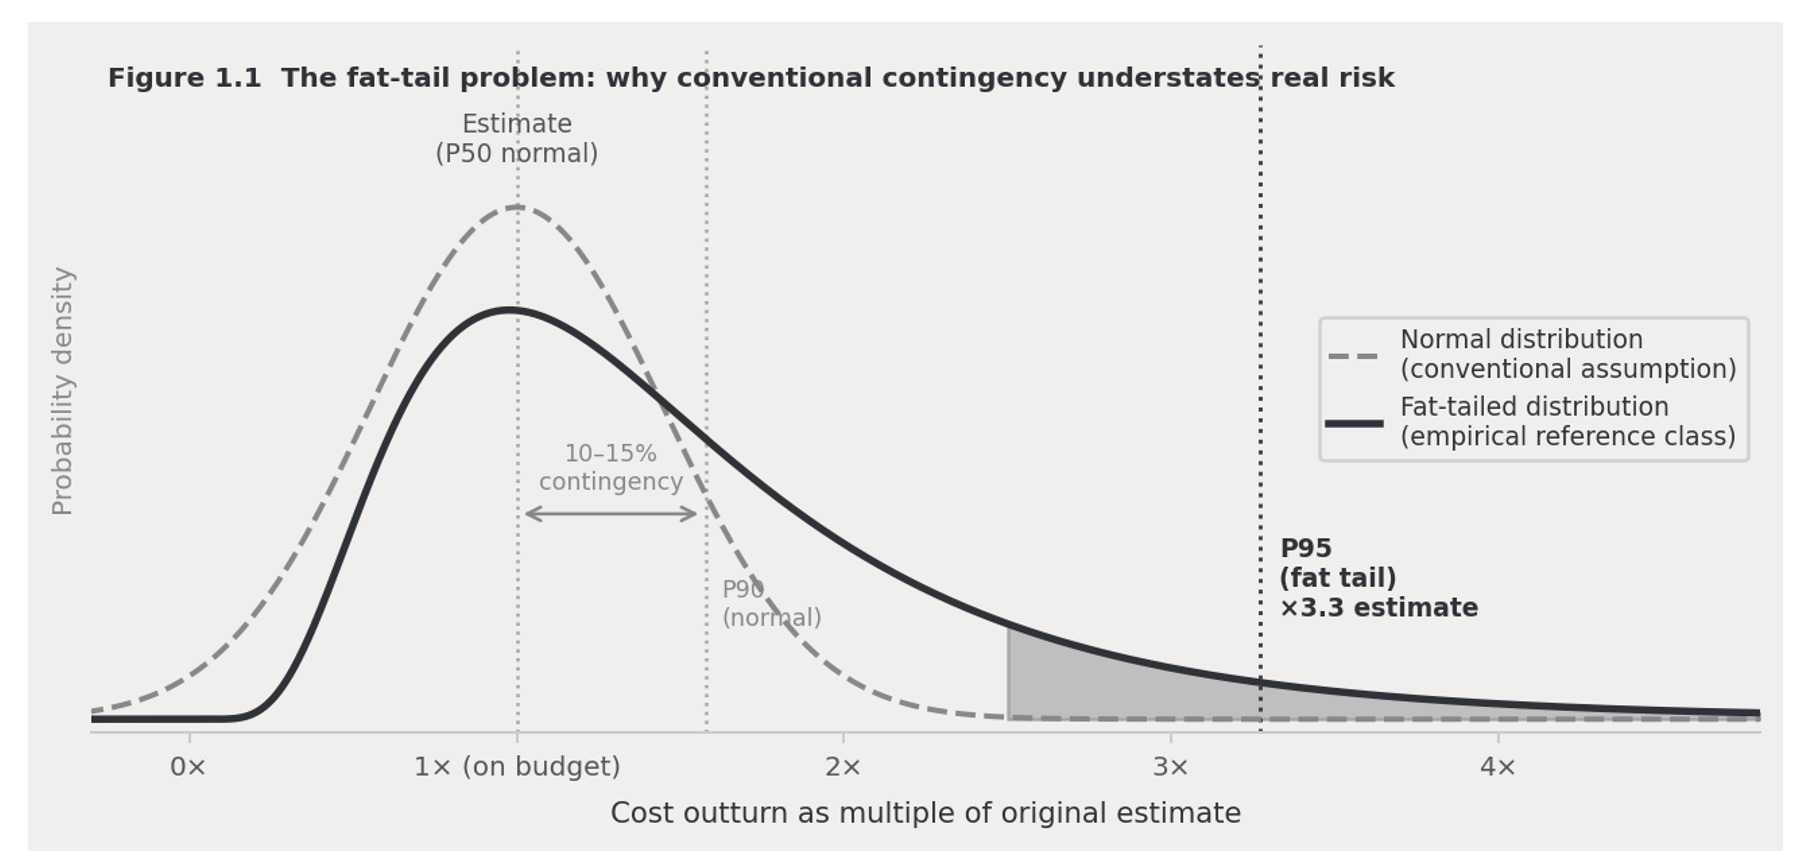
    Standard project planning assumes cost risk is spread fairly evenly around a central estimate — like a bell curve — so a reasonable contingency budget can be calculated with simple statistics. The real-world data don’t support that assumption. Big infrastructure projects almost never come in significantly under budget, but they regularly come in massively over — by two or three times the original estimate in the worst cases. Statisticians call this a fat-tailed distribution: the chance of a very bad outcome is much higher than a normal bell curve would suggest.

    Chart comparing the real-world pattern of rail megaproject cost overruns to a normal bell-curve distribution, showing a much higher chance of large overruns
    Figure 1.3. The real pattern of cost overruns on rail megaprojects (solid line) has a much bigger chance of large overruns than a normal bell curve (dashed line) would predict. A typical 10–15% contingency budget looks safe against a bell curve — but against the real-world pattern, it may only cover half of projects, or fewer. The shaded area shows the range of bad outcomes a standard contingency budget doesn’t account for.

    This matters directly for how much money a project should set aside for the unexpected. A standard 10–15% buffer looks adequate if you assume a bell curve — but against the real-world pattern, it may only protect against half of possible outcomes, or fewer. That’s why this report carries three cost figures all the way through its financial model — the number as originally specified, a corrected central estimate based on similar projects, and a worst-case scenario — instead of relying on one confident number that history suggests is likely to be wrong.

    1.6 · The Fix

    Checking the numbers against the real-world record

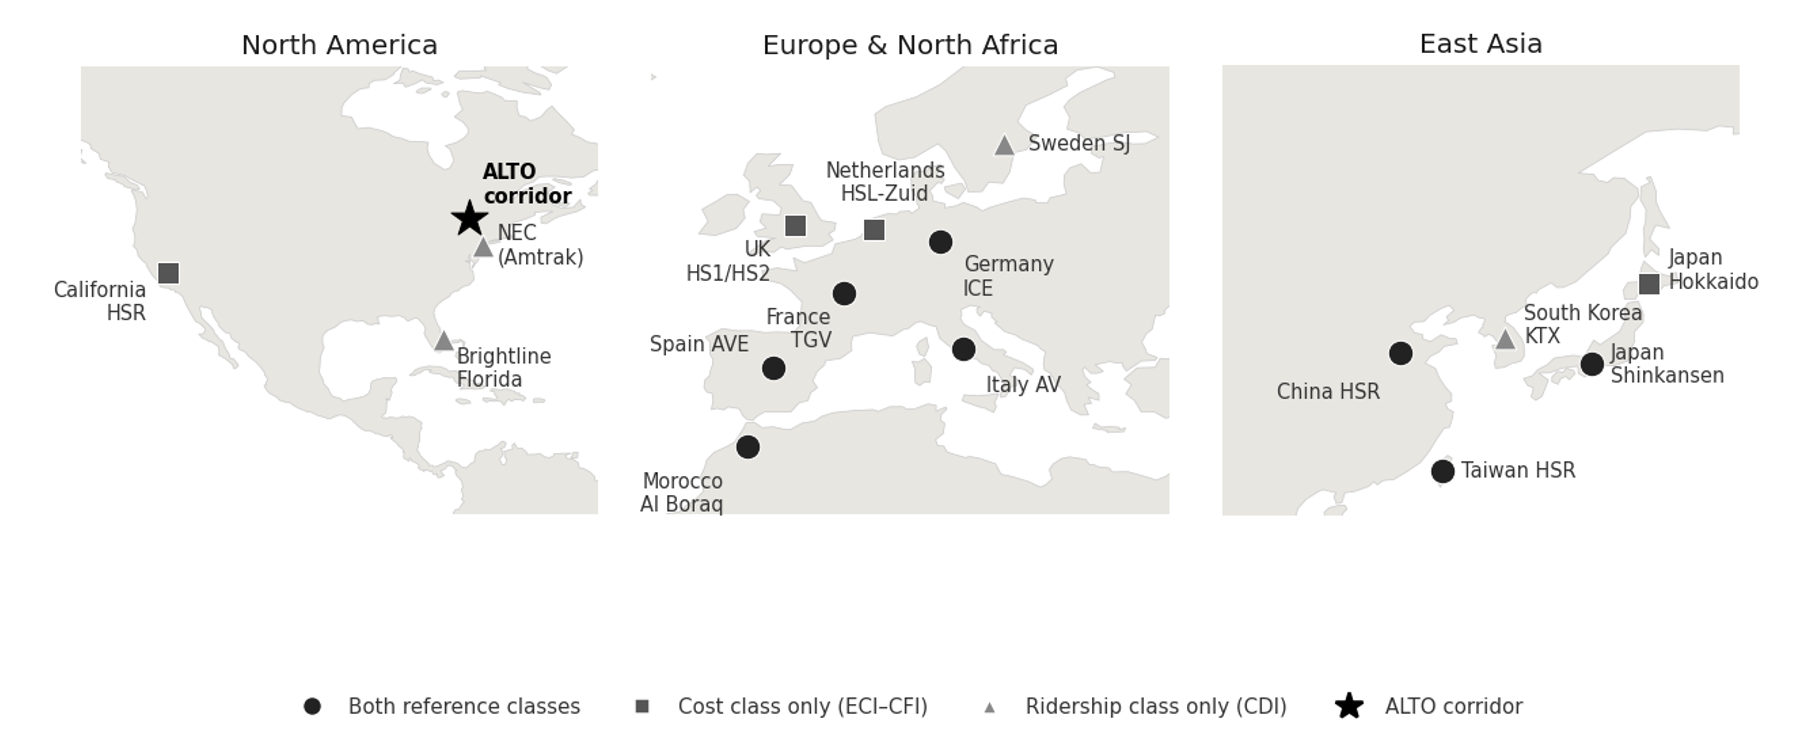
    The standard fix for both problems above is simple in principle: find a group of similar past projects; look at how their costs, benefits, and ridership actually turned out compared to what was promised; then use that real-world pattern to sanity-check the new project’s own estimate, rather than taking that estimate at face value. This flips the usual burden of proof — the real-world pattern becomes the starting assumption, and anyone predicting something better has to explain why.

    World map showing the countries whose rail systems were used for comparison in this report's cost and ridership models, spanning Europe, East Asia, North Africa, and North America, with the ALTO corridor marked for reference
    Figure 1.4. Where the comparison projects are. They span Europe, East Asia, North Africa, and North America — different countries, different governments, different planning systems. That range matters: it shows the patterns we rely on aren’t specific to any one country’s way of doing things. ALTO’s corridor is shown for reference.

    What it costs

    We compared 16 real high-speed rail projects worldwideWe looked at what actually drove the final cost per kilometre on 16 comparable projects, and found two things matter most: how difficult the engineering is, and how much local resistance and land-use friction a project runs into.
    Local resistance is the stronger driver in our modelOf the two, local and political resistance is the stronger predictor of final cost per kilometre — carrying roughly twice the weight of engineering difficulty in the fitted model.
    What this means for ALTOBased on ALTO’s engineering difficulty and level of local resistance, this points to a realistic cost of around $142 million per kilometre, with a likely range of $76–264 million per kilometre.

    How many people would ride it

    We compared 12 real high-speed rail systems worldwideWe looked at how car-dependent a region is against how many people actually use rail there.
    No car-dependent region has high ridershipNot one of the 12 systems combines heavy car dependence with high rail ridership. ALTO’s corridor scores as heavily car-dependent.
    ALTO’s target vs. the realistic estimateALTO’s own target of 24 million riders a year by 2055 is far above what any comparable region has achieved. Three independent forecasts for this corridor instead cluster around 10 million riders a year.
    The standard this report holds itself to

    A forecast that looks better than the real-world pattern isn’t more accurate — it’s less accurate. This report’s numbers are, on purpose, less flattering than what a typical project pitch would produce for the same corridor. That’s the point: this report is built to hold up under tough scrutiny, which means accepting an honest, sometimes unwelcome, comparison to how these projects actually turn out.

    1.7 · Why Now

    Canada’s changed circumstances

    The case against ALTO isn’t only about method — it’s also about timing. ALTO was approved during a period of relative calm with the US, a stable trade agreement, extra federal money after the pandemic, low interest rates, and confident population-growth predictions that made ambitious ridership numbers easier to defend. Nearly all of those conditions have since changed. Today, Canada faces US tariff pressure, pressure to diversify trade away from the US, a tighter federal budget, and a public more focused on economic resilience than on amenity projects. A passenger project of this scale — on the Initiative’s reference-class estimates, $100–200 billion — has to clear a much higher bar today than it did when it was first approved.

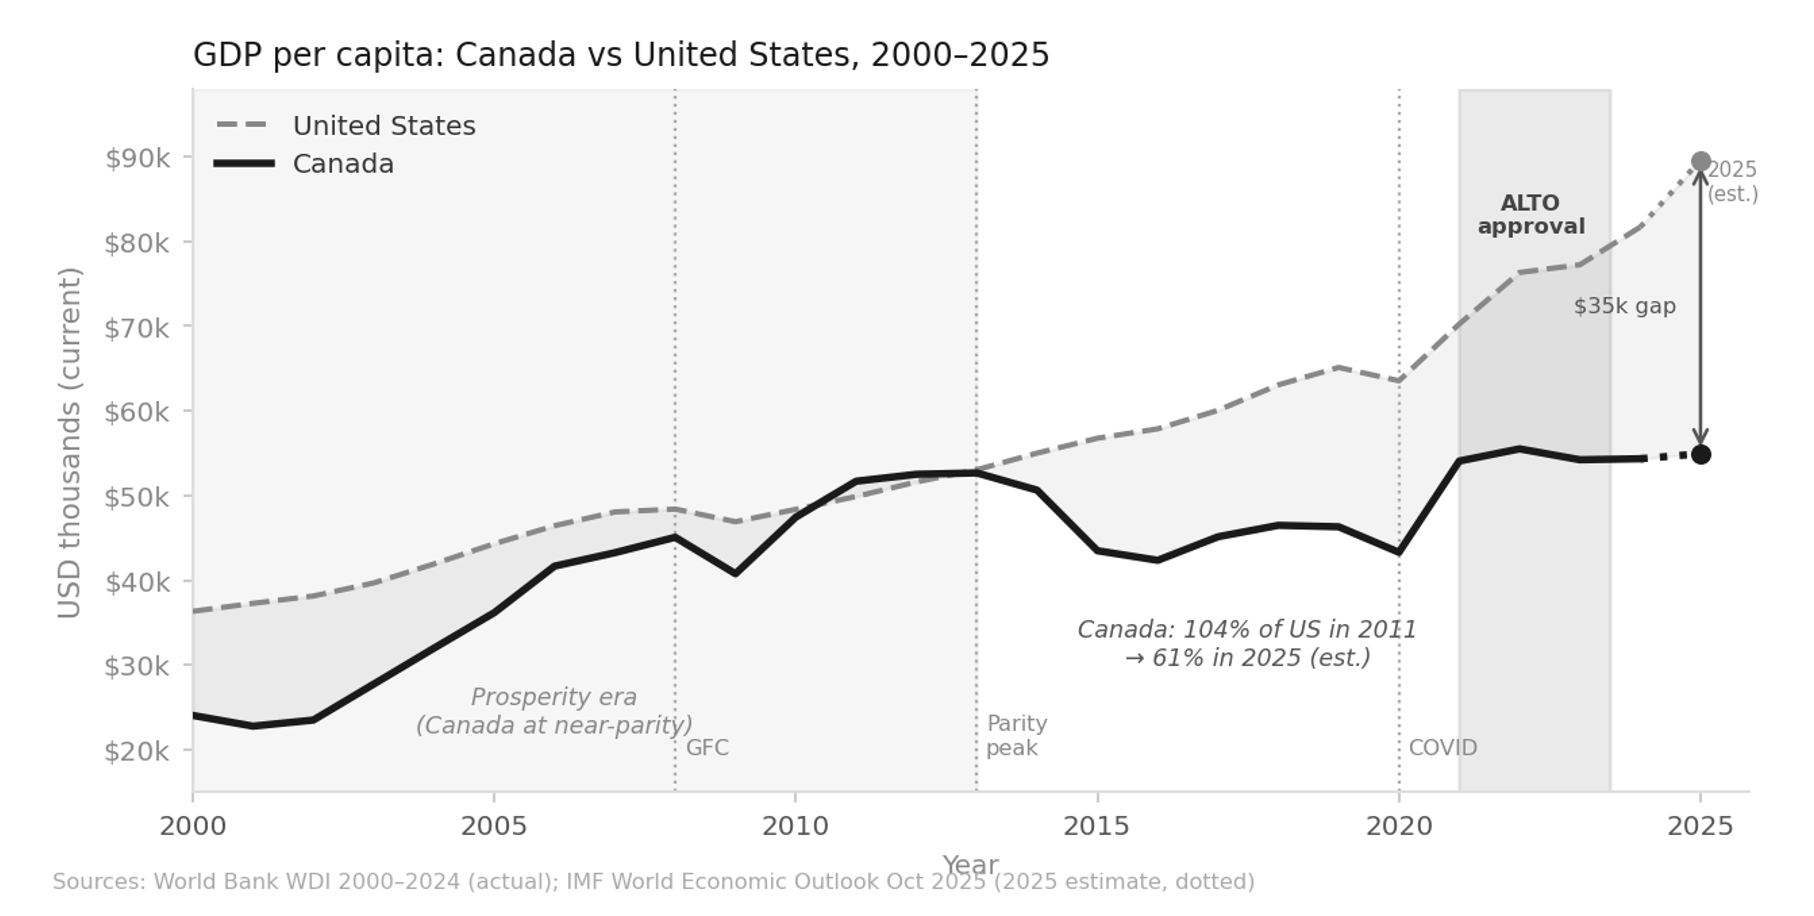
    Line chart of Canada and United States income per person from 2000 to 2025, showing Canada nearly matching the US during the 2011-2012 resource boom then falling to roughly 61 percent of US income per person by 2025
    Figure 1.5. Canada’s income per person compared to the US, 2000–2025. Canada came close to matching US income per person during the 2011–2012 resource boom, then fell steadily as oil prices dropped. By 2025, Canada’s income per person is roughly 61% of the US level — a gap of about $35,000. ALTO was approved near the peak of Canada’s post-pandemic economic rebound, in conditions that have since tightened considerably. Sources: World Bank World Development Indicators 2000–2024; IMF World Economic Outlook, October 2025.
    The question this raises

    ALTO is a project built for good economic times. The question for Canada in 2026 isn’t whether high-speed rail would be nice to have. It’s whether this corridor is worth the cost — and whether this design is the right answer to the problem.

    The high-speed rail systems that have actually succeeded — in Japan, France, Spain, Taiwan, South Korea — share things the Toronto–Ottawa–Montréal corridor doesn’t have: low car use, dense cities at both ends, strong local transit, and a rail culture that already existed before high-speed rail arrived. What’s left, globally, are second-tier projects on car-dependent corridors where the ridership case relies on optimistic in-house projections rather than real-world evidence. California’s high-speed rail project is the best-known example: years behind schedule, billions over budget, and in political trouble, for exactly these reasons. On the real-world evidence, the Toronto–Ottawa–Montréal corridor shares that second-tier profile.

    What’s Next

    What’s in the rest of this report

    This chapter sets out the method. The chapters that follow apply it — to ALTO, and to the alternative this report proposes, HPR (High-Performance Rail).

    Ch. 2
    Why the current plan doesn’t add up. Checks the case for doing something about intercity travel on this corridor — which we don’t dispute — against whether ALTO’s specific design actually makes financial sense.
    Ch. 3
    The HPR alternative. How a passenger line built along the existing Highway 401 and rail corridor can free up freight capacity at the same time, instead of building an entirely new line elsewhere and leaving the freight problem untouched.
    Ch. 4
    Route and cost. Where the line would go and what it would cost, using the same cost model applied consistently to both ALTO and HPR.
    Ch. 5
    Environment and communities. How the two options compare on carbon emissions and disruption to the communities along the route.
    Ch. 6
    How many people would ride it. Ridership estimates built on the real-world pattern from this chapter, checked four different ways.
    Ch. 7
    Running costs. The ongoing yearly balance between what it costs to operate and maintain the railway, and what fares plus any subsidy bring in.
    Ch. 8
    Is it worth it. A full cost-benefit and financial analysis across a range of scenarios, including the value of the freed-up freight capacity.
    Ch. 9
    Getting it built. How to phase construction, manage the risk of cost overruns, and keep the project accountable to the numbers in this report.
  • Reading the footnote

    Reading the Footnote

    What ALTO’s $60–90 billion cost estimate actually means — and what the AACE Class 5 label in the footnote tells the public that the headline figure does not.

    ⚠ Document Under Analysis

    On May 8, 2026, ALTO published a blog post titled How Much Will Alto’s High-Speed Rail Cost Canadians and how is it Funded?. The headline figure is $60 to $90 billion. A footnote attributes the estimate to “the Class 5 guidelines set by the Association for the Advancement of Cost Engineering International.”

    That footnote is doing the analytical work in the disclosure. This brief explains what it means and how to read it.

    Critical Finding

    The AACE Class 5 designation in the footnote is the lowest-accuracy cost estimate class in the global standard, intended for concept screening before engineering, geotechnical investigation, station design, or construction contracting have been completed. The accuracy range associated with Class 5 estimates is −50% to +100%.

    Applied honestly to ALTO’s stated $60–90 billion range, that means the realistic outturn range is approximately $30 billion to $180 billion — three to four times wider than the headline range suggests, and skewed toward the upper end.

    This is not a critique of ALTO for being uncertain about cost at the concept stage. Substantial uncertainty is appropriate at this stage. The question is whether the disclosure communicates that uncertainty in a form the public can act on.

    What “Class 5” means

    The AACE classification system

    The AACE International Cost Estimate Classification System is the global standard for describing the maturity and reliability of capital project cost estimates. It defines five classes, numbered from 5 (the least mature) to 1 (the most mature). Each class is tied to a specific stage of project definition and carries a characteristic accuracy range.

    Class 5
    the lowest-accuracy class in the system; intended for concept screening
    AACE RP 18R‑97
    0–2%
    project definition complete at Class 5
    no alignment, design, or contracts
    −50% / +100%
    typical accuracy range at Class 5
    asymmetric: upside risk twice downside
    ClassPurposeProject definitionTypical accuracy
    Class 5Concept screening0% – 2%−20% to −50% / +30% to +100%
    Class 4Feasibility study1% – 15%−15% to −30% / +20% to +50%
    Class 3Budget authorization10% – 40%−10% to −20% / +10% to +30%
    Class 2Control or bid30% – 75%−5% to −15% / +5% to +20%
    Class 1Check estimate65% – 100%−3% to −10% / +3% to +15%

    Class 5 is intended for what AACE calls “screening of viable alternatives” — deciding whether to advance a concept to further study, not committing public funds. At 0–2% project definition, there is no detailed alignment, no completed geotechnical investigation, no station design, no electrical engineering, and no signed construction contract. The estimate is built from per-kilometre parametric assumptions drawn from comparable projects, scaled for length, and adjusted judgmentally for context.

    The accuracy range is wide for a reason: the engineers preparing the estimate genuinely do not know what they will eventually be building. And the range is asymmetric. The upside risk (+30% to +100%) is roughly twice the downside risk (−20% to −50%) — reflecting more than fifty years of empirical experience that infrastructure cost estimates are more likely to be too low than too high.

    Applied to the midpoint of ALTO’s $60–90 billion range, the AACE accuracy band of −50% to +100% produces a realistic outturn range of approximately $37.5 billion to $150 billion. Applied to the upper bound of $90 billion, the upside-risk range extends to roughly $180 billion. The $60–90 billion figure is not a budget envelope; it is the centre of a much wider statistical distribution that current information cannot narrow.

    The empirical pattern

    Which side of the range to expect

    The asymmetry in the AACE accuracy ranges — more upside than downside — is not arbitrary. It reflects more than fifty years of empirical research on infrastructure megaproject cost outturns. The leading scholar in this field is Bent Flyvbjerg, professor at the University of Oxford’s Saïd Business School, who has spent more than twenty-five years compiling the largest dataset of large-project cost outturns in the world. His findings — summarized in Megaprojects and Risk (Cambridge University Press, 2003), in How Big Things Get Done (Currency, 2023), and in several decades of peer-reviewed papers — are remarkably consistent.

    Nine in ten go over

    Of every ten large infrastructure megaprojects studied, nine exceed their original cost estimate in real (inflation-adjusted) terms. The pattern is not isolated to any one country, sector, or political system; it holds across the Flyvbjerg dataset spanning more than a hundred projects and seventy years.

    Rail averages roughly 45%

    For rail projects specifically, the average cost overrun is approximately 45% in real terms. The standard deviation is large, meaning many projects overrun by considerably more than the average; a smaller number come in close to estimate.

    High-speed rail tends higher

    High-speed rail tends to overrun more than conventional rail, for two converging reasons: greater engineering complexity (tighter alignment tolerances, electrification, signalling, grade separation), and the fact that the political case for HSR often rests on ridership forecasts that subsequently prove optimistic.

    Fat tails, not bell curves

    The distribution of cost outcomes is “fat-tailed”: extreme overruns are more common than a normal distribution would predict. A small but significant fraction of large infrastructure projects overrun their original estimate by more than 100%. The mean and the median therefore tell different stories.

    Flyvbjerg’s framework is now incorporated, in various forms, into the cost-estimation guidance of HM Treasury (the UK Government’s “Optimism Bias” supplementary guidance to the Green Book), the Australian Department of Infrastructure, and a growing number of comparable institutions. The technical name for the practice is reference-class forecasting: instead of building a project cost estimate from the inside out (this is what we think it will cost, based on our project), the estimate is calibrated against the actual outturn experience of comparable past projects.

    The reference class · International HSR

    What comparable projects have cost

    International high-speed rail provides the relevant reference class for any forecast of ALTO’s eventual cost. Three large representative HSR projects in democracies with mature engineering and procurement institutions illustrate the pattern:

    ProjectInitial estimateOutcome
    California High-Speed RailUS$33 billion
    2008
    Most recent California Legislative Analyst’s Office and Authority business plan estimate for full Phase 1: ~US$128 billion. The line is not yet operating.
    HS2, United Kingdom~£33 billion
    2010, for the full Y-shaped network
    Pre-cancellation full-network estimates reached ~£100 billion or more. The northern phases were cancelled in 2023; the truncated London–Birmingham line continues, at lower total but higher per-kilometre cost.
    Channel Tunnel~£4.65 billion
    1985
    Final cost: ~£9 billion. Real overrun of roughly 80%. Among the most extensively studied infrastructure cost outturns in the academic literature.

    These are not handpicked outliers. They are large representative HSR megaprojects in democracies with mature engineering and procurement institutions. The pattern they show is consistent with Flyvbjerg’s broader dataset, and is the empirical basis for the asymmetric accuracy band in the AACE classification.

    For ALTO at $60–90 billion Class 5, a reference-class-adjusted central estimate — using the historical outturn distribution of comparable HSR projects — would place the expected outturn meaningfully above the stated upper bound. The exact figure would depend on which reference class is chosen and which adjustment factor is applied; but a defensible central estimate is well into nine figures, and the upper tail of the distribution is materially higher still.

    What is not disclosed

    What ALTO’s post does not say

    ALTO’s May 8 blog post discloses a Class 5 cost range, a brief description of the funding model, the existence of risk-sharing with the Cadence consortium, and the federal investment commitments made to date. What it does not disclose — and what would be necessary to evaluate the project on the merits — falls into four categories.

    Reference-class adjustment

    The post does not say whether the $60–90 billion range is itself a reference-class-adjusted estimate or a bottom-up Class 5 estimate prior to such adjustment. The distinction matters: if the range is bottom-up, the empirical literature would place the expected outturn substantially above the stated upper bound.

    Sensitivity analysis

    The post does not show how the estimate moves in response to specific parameters — ridership, modal shift from car and air travel, construction cost intensity, financing cost, fare-revenue assumptions. A megaproject cost discussion without sensitivity analysis cannot support an informed public judgment.

    Benefit-cost framework

    A cost figure cannot, on its own, answer whether a project is a sound public investment. The standard framework — benefit-cost ratio and net present value — requires both quantified benefits and quantified costs, evaluated against alternative uses of the same capital. ALTO’s blog post discloses neither.

    Funding model in quantified terms

    “A blended model of private capital, fare revenues, and targeted public investment, with construction and operating risks shared with Cadence” describes a structure but does not quantify any of its components. The basic question — what share of the project’s lifetime cost is borne by the taxpayer versus the fare-paying passenger versus the private partner — cannot be answered from the post as written.

    None of these omissions are unique to ALTO. They are common features of project-promoter disclosures at the concept-screening stage of capital projects. But the public interest is in having them addressed, not in having them omitted from the only published cost statement.

    A parallel pattern

    What “self-sustaining” leaves out

    The definitional-line dynamic that runs through the AACE footnote also appears in the government’s parliamentary answers about whether public subsidies will be required.

    In response to Order Paper Question Q-923, answered April 22, 2026, the Minister of Transport stated that “operations are expected to be financially self-sustaining, with revenues covering operations and maintenance costs and eliminating the need for ongoing operating subsidies.” Independent academic analysis published by Transportation Research at McGill (Zhang, Negm, El-Geneidy, 2025) — a Queen’s- and NSERC-funded study that describes HSR throughout in favourable terms — reaches the same narrow conclusion about operations using ALTO’s own published cost figures, and then continues the calculation. The McGill model projects average annual public subsidies of approximately C$1.23 billion to cover capital-repayment obligations, totalling C$61.62 billion before the system reaches full cost recovery in Year 48. The “self-sustaining” framing is technically correct for operations narrowly defined; what it leaves out is the roughly C$3.66 billion in annual capital repayments the public pays separately.

    The structural pattern is identical to the AACE footnote: a technically accurate statement at the top, a definitional line drawn in language most readers will not unpack, and the substantive public obligation kept out of the headline. A reader who acts on the headlines alone — “$60–90 billion” and “self-sustaining operations” — arrives at a picture of the public commitment materially different from the picture the underlying technical material supports.

    A third gap

    What the procurement record shows that the public materials do not

    A third instance of the same definitional pattern surfaces in the Transport Canada Request for Proposal for Financial Advisory Services for the HSR Initiative (solicitation T8080-240075), published on 20 February 2026 and closed for bids on 25 March 2026 (extended to 10 April 2026). The 121-page RFP document — including the full Statement of Work in Annex form — specifies in detail the analytical work Transport Canada is procuring to support its own role during the Co-Development Phase.

    The RFP’s Purpose statement (section 2) identifies financial advisory services as the core scope and names three specific additional fields of expertise the contract will cover: human resources change management, land value capture and transit-oriented development, and independent oversight activities. These are not optional add-ons listed at the periphery. They are named on the second page of the Statement of Work as the project’s three named non-financial expertise streams.

    The Scope section (Part A) is more specific again. Under “Land Value Capture Advisory Services” and “Transit Oriented Development and Community Benefits Advisory Services,” the RFP enumerates five deliverables Transport Canada is procuring: analysis of the economic benefits of implementing transit-oriented developments along the HSR alignment; feasibility assessment of TOD and Community Benefits Agreement options; an integrated approach and implementation plan for TOD and CBAs; advice and assessment of the potential for land value capture in proximity to HSR stations; and a proposed funding model. A separate Housing Advisory Services stream commissions analysis of options for integrating affordable housing solutions as part of the HSR Initiative, including the implementation of CBAs and TOD.

    Neither land value capture nor transit-oriented development appears in ALTO’s May 8 cost-and-funding blog post. Neither concept is named in the public-facing materials on altotrain.ca describing how the project will be funded. The funding discussion in those materials is framed in terms of taxpayer contribution and operating revenue, with no reference to a funding model that would recover a share of project cost through the uplift in adjacent land values that high-speed stations are expected to generate — even though Transport Canada has now formally procured the advisory work to design exactly such a model.

    The point is not that LVC or TOD would necessarily be inappropriate. They are conventional financing tools for major rail infrastructure and have been deployed in comparable jurisdictions. The point is that the project sponsor is procuring the design of a funding model the public-facing materials do not mention exists. The Class 5 footnote leaves the cost methodology out of the headline; the “self-sustaining” framing leaves the capital-repayment obligation out of the headline; the public funding discussion leaves LVC, TOD, housing-linked advisory work, and the funding model they imply out of the headline. Three definitional gaps, one structural pattern.

    The same RFP also commissions independent oversight advisory services as a named stream — review of existing project management processes and governance, recommendations regarding process and governance improvements, recommendations regarding project controls and key performance indicators. The companion Technical Advisory Services contract for the same Co-Development Phase (solicitation T8080-240074) was awarded to Ramboll Canada Inc. on 19 January 2026 at C$4.5 million over 36 months. Read together, the two RFPs document Transport Canada building a dedicated independent advisory bench separate from Cadence and from ALTO HSR Inc. itself, which is the kind of sponsor-side challenge function the May 2026 UK Cabinet Office review of HS2 identifies as essential and as having failed in the British case. That Transport Canada is constructing this function is institutionally appropriate. What it advises on, what it produces, and how its findings flow into ministerial decisions all remain to be seen.

    For the next cost statement

    Three questions to ask

    Class 5 estimates are not, in principle, inadequate for public communication. They are part of how megaprojects are normally discussed at the concept stage. What is inadequate is presenting a Class 5 estimate as if it were a budget envelope, and burying the methodology in a footnote. The next time a federal infrastructure project releases a cost statement — from ALTO, or from any other proponent — three questions are worth asking.

    1. What is the AACE class of the estimate, and what accuracy range does that imply when applied to the stated figure? A Class 5 figure with a −50%/+100% band tells the public something very different from a Class 3 figure with a −20%/+30% band.
    2. What reference class of comparable past projects has been used to calibrate the estimate, and what does the historical outturn distribution for that reference class suggest about the realistic outturn range?
    3. What benefit-cost analysis accompanies the cost estimate, and what does it show about whether the project is a sound use of the same capital that could otherwise fund alternatives?

    ALTO’s May 8 post answers none of these questions clearly. Whether the answers, when disclosed, support proceeding with the project on the terms now contemplated is a separate question — but the public cannot evaluate that question from the information currently available.

    Sources

    Primary documents and references

    1.
    ALTO, “How Much Will Alto’s High-Speed Rail Cost Canadians and how is it Funded?”, blog post published May 8, 2026. altotrain.ca
    2.
    AACE International, Recommended Practice 18R-97, Cost Estimate Classification System — As Applied in Engineering, Procurement, and Construction for the Process Industries; and 56R-08, … for the Building and General Construction Industries. web.aacei.org
    3.
    Bent Flyvbjerg, Nils Bruzelius and Werner Rothengatter, Megaprojects and Risk: An Anatomy of Ambition, Cambridge University Press, 2003.
    4.
    Bent Flyvbjerg and Dan Gardner, How Big Things Get Done, Currency, 2023.
    5.
    Bent Flyvbjerg, Mette K. Skamris Holm and Søren L. Buhl, “Underestimating Costs in Public Works Projects: Error or Lie?”, Journal of the American Planning Association 68(3), 2002.
    6.
    HM Treasury, Optimism Bias, supplementary guidance to the Green Book. gov.uk
    7.
    California Legislative Analyst’s Office reports on the California High-Speed Rail Authority. lao.ca.gov
    8.
    UK National Audit Office, reports on HS2 including the post-cancellation update. nao.org.uk
    9.
    Order Paper Question Q-923, 45th Parliament, 1st session. Asked by Philip Lawrence (Northumberland–Clarke), March 5, 2026; answered by the Minister of Transport and Leader of the Government in the House of Commons, April 22, 2026. ourcommons.ca
    10.
    Zhang, B., Negm, H., & El-Geneidy, A. (2025). High-Speed Rail in Canada: Insights from a corridorwide survey and a financial analysis. Transportation Research at McGill, McGill University. Funded by Queen’s University and the Natural Sciences and Engineering Research Council of Canada (NSERC).
    11.
    Transport Canada, Request for Proposal T8080-240075, Financial Advisory Services to Transport Canada for the High-Speed Rail (HSR) Initiative, published 20 February 2026, bids closed 10 April 2026. The 121-page solicitation document, including the full Statement of Work, names land value capture / transit-oriented development, human resources change management, and independent oversight as three additional fields of expertise within the contract scope, and specifies five named LVC/TOD/Community Benefits deliverables including a proposed funding model. canadabuys.canada.ca
    12.
    Transport Canada, Contract Award Notice T8080-240074, Technical Advisory Services for the Co-Development Phase of the High-Speed Rail (HSR) Initiative. Awarded to Ramboll Canada Inc. on 19 January 2026 at C$4.5 million for a 36-month term ending 31 January 2029. Competitive open bidding, highest combined rating of technical merit and price. canadabuys.canada.ca