Tag: McGill TRAM

  • Undressing the addressable market

    Technical Brief · Corridor Demand

    Undressing the Addressable Market

    Alto’s demand case, read against the corridor’s roadside counts, its current population path, and the international reference class.

    ⚠ New Finding · The 95-million figure has no published source

    Alto’s April 2026 commentary states that “ninety-five million intercity trips take place each year between the cities Alto will serve,” rising to 140 million by 2049. The figure has been repeated across government communications and press coverage since. It does not appear in Alto’s own explanatory document Fast Forward (March 2025), the Corporate Plan Summary 2024-25 to 2028-29, or the June 2026 What We Heard consultation report. No independent analyst — C.D. Howe, the Munk School, McGill TRAM — has adopted it. The denominator that anchors Alto’s modest-quarter framing is stated in a commentary without any published derivation.

    Key Finding

    95 M → ~25 M.  Alto’s 95-million-intercity-trips figure counts every trip, by every mode, over every distance, across the whole corridor. The market a high-speed line can realistically serve — the longer, station-to-station journeys where rail competes with air and car — is roughly a quarter of it, about 25 million a year; the rest is short, regional, and off-corridor travel no train could carry.

    Central independent ridership sits at 8–9 million a year, rising toward 10 at maturity — less than half of Alto’s 24-million target. The three markets a fast service actually converts (car, air, and existing rail) sum to about that level. The reference-class floor from comparable car-dependent corridors is 4–5 million. Alto’s 24-million target stands alone above every published independent forecast.

    Download
    Undressing the Addressable Market — Full Brief (PDF)
    Technical brief with methodology, tables, figures, and full source citations

    Download PDF

    The Claim

    Alto’s demand case, in its own words

    In an April 17, 2026 opinion piece published in the Toronto Star and La Presse and reproduced on altotrain.ca, Alto’s chief executive set out the demand case for the Toronto–Québec City high-speed line. Its central figures are a headline market of ninety-five million intercity trips a year across the corridor, rising to one hundred and forty million by 2049; a population of eighteen million reaching twenty-two million within fifteen years; and a target of twenty-four million annual passengers by 2055, presented as consistent with international outcomes. The piece is framed to reassure — its very title insists that high-speed rail is no leap of faith.

    This brief tests the claim on its own terms. It does not dispute that the corridor is large, that it is growing, or that its intercity system is under strain — all three are true. It disputes the inference the commentary draws from them: that a twenty-four-million forecast is therefore measured, modest, and safe.

    Read against three independent bodies of evidence — the corridor’s roadside traffic counts, the population path Statistics Canada now projects, and the international record of what comparable high-speed lines actually carry — the demand case rests on optimistic framing rather than measurement. Where the commentary offers large round numbers and a single favourable analogue, the evidence points to central ridership near a third of the headline, and to a growth story built on a population Canada has already walked back.

    What the Evidence Shows

    Six findings

    The findings rest on four independent methods, each built to be reproducible from public data: a reference class of comparable corridors, a modal-shift ridership model, a market-by-market demand build-up, and a re-basing on Statistics Canada’s current population. A fifth lens — the standard appraisal treatment of optimism bias — governs how all four are read.

    Central independent ridership is 8–9 million a year, not 24

    Rising toward 10 at maturity. The risk-adjusted floor from comparable car-dependent corridors is 4–5 million. Alto’s 24-million target sits above every published independent forecast of the corridor.

    The demand builds from three real sources, not a 95-million abstraction

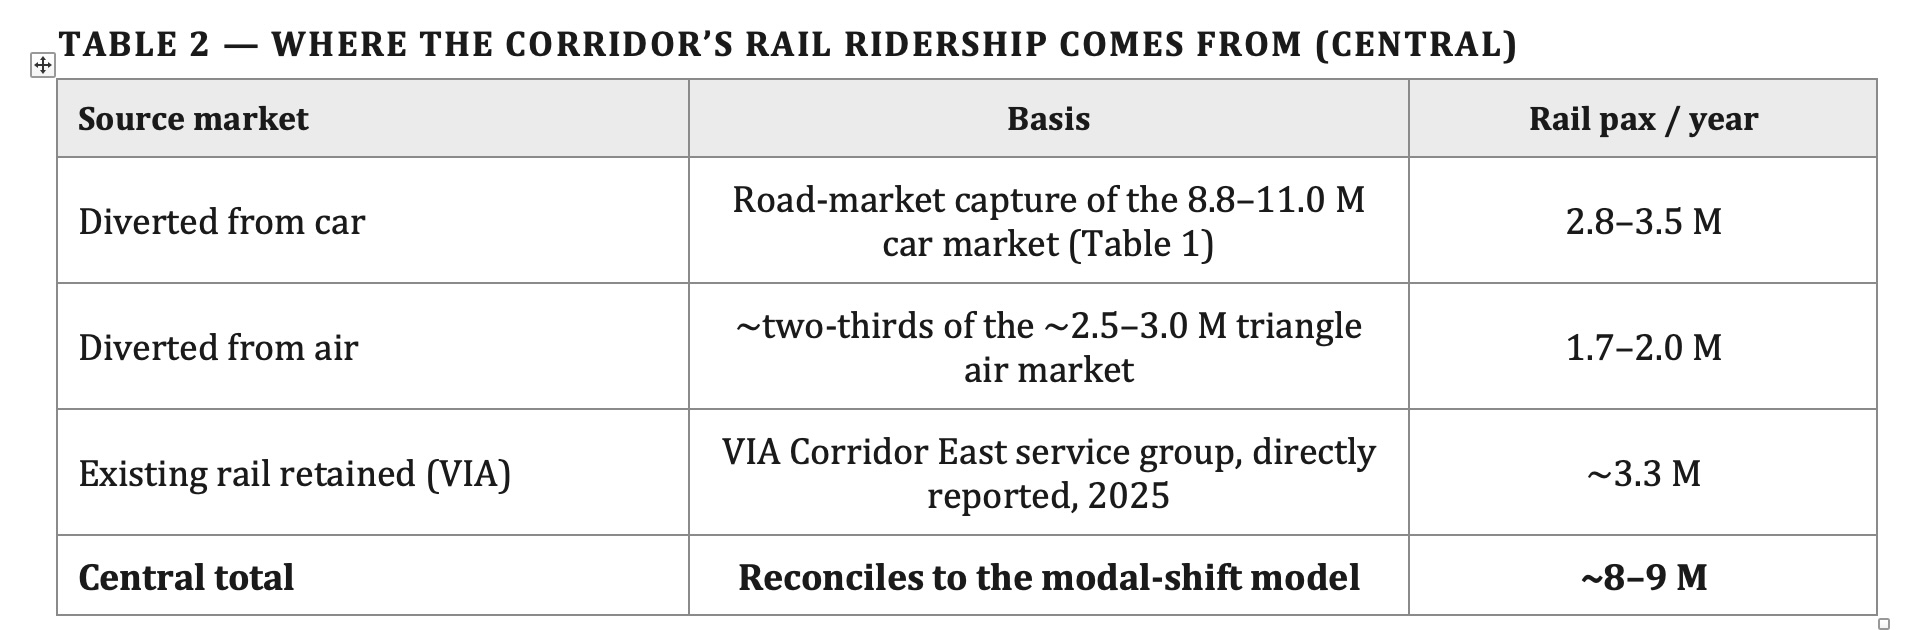
    The market a fast service actually converts is measurable: the cars crossing the corridor, the air travellers on the competitive pairs, and the existing VIA riders it retains. Added together — roughly 2.8–3.5 million from car, 1.7–2.0 million from air, and about 3.3 million retained rail (VIA’s directly reported 2025 Corridor East ridership) — they come to about 8 to 9 million. The 95-million figure is an all-modes, all-pairs total that no service captures.

    The 95-million figure itself is unsourced

    Stated in the commentary without citation, and absent from Fast Forward (March 2025), the Corporate Plan Summary 2024-25 to 2028-29, and the June 2026 What We Heard consultation report. No independent analyst has adopted it. The denominator that anchors the modest-quarter framing is not just broad but unpublished.

    The demand-growth story reverses the per-capita trend

    Ninety-five to one hundred and forty million over 2026–2049 is about 1.7 per cent a year, faster than the corridor’s own population growth. The gap implies rising travel per resident — against the grain of hybrid work and videoconferencing.

    The population base is the pre-cap one

    Twenty-two million in fifteen years extrapolates the 2015–2025 immigration surge. Statistics Canada’s January 2026 projection is lower; on the current path the corridor is about 6.3 million people smaller by 2055 than the counterfactual Alto’s numbers assume.

    The one comparator offered is a best case

    Madrid–Barcelona is among the strongest high-speed successes on record. The honest reference class — the full distribution of high-speed outcomes, many of which undershot their forecasts — brackets the answer far below 24 million.

    Method 1 · Reference Class

    What comparable corridors actually carry

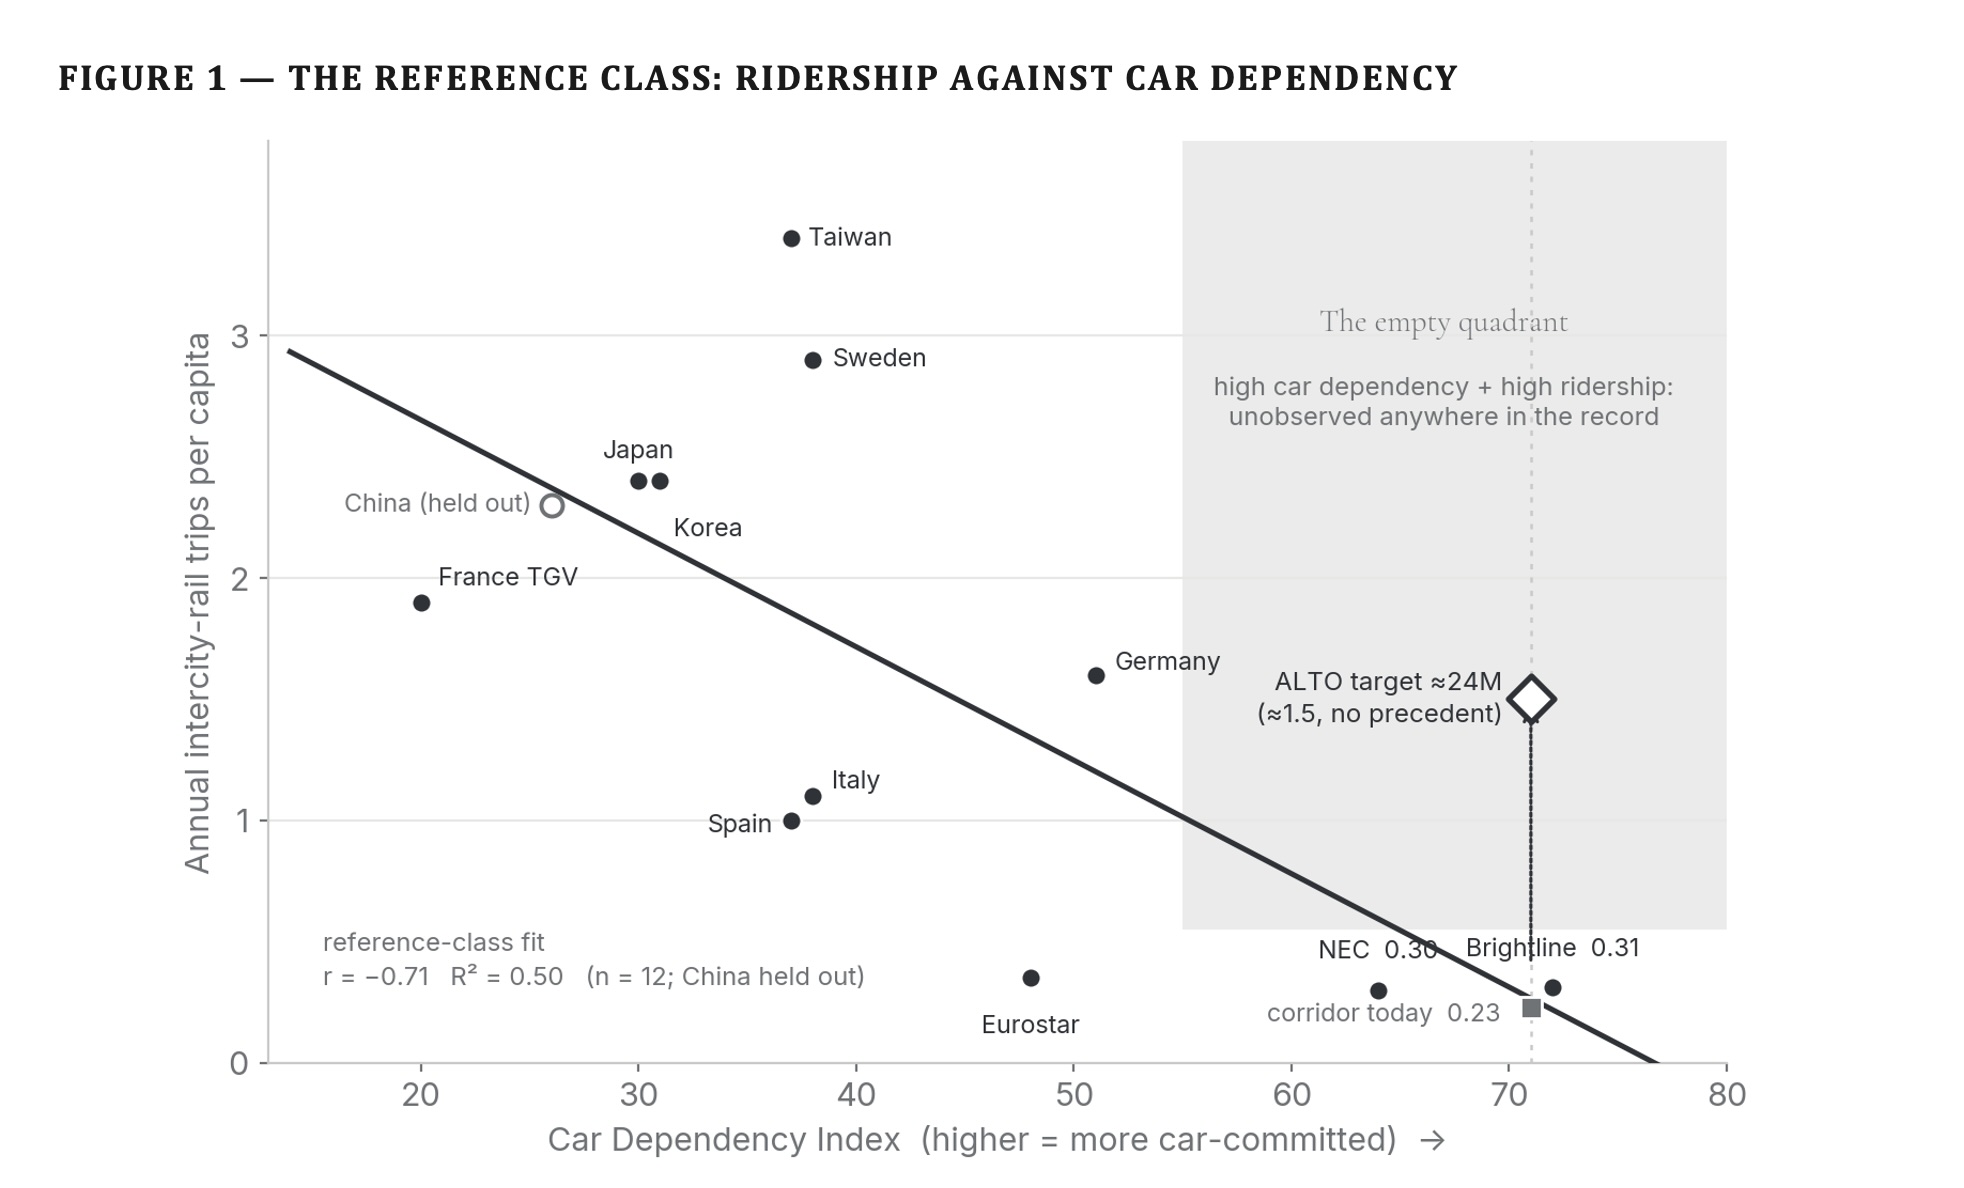
    Rather than model the corridor from assumptions, the reference-class method asks what corridors with similar car dependence, density, and trip lengths actually achieve once fast rail opens. Each candidate corridor is scored on a Car Dependency Index (CDI) — a composite of car mode share, population density, and transit provision at the endpoints. The Toronto–Québec City corridor’s high car dependence places it with reference cases that, rescaled to this line, carry the equivalent of roughly 4 to 5 million corridor trips a year at maturity. This is the risk-adjusted floor: what the evidence says the corridor is most likely to do before any speed, fare, or density assumption is layered on.

    Figure 1 — Comparable intercity-rail corridors plotted by their Car Dependency Index against annual ridership; the Toronto–Québec City corridor's high car dependence places it with reference cases carrying 4 to 5 million corridor trips a year.
    Figure 1 — The reference class: ridership against car dependency. Comparable intercity-rail corridors scored by their Car Dependency Index. The Toronto–Québec City corridor’s high car dependence places it with reference cases that, rescaled to this line, carry the equivalent of roughly 4 to 5 million corridor trips a year — the risk-adjusted floor.
    Methods 2 & 3 · The Three Markets

    Demand, counted not modelled

    A fast service on this corridor draws from three distinct current populations: the car market, the air market on the competitive city pairs, and the existing rail riders. Each is measurable from public data. Because they are distinct populations, they add without double-counting.

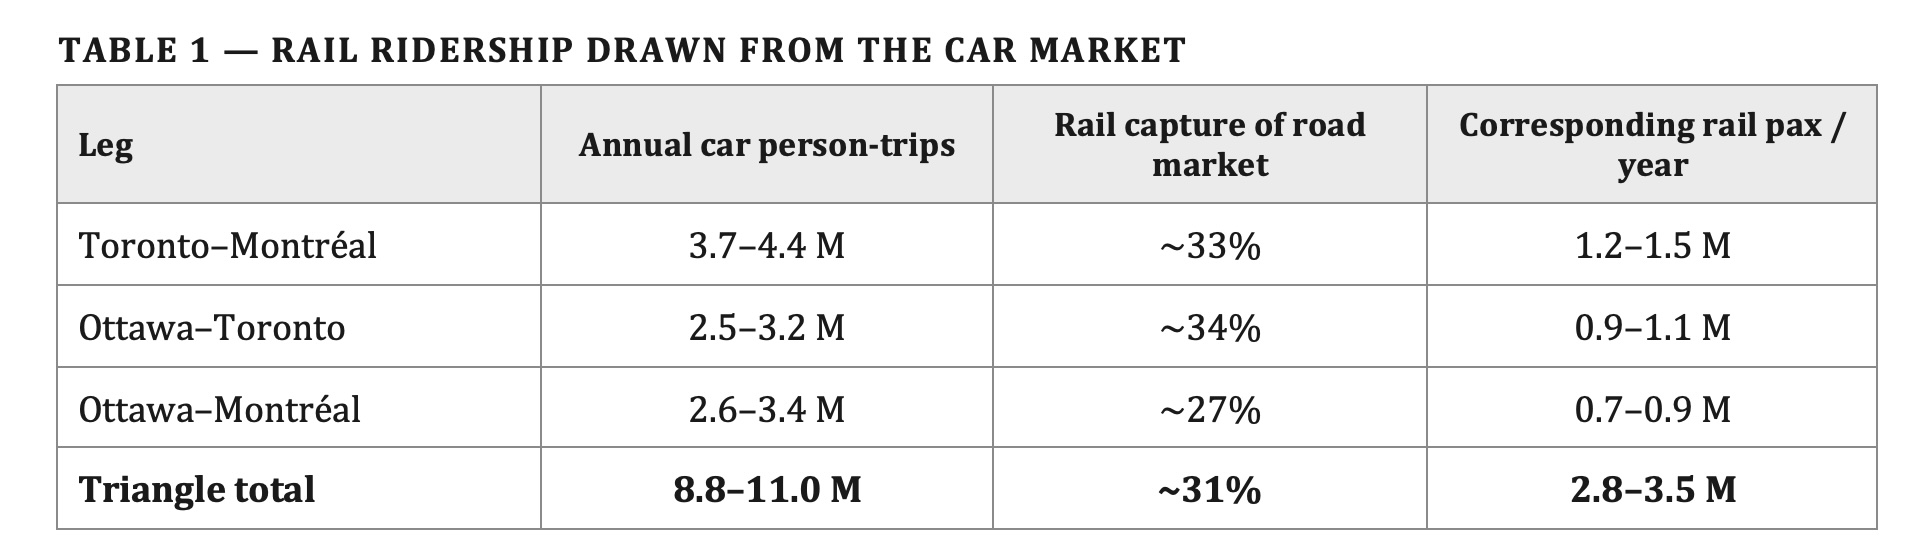
    The car market is read at the Highway 401 screenline where it crosses into Québec, after Ottawa-bound traffic has left via Highway 416 and Cornwall-local traffic has loaded, stripped of the 30 to 35 per cent commercial-truck share and short regional trips: roughly 8.8 to 11.0 million end-to-end car person-trips a year across the triangle at an occupancy of 2.0. Applying the road-market capture rates converts these into the rail ridership the car market alone would yield.

    Table 1 — Rail ridership drawn from the car market: per-leg car person-trips and rail capture rates for Toronto–Montréal, Ottawa–Toronto, and Ottawa–Montréal, summing to 2.8–3.5 million rail passengers per year from the car market.
    Table 1 — Rail ridership drawn from the car market. Capture rates are road-market shares from the modal-shift analysis at a moderate-fare regime; they express rail’s share of the combined car-and-rail market. Only Toronto–Montréal is confirmed by roadside counts; the Ottawa legs are demand-sized.

    The car market is only one of three. A fast corridor service also draws from the air travellers on the same city pairs, and it retains the passengers already riding the train. The corridor air market on the competitive pairs — Toronto–Montréal, Toronto–Ottawa, and the smaller Ottawa–Montréal — is on the order of 2.5 to 3.0 million point-to-point passengers a year, of which a fast train on these distances captures about two-thirds.

    Existing conventional rail is now reported directly in VIA’s 2025 annual results: 3.34 million passengers a year on the Corridor East service group (Québec City–Montréal–Ottawa–Toronto), within a Québec City–Windsor corridor total of 4.18 million. Essentially all of the triangle share is retained by a faster, more reliable service. VIA’s audited subsidy figures also fix the shape of the trip-length distribution: 48.51 dollars per passenger over 0.22 dollars per passenger-mile is an average trip of about 355 kilometres — roughly a third of the end-to-end corridor distance. Even the passengers already choosing rail are, on average, taking journeys well short of the full corridor.

    Table 2 — Where the corridor's rail ridership comes from: diversion from car (2.8–3.5M), diversion from air (1.7–2.0M), and existing VIA rail retained (~3.3M), summing to a central total of approximately 8–9 million rail passengers per year.
    Table 2 — Where the corridor’s rail ridership comes from (central). Car, air, and existing-rail travellers are distinct current populations, so the three sources add without double-counting. The rail line uses VIA’s Corridor East service group directly, rather than deriving a triangle share of the wider Québec City–Windsor total. The total is the central case around 2055; it rises toward 10 million at maturity as the ramp completes, and remains far below 24 million.
    Method 4 · The Population Basis

    The 6.3-million deficit

    Every ridership figure scales with the population beneath it, so the choice of population path is decisive. The brief uses Statistics Canada’s January 2026 projection (catalogue 17-20-0003), which incorporates the 2024–25 federal Immigration Levels Plan.

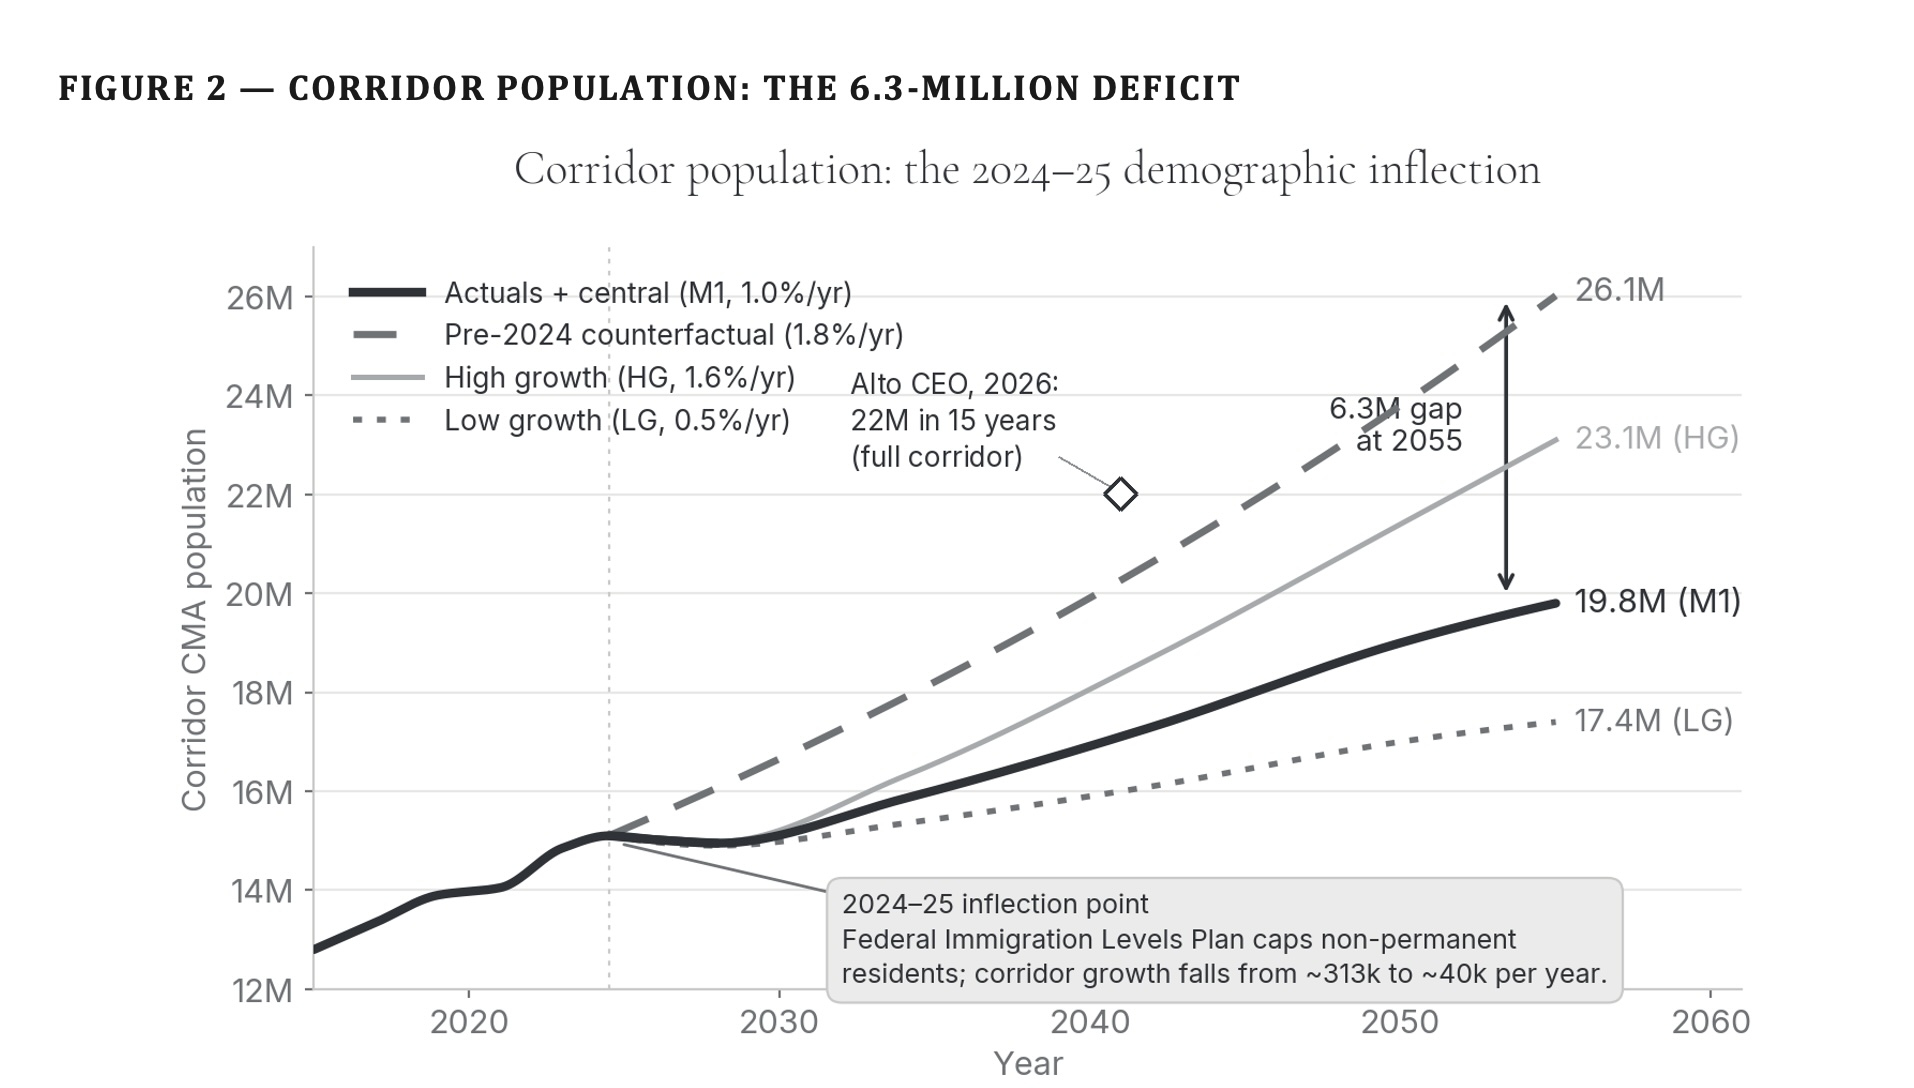
    Against the pre-2024 growth path that older corridor forecasts — and the commentary’s twenty-two-million figure — assume, this is materially lower: the corridor reaches about 19.8 million by 2055 on the current path, versus 26.1 million on the counterfactual, a deficit of 6.3 million. Because ridership scales with population, a forecast on the old path is inflated by roughly the same proportion the population has been cut — before any question of mode share or capture even arises.

    Figure 2 — Corridor population time series 2015–2060 showing four trajectories: pre-2024 counterfactual reaching 26.1M by 2055; Statistics Canada January 2026 central projection reaching 19.8M; high-growth 23.1M; low-growth 17.4M. Alto's CEO's 22M-in-fifteen-years forecast is marked as an outlier above the current path.
    Figure 2 — Corridor population: the 6.3-million deficit. The pre-2024 counterfactual (~1.8%/yr) reaches 26.1 million by 2055; Statistics Canada’s post-cap January 2026 projection (~1.0%/yr) reaches 19.8 million — a 6.3-million gap that every ridership figure scales with. The open diamond marks Alto’s own forecast of 22 million within fifteen years; its implied ~1.35%/yr growth runs above the current path.
    Triangulation

    Where Alto’s target sits against every independent forecast

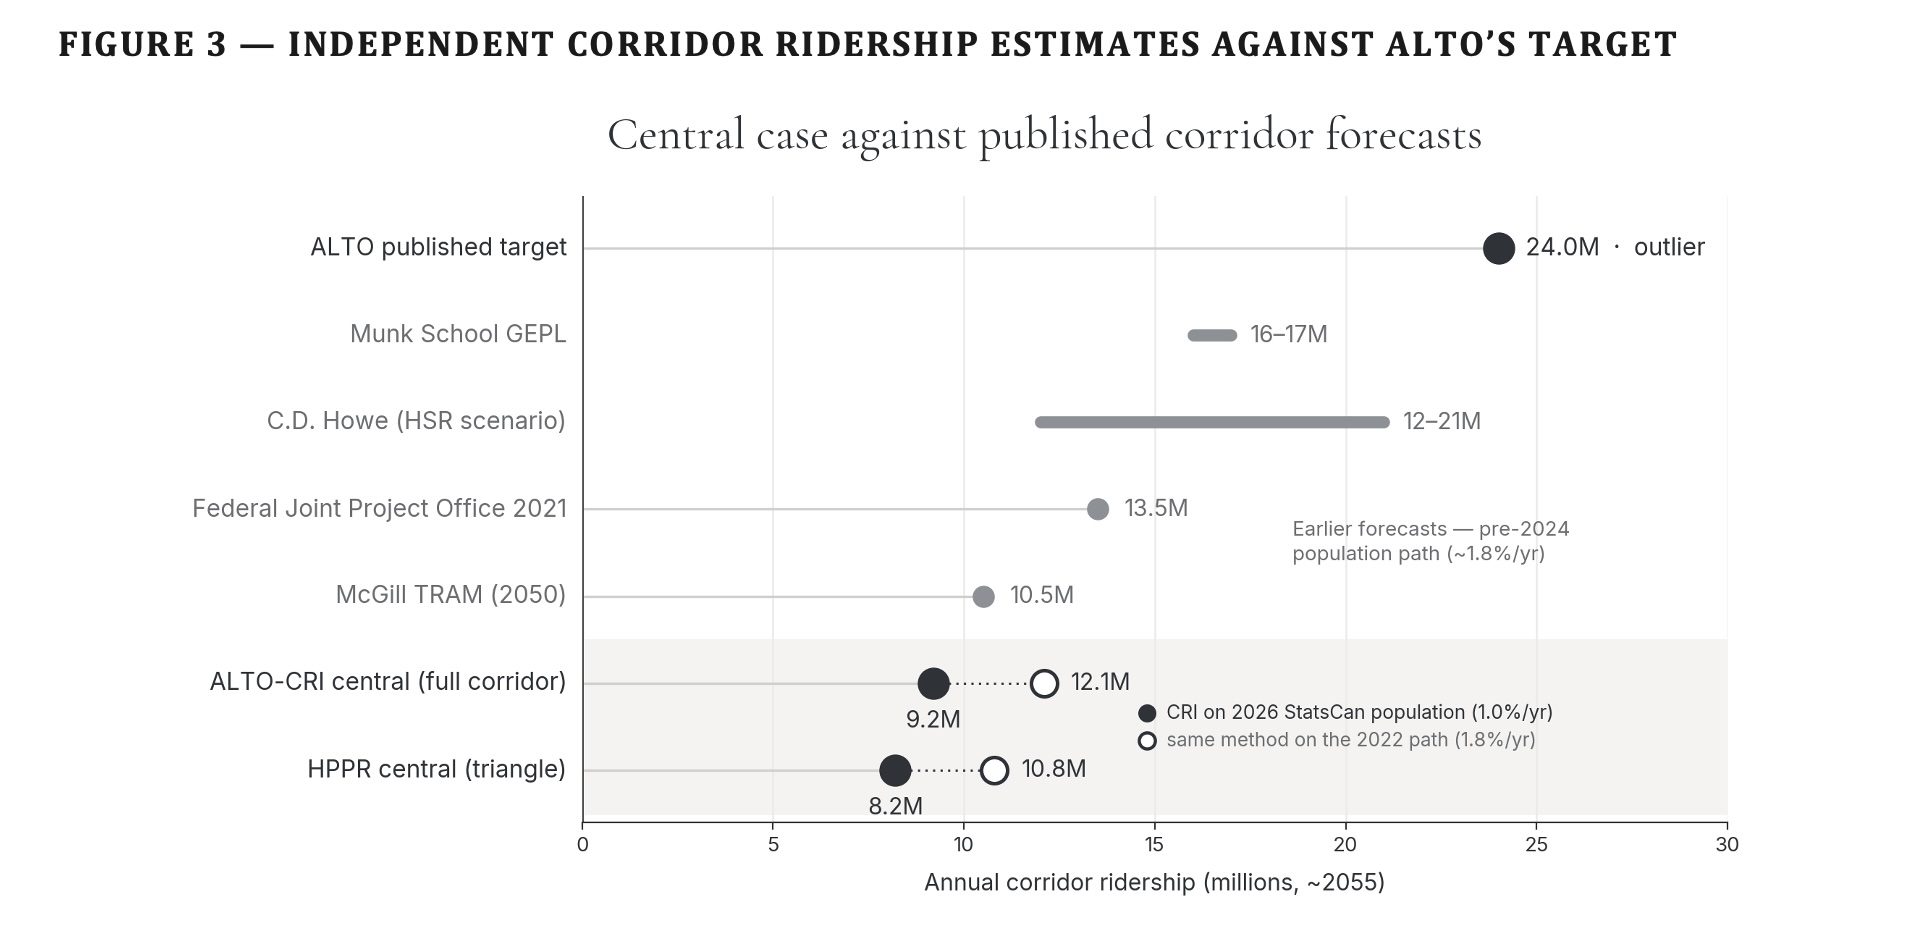
    The three methods converge. The demand-side build-up sums to about 8 to 9 million a year; the bottom-up modal-shift model lands in the same place; the reference class puts a floor near 4 to 5 million. Set beside the full band of independent corridor estimates, Alto’s 24-million target stands alone above every one.

    Figure 3 — Independent corridor ridership estimates around 2055. Alto's published target of 24.0M is shown as an outlier above every independent forecast: Munk School 16–17M, C.D. Howe 12–21M, Federal Joint Project Office 13.5M, McGill TRAM 10.5M, and the Initiative's own central case at 9.2–12.1M.
    Figure 3 — Independent corridor ridership estimates against Alto’s target. Annual corridor ridership around 2055. Alto’s 24-million target stands alone above every independent forecast — the Munk School, C.D. Howe, the Joint Project Office, and McGill — and above the Initiative’s own central case (filled markers). The open markers plot the Initiative’s method on the pre-2024 population Alto’s numbers assume; even then it stays within the published band, so the distance is population basis, not method.
    The Claim, Audited

    Where the 95-million figure appears — and where it doesn’t

    A demand denominator on which a $60–90 billion capital commitment rests should be reproducible from published sources. Alto’s is not. The ninety-five-million and one-hundred-and-forty-million figures are stated in the April 2026 commentary without citation and are absent from every canonical planning document the corporation has published.

    PresentImbleau, M., “High-speed rail is not a leap of faith: why it matters for Canada’s growth” — Op-ed, Toronto Star and La Presse, April 17, 2026; reproduced on altotrain.ca. The single document in which the 95-million and 140-million figures appear. Stated without citation, methodology, or reference to any underlying study.

    AbsentFast Forward: Shaping Canada’s Future with a High-Speed Rail Network (March 2025) — Alto’s own public-facing explanatory document. Discusses ridership growth from ~3 million (2024) to 24 million (2055) and 43 million (2084), but does not reference the 95-million intercity-trip figure or provide any market-total denominator on that scale.

    AbsentVIA HFR – VIA TGF Inc., Corporate Plan Summary 2024-25 to 2028-29 (November 2024) — the corporation’s tabled planning document referenced by the Library of Parliament backgrounder on the project. Contains ridership targets (“17 million by 2059” for HFR, before the HSR rebrand) but no 95-million total-market figure.

    AbsentJune 2026 What We Heard Report on the corridor study area — Alto’s own summary of the January–April 2026 consultation, running to more than 130 pages. Does not reference a 95-million figure.

    AbsentQuarterly Financial Reports through Q3 2025-26 — Alto’s mandatory reporting to Parliament. Does not reference a 95-million figure.

    AbsentIndependent published analyses of the corridor — the C.D. Howe Institute’s All Aboard study (March 2026), the Munk School Global Economic Policy Lab’s HSR analysis, Transportation Research at McGill’s corridor demand modelling, and Michael Schabas’s Senate submission on Bill C-15 (January 2026, 65 pp.). None uses the 95-million figure.

    The finding does not, on its own, resolve whether the 95-million figure is defensible. It resolves whether the figure is auditable. On the public record as it stands, it is not: no derivation has been published, no methodology has been described, and no independent source has adopted it.

    Recommendation

    Three things follow

    The demand case that anchors a 1,000-kilometre corridor, a $60–90 billion capital commitment, and a multi-decade delivery programme cannot responsibly rest on figures that have not been made auditable. Three steps would meet the standard.

    Release the demand model for independent audit

    A forecast that anchors an alignment and a multi-decade capital commitment cannot responsibly remain unpublished. In particular, the derivation of the ninety-five-million and one-hundred-and-forty-million intercity-trip figures cited in the April 2026 commentary should be published alongside the underlying model.

    Adjust toward the reference class and current population

    Standard megaproject appraisal requires promoter forecasts to be adjusted toward the reference class rather than accepted at face value. Alto’s should also be re-based on Statistics Canada’s January 2026 population projection, rather than the pre-2024 path the current forecast assumes.

    Size the corridor decision to the audited demand

    Not to a ninety-five-million headline or a twenty-four-million target that no independent method reaches. High-speed rail need not be a leap of faith. But the demand case as currently stated is closer to one than the corridor’s own numbers allow.

    Download Full Brief
    Undressing the Addressable Market (PDF)
    Full methodology, tables, figures, basis and limitations, and complete source citations

    Download PDF

    Sources

    Primary documents and data

    Every figure in this analysis is drawn from the public sources or companion analyses set out below and is reproducible from them. Sources are grouped by the claim or quantity they support.

    1.The claim examined. Imbleau, M., President and Chief Executive Officer of Alto. “High-speed rail is not a leap of faith: why it matters for Canada’s growth.” Commentary, altotrain.ca, April 17, 2026. altotrain.ca. The source, stated without further citation, of the ninety-five-million and one-hundred-and-forty-million intercity-trip figures, the eighteen-to-twenty-two-million population claim, and the twenty-four-million passenger target for 2055.

    2.Alto planning documents in which the 95-million figure does not appear. Alto, Fast Forward: Shaping Canada’s Future with a High-Speed Rail Network (March 2025). VIA HFR – VIA TGF Inc., Corporate Plan Summary 2024-25 – 2028-29. Alto, June 2026 What We Heard Report on the corridor study area public consultation. All at altotrain.ca.

    3.Companion research, Citizen Research Initiative. Intercity Car Trips Between Toronto, Ottawa and Montréal (2026) — road-side measurement of end-to-end car travel at the Highway 401 Québec-boundary screenline, the per-leg car person-trips of Table 1, and the road-market capture rates of Table 2. HPR Research Report — Ridership (2026) — the demand reference class and Car Dependency Index (Figure 1); the modal-shift model, R = P × μ × s × φ(t); the population basis (Figure 2) and the 6.3-million deficit; and the triangulation against independent forecasts (Figure 3). All at citizenresearch.ca.

    4.Traffic and travel-demand data. Ministry of Transportation of Ontario, Provincial Highways Traffic Volumes — annual average daily traffic on Highway 401, sections between the Highway 416 interchange and the Québec boundary. VIA Rail Canada, 2025 Annual Report (Montréal, March 2026): 4.40 million passengers system-wide and 986 million passenger-miles; 4.18 million on the Québec City–Windsor corridor and 3.34 million on the Corridor East service group; audited service-group subsidy figures implying an average Corridor East trip of about 355 kilometres. Statistics Canada, Air passenger traffic at Canadian airports (table 23-10-0253), together with airport-authority passenger statistics for Toronto Pearson, Montréal–Trudeau, and Ottawa Macdonald–Cartier. Transport Canada, Transportation in Canada annual report.

    5.Population. Statistics Canada, Population Projections for Canada, Provinces and Territories, January 2026 vintage (catalogue 17-20-0003), which incorporates the 2024–25 federal Immigration Levels Plan; and Census of Population, 2021, for the corridor’s census-metropolitan-area populations. These underpin the 19.8-million (post-cap) and 26.1-million (pre-2024 counterfactual) 2055 corridor figures and the 6.3-million deficit.

    6.Comparator corridor forecasts. Transport Canada and the EcoTrain consortium, Updated Feasibility Study of a High-Speed Rail Service in the Québec City–Windsor Corridor (2011). Federal Joint Project Office and the VIA High Frequency Rail baseline (2021). Transportation Research at McGill (TRAM), corridor demand modelling. C.D. Howe Institute (2026), high-speed-rail scenario. Munk School Global Economic Policy Lab, corridor demand. Schabas, M., Alto High-Speed Rail: Conceptual Design and Business Case, Senate submission on Bill C-15 (January 2026). These supply the independent ridership band of Figure 3.

    7.Forecasting method and optimism bias. B. Flyvbjerg, “Survival of the Unfittest: Why the Worst Infrastructure Gets Built — and What We Can Do About It” (Oxford Review of Economic Policy, 2009), and related work establishing reference-class forecasting; B. Flyvbjerg and D. Gardner, How Big Things Get Done (2023). HM Treasury (United Kingdom), The Green Book and its supplementary guidance on optimism bias. Oxford Global Projects, reference-class forecasting datasets and practice. UK National Audit Office, successive reports on High Speed 2 (HS2) documenting systematic optimism in demand forecasts and cost escalation.

    ALTO HSR Citizen Research Initiative  ·  citizenresearch.ca  ·  Corridor Demand Brief  ·  July 2026
    Independent, non-partisan research on the proposed Toronto–Québec City high-speed rail corridor.
  • Land Value Capture

    The $12 Billion That Isn’t There

    What the land value capture line in the McGill TRAM financial model actually rests on — and why a number doing the heaviest lifting in ALTO’s only public financial model is a planning placeholder, not a financing prospect.

    ⚠ What This Brief Examines

    The McGill TRAM financial model assumes that land value capture — the public capture of property-value uplift around new stations — will contribute $12 billion toward ALTO’s capital cost, reducing the amount that must be borrowed from roughly $53 billion to $41.23 billion.

    This brief traces that figure to its origin, tests it against the international precedents the model invokes, against the realised Canadian record, against the legal authorities ALTO actually holds, and against the timing of when capture revenue could plausibly arrive. On every test, the $12 billion comes apart.

    Headline Finding

    The $12 billion land value capture line is reverse-engineered from a 15-percent rule of thumb, not built from any property analysis. It contains no parcel-level valuation, no station-area market study, no comparable transactions, and no discounted cash flow.

    A defensible figure for the present value of plausible station-area capture is in the low single billions — well under 5 percent of capital cost — and it accrues over decades rather than during the construction window when borrowing must actually be priced. The line is the difference between a model that reads as “tolerable on paper” and one that reads as “permanently subsidised.”

    Download
    Land Value Capture — Assessing the $12 Billion Claim (PDF)
    Full research note for federal decision-makers, parliamentarians, journalists, and residents along the corridor
    Download Note
    Section 1 · Origin of the Figure

    A percentage, not a forecast

    The $12 billion originates in the McGill TRAM financial analysis, where it is described as land and real estate development gains “equivalent to roughly 15 percent of the total cost.” Fifteen percent of the assumed $79.8 billion capital cost is $12 billion. The ratio is asserted; the dollar figure follows arithmetically.

    That is the whole of its derivation. The report contains no parcel-level valuation, no station-area market analysis, no comparable transaction work, no discounted cash flow of expected development revenues, and no sensitivity analysis. Change the cost assumption and the “capture” number moves with it — without any change to the underlying property economics, because there are no underlying property economics in the figure to begin with.

    The line is also structurally load-bearing. Remove it and the borrowed principal rises from $41.23 billion to roughly $53 billion. At the model’s own 8 percent rate over 50 years, that adds about $1.05 billion a year in debt service. The companion brief concedes the consequence directly: its “No LVC” scenario requires average annual subsidies of $2.12 billion and never reaches self-sufficiency by Year 50.

    15%
    Rule-of-thumb ratio applied to capital cost — the figure’s entire basis
    $12B
    The resulting line — with no property analysis behind it
    $53B
    Borrowed principal without the line, up from $41.23B
    Section 2 · The Precedents

    The international examples do not transfer

    The TRAM brief grounds its capture case on three precedents — Hong Kong’s West Kowloon, an Australian East Coast HSR pre-feasibility study, and California’s High-Speed Rail. None is institutionally analogous to the ALTO corridor.

    Hong Kong West Kowloon

    The only case with realised capture at scale: a single super-prime tower site sold for HK$42.2 billion. But Hong Kong’s land is overwhelmingly state-owned under a colonial leasehold system, and the government grants development rights as a primary fiscal instrument. It bears no resemblance to Peterborough, Trois-Rivières, Laval, or even Ottawa-Gatineau.

    Australia East Coast HSR

    The cited evidence is a 2022 preliminary investigation with a near three-fold range ($43–126 billion), for a project that remains unbuilt. Citing an aspirational range from an unconstructed project as proof that ALTO can capture $12 billion is circular reasoning.

    California HSR

    Cited for proposed tax-increment financing concepts. After fifteen-plus years and over $13 billion of spending, California HSR has captured essentially zero, while costs escalated from $33 billion to over $128 billion. It is a cautionary precedent, not a supporting one.

    Two precedents the brief omits are more directly relevant. The UK’s HS2 explicitly considered capture and recovered a negligible fraction of capital cost — property values along the route fell on construction blight, and the government spent more on compensation than it recouped. Brightline in Florida, the closest North-American analogue with vertically integrated real-estate interests, is in distress on its Private Activity Bonds despite favourable conditions: no winter operations, sustained population growth, and no expropriation politics.

    The most relevant evidence is Canadian — and it comes from a source the federal government itself supports. A 2023 study by the University of Toronto’s Infrastructure Institute, prepared for and supported by the Canada Infrastructure Bank, surveyed the realised Canadian record:

    • Per-deal ceiling: realised Canadian capture deals — joint development and surplus land sales — have typically raised $30 million to $110 million, with only the largest sales in the most expensive markets exceeding that band.
    • Corridor analogue: Montréal’s REM, the closest comparable, raised a $512 million station-area contribution — covering just 7.4 percent of the project’s $6.9 billion cost, itself well below a 2014 estimate of up to 35 percent.
    • Single station: Vancouver’s Capstan Station, described as having near-ideal conditions for capture, raised only $32 million over nine years.
    • The Hong Kong verdict: the same CIB-supported study attributes West Kowloon’s success to a combination of factors unique to Hong Kong, and concludes the model is fundamentally different from most capture models.

    A CIB-supported source thus reaches the same conclusion this note does: the marquee precedent does not transfer, and realised Canadian capture operates two to three orders of magnitude below the $12 billion line.

    Section 3 · Canadian Institutional Constraints

    The authorities required do not exist

    Capture at the scale TRAM assumes requires legal authorities ALTO does not have and that no level of government has proposed. Property and land use are provincial jurisdiction. Municipal zoning, development charges, and the property tax base lie outside federal control. There is no Canadian equivalent of U.S. tax-increment financing as a station-area capture tool, and Ontario’s closest analogue — Section 37 / community benefits charges — generates modest, parcel-by-parcel sums and has been further constrained by recent provincial reform.

    A structural obstacle compounds the jurisdictional one. The same CIB-supported study identifies fragmented land ownership as a core constraint: unlike Hong Kong’s state leasehold system, prime station-adjacent land in Canada is held by many separate owners. ALTO’s catchments — especially built-out central areas like Toronto Union and Montréal Central — are precisely this kind of fragmented holding, where capturing uplift at scale would first require slow, costly, politically fraught land assembly.

    The brief’s recommendation that government “empower Alto to lead development and value capture within 2 km around the stations” implies development authority over roughly 88 km² of station catchment — about 12.6 km² around each of seven stations. No mechanism in Bill C-15, the Cadence consortium structure, or any published ALTO document contemplates this. The Bill C-15 expropriation provisions are scoped to the right-of-way, not to station catchments; acquiring 88 km² would be a separate expropriation programme of significant scale, with compensation costs the model never nets against the $12 billion gross.

    On the procurement record

    Housing and TOD intent does exist in the procurement. A federal housing and TOD presentation to bidders — released under access to information — sets out a four-pillar housing strategy and contemplates that Canada would acquire project lands and explore station-hub development with the developer partner. That intent carried forward into the ALTO procurement, which required a high-speed rail proposal from all bidders.

    But the presentation is explicitly provisional throughout: “provisional guidelines,” requirements “to be refined,” an affordable-housing threshold “to be determined.” It attaches no budget, no land-assembly cost, no carrying-cost provision, and no capture-revenue target — and it describes a federal-acquisition-then-explore model that is the opposite of ALTO-led capture across catchments. The procurement confirms an intention to pursue TOD; it does not supply the costed mechanism on which the $12 billion depends.

    Section 4 · Station-Level Realism Check

    Even a generous bottom-up envelope falls short

    The TRAM model is corridor-wide and does not allocate the $12 billion to specific stations. Spread across the seven announced stations, it implies an average of roughly $1.7 billion per station. A station-by-station review of catchment characteristics shows how implausible that is — most of the corridor’s stations serve small markets or are already built out, so most uplift would accrue to existing landowners rather than to a public capture programme.

    Already built out

    Toronto:$1.0–2.0B — incremental only

    Montréal:$1.0–2.0B — incremental only

    Note:Most uplift to existing owners

    Small / thin markets

    Ptbrgh:$0.1–0.3B — CMA ~90k

    T-Rivières:$0.1–0.3B — CMA ~85k

    Québec:$0.3–0.8B — heritage limits

    Suburban / uncertain

    Ottawa:$0.5–1.5B — core receding

    Laval:$0.3–0.8B — greenfield TOD

    Total:$3.3–7.7B gross envelope

    Summed, a generous corridor-wide envelope — gross, undiscounted, spread over 20–30 years — reaches $3.3 to $7.7 billion. Even its upper bound falls short of the $12 billion the model requires. And that envelope still assumes full institutional empowerment of ALTO as a development corporation, which is not on the table, while ignoring both the carrying cost of land assembly and the compensation cost of catchment-area expropriation.

    Section 5 · The Timing Mismatch

    Most of the value, in present terms, is fictional

    The model treats $12 billion as available during construction, to reduce the principal borrowed. In practice, capture accrues over decades. Land sales and development gains around new stations typically materialise five to fifteen years after a station opens, and construction on the full corridor is projected to take well over a decade. A realistic capture stream would produce most of its value between roughly 2040 and 2060 — long after the borrowing is priced.

    Discounted at the model’s own 8 percent rate, $12 billion realised over Years 15–35 has a present value of only about $3 to $4 billion at financial close. That is the figure that can actually reduce the borrowing requirement. The remaining $8 to $9 billion in the arithmetic is, in present-value terms, fictional — and the construction debt still has to be priced against the full undiscounted principal.

    $12B
    Gross, undiscounted — as the model treats it
    $3–4B
    Present value at financial close, at the model’s own 8% rate
    $8–9B
    The remainder — fictional in present-value terms
    Section 6 · Why It Matters

    One line, three improvements, all of them collapse

    The $12 billion capture line is the single most important — and least scrutinised — financing assumption in the only publicly available financial model for ALTO. It does three things at once, and all three depend on the same unsupported number.

    1

    It cuts the borrowed capital

    From roughly $53 billion to $41 billion — the difference being the $12 billion the model assumes capture will supply.

    2

    It pulls self-sufficiency forward

    From “never” to Year 48. Without the capture line, the companion brief’s own “No LVC” scenario never reaches self-sufficiency by Year 50.

    3

    It lowers the annual subsidy

    From $2.12 billion to $1.23 billion a year on average — the gap between “tolerable on paper” and “permanently subsidised.”

    Professor El-Geneidy has said publicly that the model uses “very generous” assumptions, particularly on demand, and that breakeven “can happen … but it requires a lot of work from the government to make it happen.” The capture assumption falls into the same category. Even on its own optimistic terms, the model shows cumulative subsidies of $61.6 billion through Year 50, on top of the initial $26.6 billion federal investment — a combined taxpayer exposure of $88.2 billion before any recovery from project revenues.

    Where Things Stand

    A placeholder, not a pillar

    The $12 billion figure should be treated as a planning placeholder rather than a financing prospect. Any business case, public communication, or appraisal that relies on it as a stable revenue pillar is overstating ALTO’s financial position by an order of magnitude — at the present-value point that matters most, the moment construction debt is priced. The defensible number is in the low single billions, it arrives over decades, and it cannot be borrowed against today.

    Download Full Note
    Land Value Capture — Assessing the $12 Billion Claim (PDF)
    Reference note for federal decision-makers, parliamentarians, journalists, and residents along the corridor
    Download Note
    Sources

    References

    1.
    Zhang, B., Negm, H., & El-Geneidy, A. (2025). High-Speed Rail in Canada: Insights from a corridor-wide survey and a financial analysis. Transportation Research at McGill, McGill University. Updated January 2026. Source of the $79.8 billion capital cost, the 15-percent capture ratio, and the $41.23 billion borrowed-principal figure.
    2.
    El-Geneidy, A., et al. (December 2025). Importance of Land Value Capture regarding the Canada High-Speed Rail. Transportation Research at McGill, McGill University. Source of the “No LVC” scenario and the $2.12 billion average annual subsidy.
    3.
    Pettit, C., Thackway, W., & Wade, R. (2022). High Speed Rail Value Uplift Preliminary Investigation Report. City Futures Research Centre, UNSW Sydney. The Australian East Coast HSR pre-feasibility range.
    4.
    On the UK case see HM Treasury, Oakervee Review of HS2 (2020); on Brightline see filings under SEC EDGAR for Brightline Holdings LLC and reporting in Bond Buyer through 2025–2026.
    5.
    Siemiatycki, M., Fagan, D., & Arku, R. N. (April 2023). Land Value Capture Study: Paying for Transit-Oriented Communities. Infrastructure Institute, School of Cities, University of Toronto. Supported by the Canada Infrastructure Bank. Source of the $30–110 million per-deal range, the REM 7.4-percent figure, the Capstan Station case, and the fragmented-ownership finding.
    6.
    Infrastructure Canada (April 10, 2024). Housing and Transit-Oriented Development (TOD) — High Frequency Rail (HFR) Project, Subject-Specific Meeting #4B. Government of Canada. Released under the Access to Information Act, file A-2025-00223.
    7.
    El-Geneidy quoted in Canadian Affairs, “The high cost of high-speed rail” (January 9, 2026; corrected February 27, 2026).