Undressing the Addressable Market
Alto’s demand case, read against the corridor’s roadside counts, its current population path, and the international reference class.
Alto’s April 2026 commentary states that “ninety-five million intercity trips take place each year between the cities Alto will serve,” rising to 140 million by 2049. The figure has been repeated across government communications and press coverage since. It does not appear in Alto’s own explanatory document Fast Forward (March 2025), the Corporate Plan Summary 2024-25 to 2028-29, or the June 2026 What We Heard consultation report. No independent analyst — C.D. Howe, the Munk School, McGill TRAM — has adopted it. The denominator that anchors Alto’s modest-quarter framing is stated in a commentary without any published derivation.
95 M → ~25 M. Alto’s 95-million-intercity-trips figure counts every trip, by every mode, over every distance, across the whole corridor. The market a high-speed line can realistically serve — the longer, station-to-station journeys where rail competes with air and car — is roughly a quarter of it, about 25 million a year; the rest is short, regional, and off-corridor travel no train could carry.
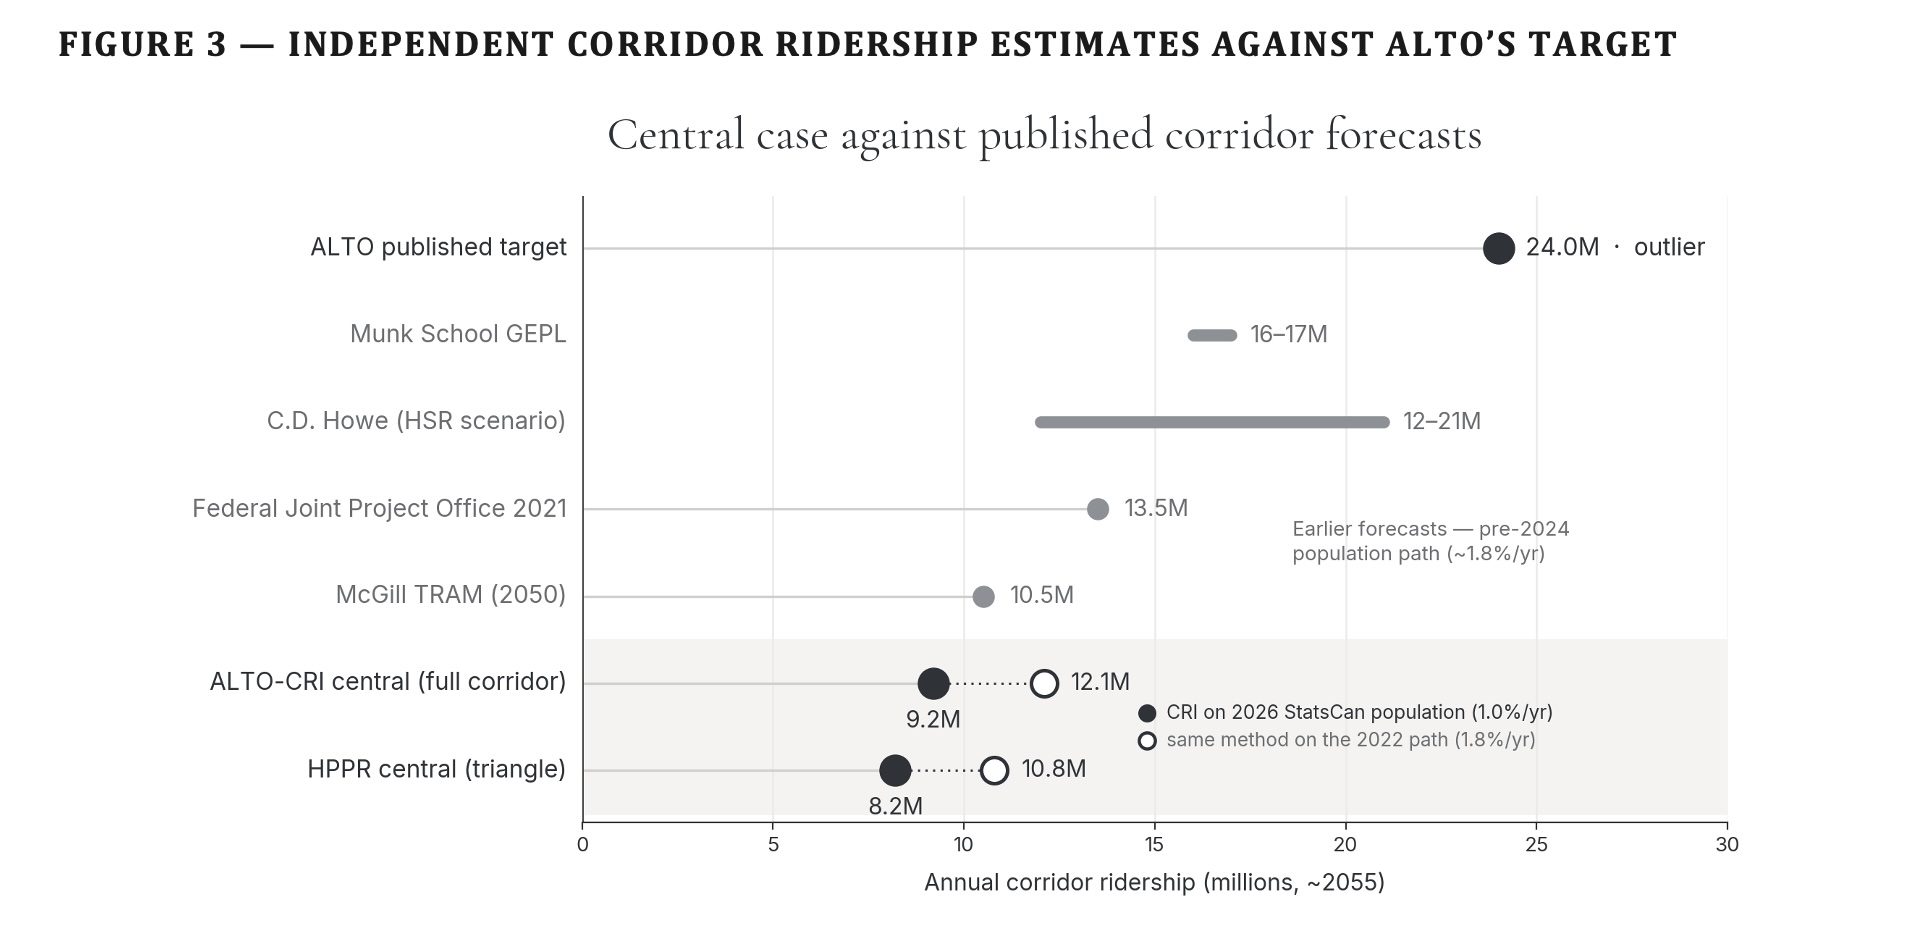
Central independent ridership sits at 8–9 million a year, rising toward 10 at maturity — less than half of Alto’s 24-million target. The three markets a fast service actually converts (car, air, and existing rail) sum to about that level. The reference-class floor from comparable car-dependent corridors is 4–5 million. Alto’s 24-million target stands alone above every published independent forecast.
Alto’s demand case, in its own words
In an April 17, 2026 opinion piece published in the Toronto Star and La Presse and reproduced on altotrain.ca, Alto’s chief executive set out the demand case for the Toronto–Québec City high-speed line. Its central figures are a headline market of ninety-five million intercity trips a year across the corridor, rising to one hundred and forty million by 2049; a population of eighteen million reaching twenty-two million within fifteen years; and a target of twenty-four million annual passengers by 2055, presented as consistent with international outcomes. The piece is framed to reassure — its very title insists that high-speed rail is no leap of faith.
This brief tests the claim on its own terms. It does not dispute that the corridor is large, that it is growing, or that its intercity system is under strain — all three are true. It disputes the inference the commentary draws from them: that a twenty-four-million forecast is therefore measured, modest, and safe.
Read against three independent bodies of evidence — the corridor’s roadside traffic counts, the population path Statistics Canada now projects, and the international record of what comparable high-speed lines actually carry — the demand case rests on optimistic framing rather than measurement. Where the commentary offers large round numbers and a single favourable analogue, the evidence points to central ridership near a third of the headline, and to a growth story built on a population Canada has already walked back.
Six findings
The findings rest on four independent methods, each built to be reproducible from public data: a reference class of comparable corridors, a modal-shift ridership model, a market-by-market demand build-up, and a re-basing on Statistics Canada’s current population. A fifth lens — the standard appraisal treatment of optimism bias — governs how all four are read.
Central independent ridership is 8–9 million a year, not 24
Rising toward 10 at maturity. The risk-adjusted floor from comparable car-dependent corridors is 4–5 million. Alto’s 24-million target sits above every published independent forecast of the corridor.
The demand builds from three real sources, not a 95-million abstraction
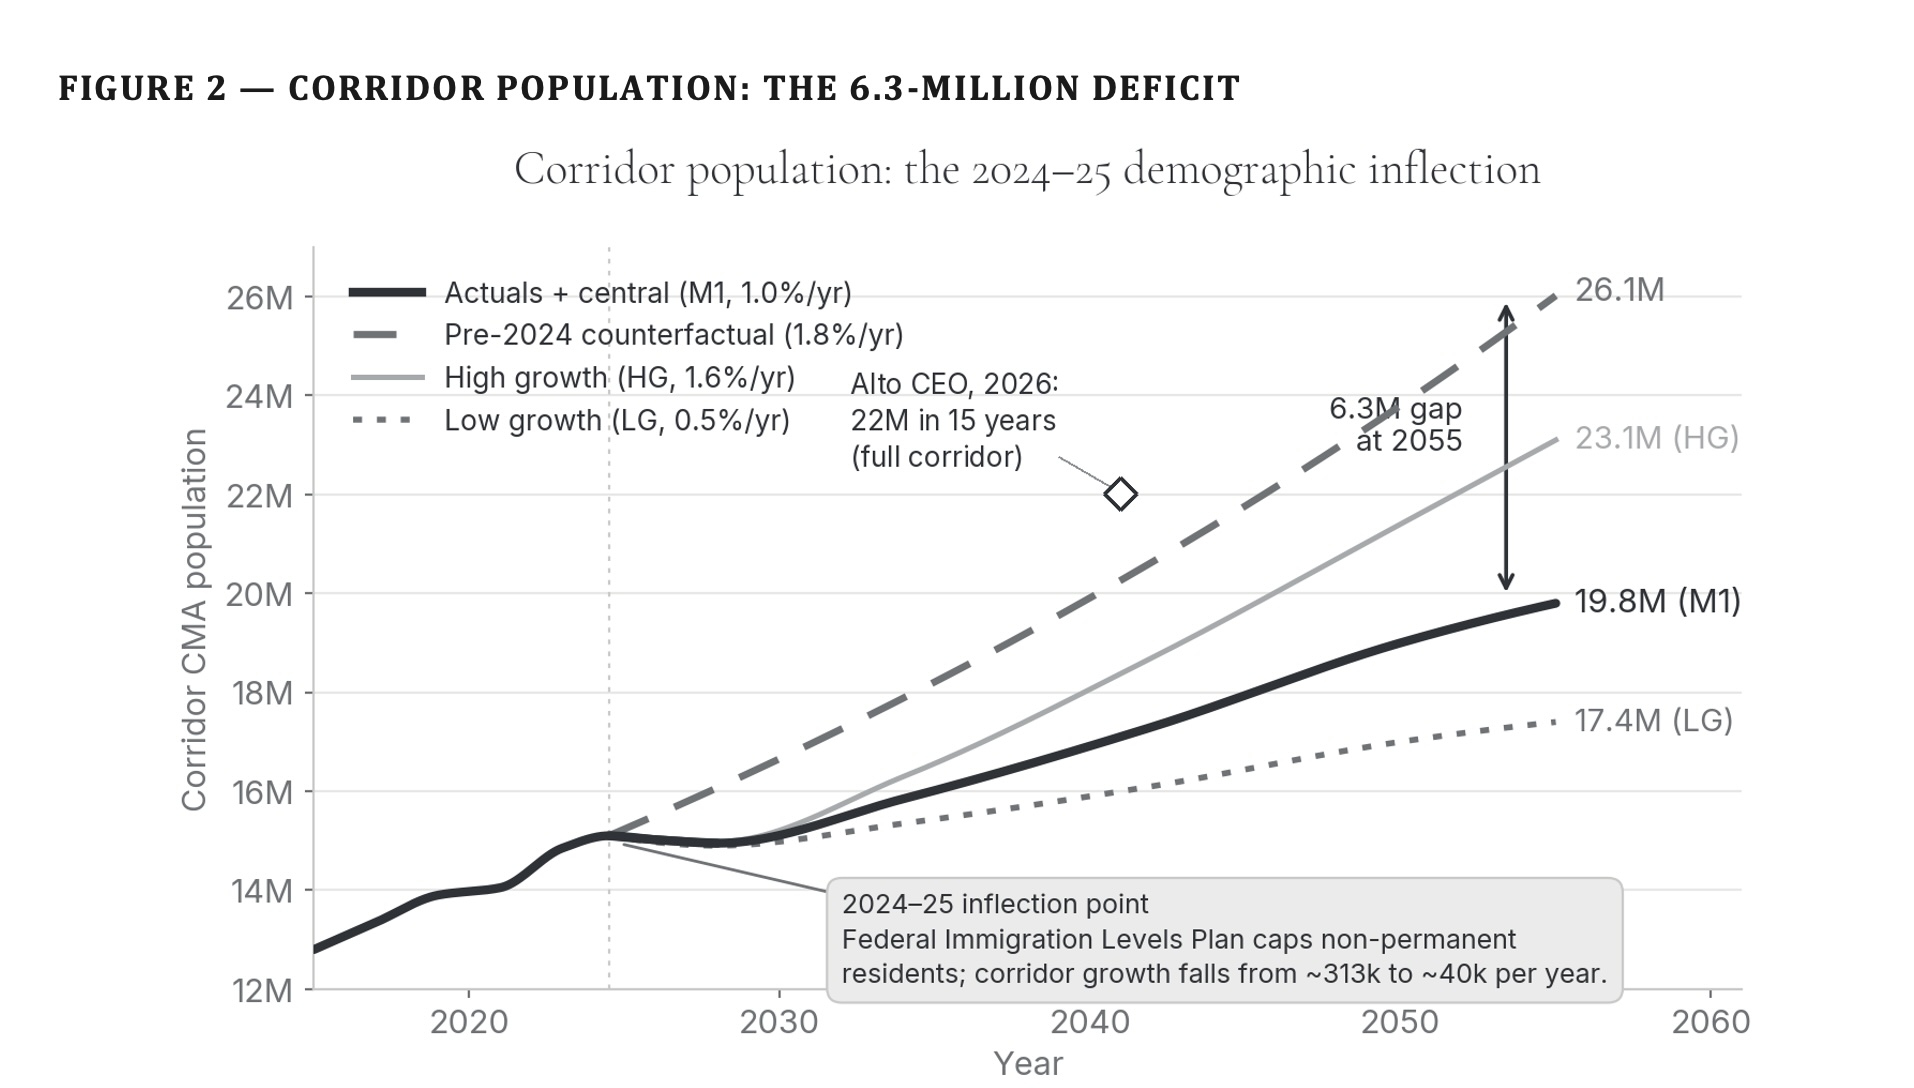
The market a fast service actually converts is measurable: the cars crossing the corridor, the air travellers on the competitive pairs, and the existing VIA riders it retains. Added together — roughly 2.8–3.5 million from car, 1.7–2.0 million from air, and about 3.3 million retained rail (VIA’s directly reported 2025 Corridor East ridership) — they come to about 8 to 9 million. The 95-million figure is an all-modes, all-pairs total that no service captures.
The 95-million figure itself is unsourced
Stated in the commentary without citation, and absent from Fast Forward (March 2025), the Corporate Plan Summary 2024-25 to 2028-29, and the June 2026 What We Heard consultation report. No independent analyst has adopted it. The denominator that anchors the modest-quarter framing is not just broad but unpublished.
The demand-growth story reverses the per-capita trend
Ninety-five to one hundred and forty million over 2026–2049 is about 1.7 per cent a year, faster than the corridor’s own population growth. The gap implies rising travel per resident — against the grain of hybrid work and videoconferencing.
The population base is the pre-cap one
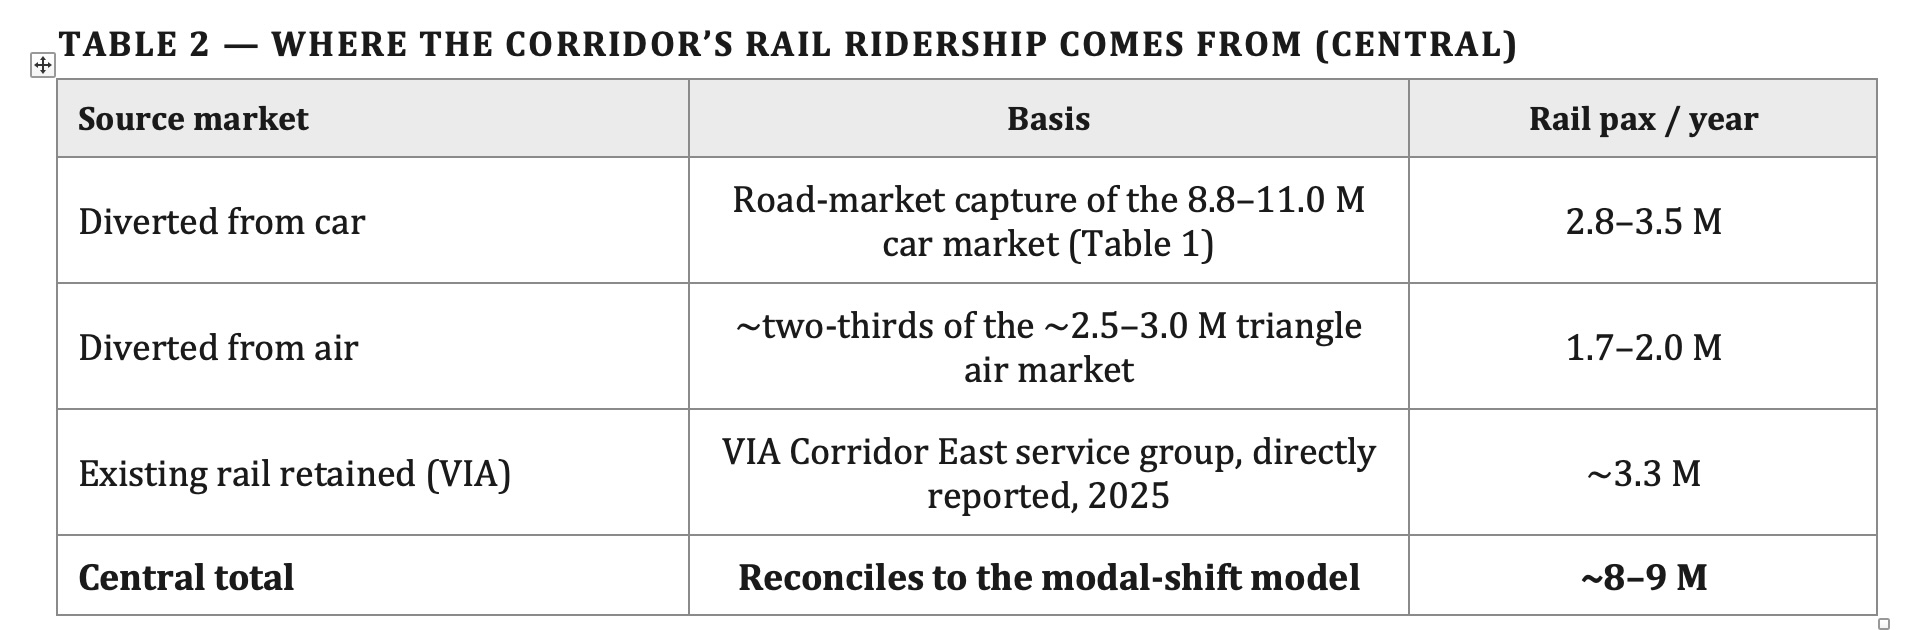
Twenty-two million in fifteen years extrapolates the 2015–2025 immigration surge. Statistics Canada’s January 2026 projection is lower; on the current path the corridor is about 6.3 million people smaller by 2055 than the counterfactual Alto’s numbers assume.
The one comparator offered is a best case
Madrid–Barcelona is among the strongest high-speed successes on record. The honest reference class — the full distribution of high-speed outcomes, many of which undershot their forecasts — brackets the answer far below 24 million.
What comparable corridors actually carry
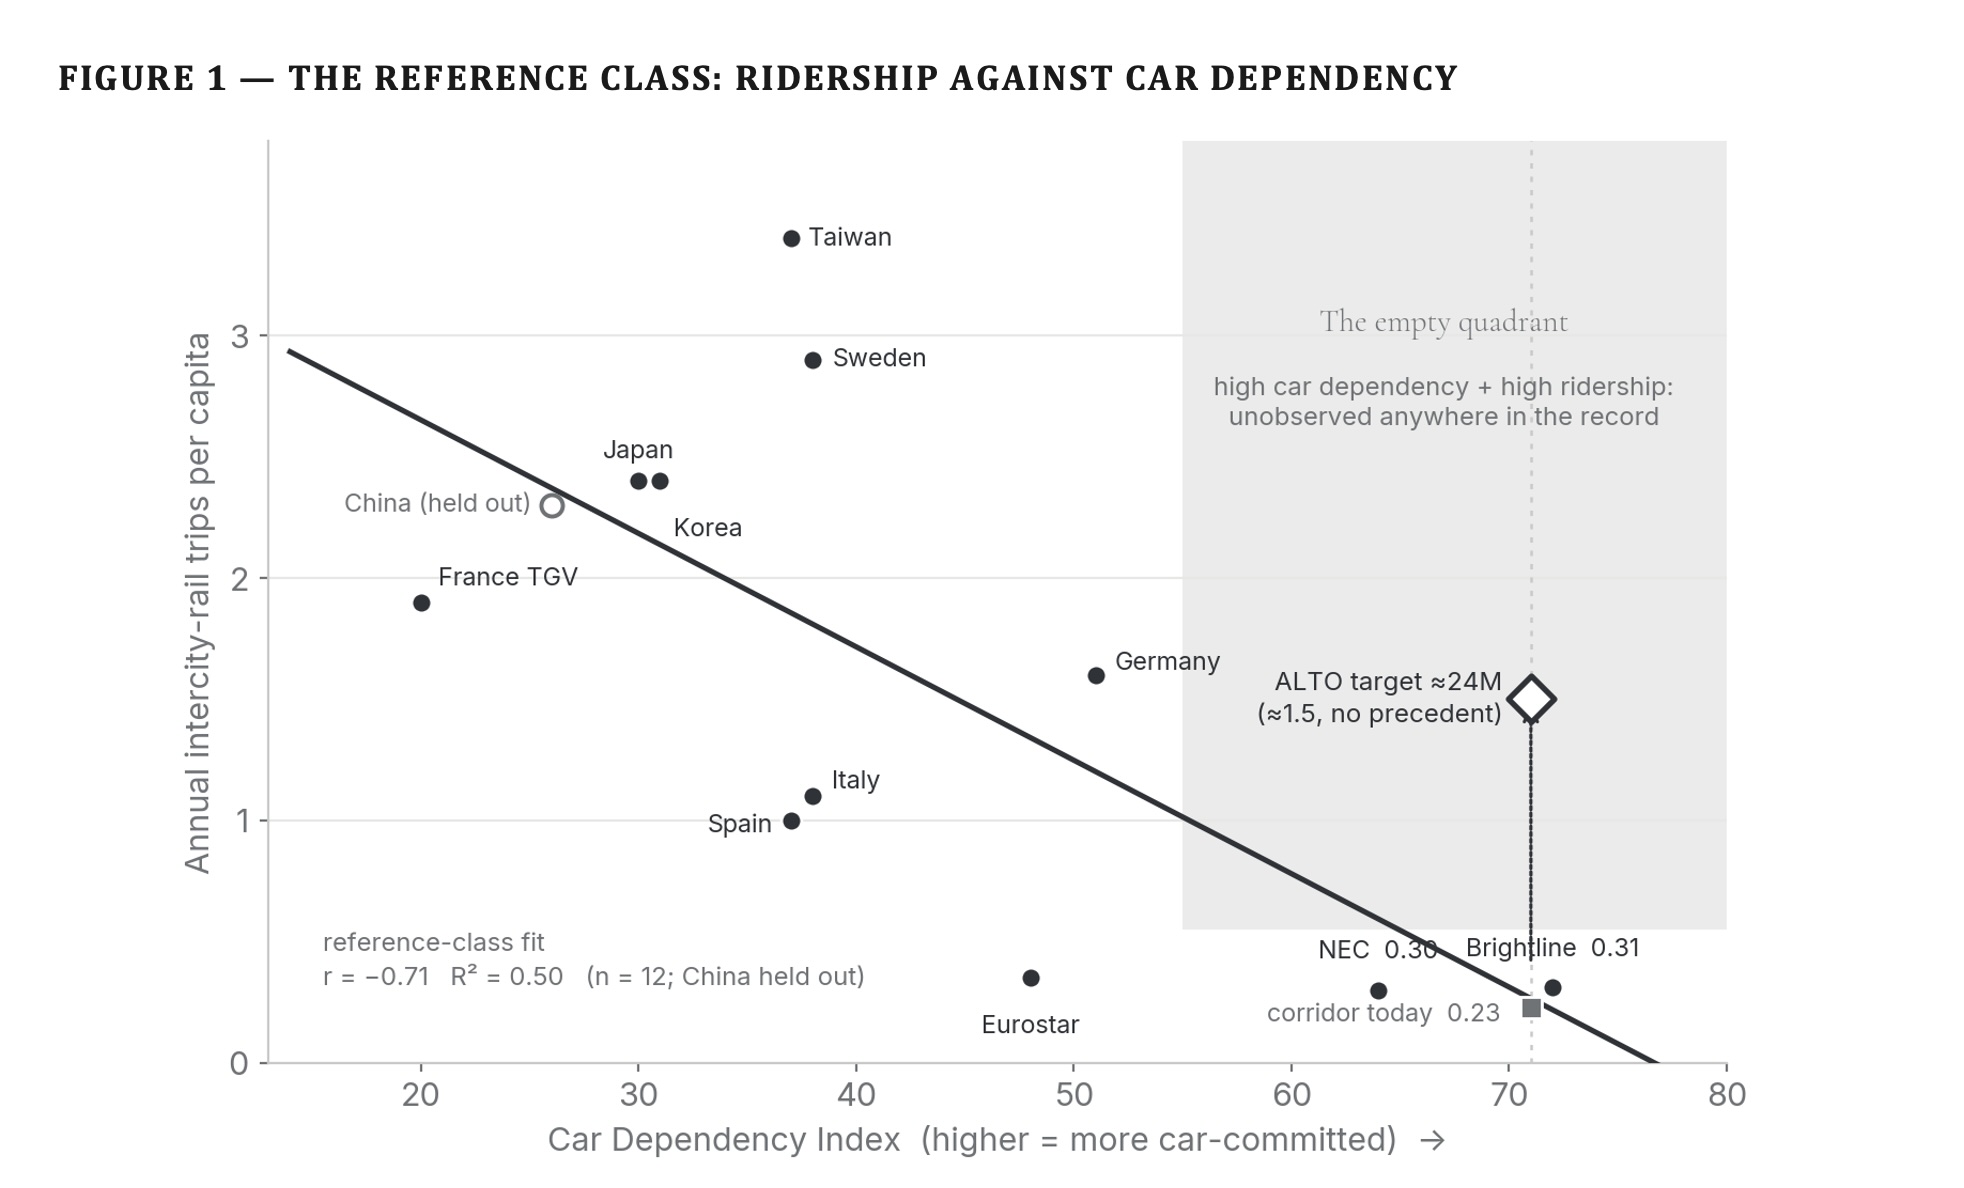
Rather than model the corridor from assumptions, the reference-class method asks what corridors with similar car dependence, density, and trip lengths actually achieve once fast rail opens. Each candidate corridor is scored on a Car Dependency Index (CDI) — a composite of car mode share, population density, and transit provision at the endpoints. The Toronto–Québec City corridor’s high car dependence places it with reference cases that, rescaled to this line, carry the equivalent of roughly 4 to 5 million corridor trips a year at maturity. This is the risk-adjusted floor: what the evidence says the corridor is most likely to do before any speed, fare, or density assumption is layered on.
Demand, counted not modelled
A fast service on this corridor draws from three distinct current populations: the car market, the air market on the competitive city pairs, and the existing rail riders. Each is measurable from public data. Because they are distinct populations, they add without double-counting.
The car market is read at the Highway 401 screenline where it crosses into Québec, after Ottawa-bound traffic has left via Highway 416 and Cornwall-local traffic has loaded, stripped of the 30 to 35 per cent commercial-truck share and short regional trips: roughly 8.8 to 11.0 million end-to-end car person-trips a year across the triangle at an occupancy of 2.0. Applying the road-market capture rates converts these into the rail ridership the car market alone would yield.
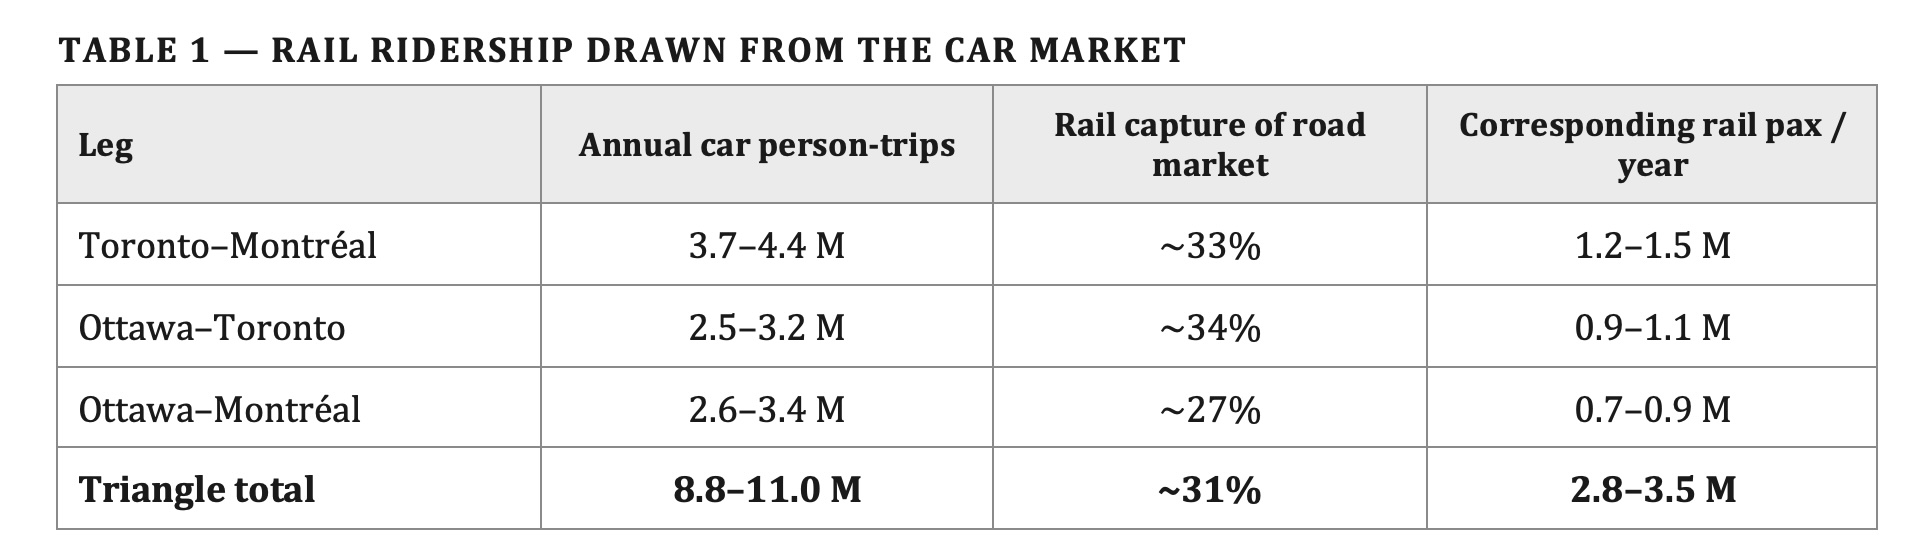
The car market is only one of three. A fast corridor service also draws from the air travellers on the same city pairs, and it retains the passengers already riding the train. The corridor air market on the competitive pairs — Toronto–Montréal, Toronto–Ottawa, and the smaller Ottawa–Montréal — is on the order of 2.5 to 3.0 million point-to-point passengers a year, of which a fast train on these distances captures about two-thirds.
Existing conventional rail is now reported directly in VIA’s 2025 annual results: 3.34 million passengers a year on the Corridor East service group (Québec City–Montréal–Ottawa–Toronto), within a Québec City–Windsor corridor total of 4.18 million. Essentially all of the triangle share is retained by a faster, more reliable service. VIA’s audited subsidy figures also fix the shape of the trip-length distribution: 48.51 dollars per passenger over 0.22 dollars per passenger-mile is an average trip of about 355 kilometres — roughly a third of the end-to-end corridor distance. Even the passengers already choosing rail are, on average, taking journeys well short of the full corridor.
The 6.3-million deficit
Every ridership figure scales with the population beneath it, so the choice of population path is decisive. The brief uses Statistics Canada’s January 2026 projection (catalogue 17-20-0003), which incorporates the 2024–25 federal Immigration Levels Plan.
Against the pre-2024 growth path that older corridor forecasts — and the commentary’s twenty-two-million figure — assume, this is materially lower: the corridor reaches about 19.8 million by 2055 on the current path, versus 26.1 million on the counterfactual, a deficit of 6.3 million. Because ridership scales with population, a forecast on the old path is inflated by roughly the same proportion the population has been cut — before any question of mode share or capture even arises.
Where Alto’s target sits against every independent forecast
The three methods converge. The demand-side build-up sums to about 8 to 9 million a year; the bottom-up modal-shift model lands in the same place; the reference class puts a floor near 4 to 5 million. Set beside the full band of independent corridor estimates, Alto’s 24-million target stands alone above every one.
Where the 95-million figure appears — and where it doesn’t
A demand denominator on which a $60–90 billion capital commitment rests should be reproducible from published sources. Alto’s is not. The ninety-five-million and one-hundred-and-forty-million figures are stated in the April 2026 commentary without citation and are absent from every canonical planning document the corporation has published.
PresentImbleau, M., “High-speed rail is not a leap of faith: why it matters for Canada’s growth” — Op-ed, Toronto Star and La Presse, April 17, 2026; reproduced on altotrain.ca. The single document in which the 95-million and 140-million figures appear. Stated without citation, methodology, or reference to any underlying study.
AbsentFast Forward: Shaping Canada’s Future with a High-Speed Rail Network (March 2025) — Alto’s own public-facing explanatory document. Discusses ridership growth from ~3 million (2024) to 24 million (2055) and 43 million (2084), but does not reference the 95-million intercity-trip figure or provide any market-total denominator on that scale.
AbsentVIA HFR – VIA TGF Inc., Corporate Plan Summary 2024-25 to 2028-29 (November 2024) — the corporation’s tabled planning document referenced by the Library of Parliament backgrounder on the project. Contains ridership targets (“17 million by 2059” for HFR, before the HSR rebrand) but no 95-million total-market figure.
AbsentJune 2026 What We Heard Report on the corridor study area — Alto’s own summary of the January–April 2026 consultation, running to more than 130 pages. Does not reference a 95-million figure.
AbsentQuarterly Financial Reports through Q3 2025-26 — Alto’s mandatory reporting to Parliament. Does not reference a 95-million figure.
AbsentIndependent published analyses of the corridor — the C.D. Howe Institute’s All Aboard study (March 2026), the Munk School Global Economic Policy Lab’s HSR analysis, Transportation Research at McGill’s corridor demand modelling, and Michael Schabas’s Senate submission on Bill C-15 (January 2026, 65 pp.). None uses the 95-million figure.
The finding does not, on its own, resolve whether the 95-million figure is defensible. It resolves whether the figure is auditable. On the public record as it stands, it is not: no derivation has been published, no methodology has been described, and no independent source has adopted it.
Three things follow
The demand case that anchors a 1,000-kilometre corridor, a $60–90 billion capital commitment, and a multi-decade delivery programme cannot responsibly rest on figures that have not been made auditable. Three steps would meet the standard.
Release the demand model for independent audit
A forecast that anchors an alignment and a multi-decade capital commitment cannot responsibly remain unpublished. In particular, the derivation of the ninety-five-million and one-hundred-and-forty-million intercity-trip figures cited in the April 2026 commentary should be published alongside the underlying model.
Adjust toward the reference class and current population
Standard megaproject appraisal requires promoter forecasts to be adjusted toward the reference class rather than accepted at face value. Alto’s should also be re-based on Statistics Canada’s January 2026 population projection, rather than the pre-2024 path the current forecast assumes.
Size the corridor decision to the audited demand
Not to a ninety-five-million headline or a twenty-four-million target that no independent method reaches. High-speed rail need not be a leap of faith. But the demand case as currently stated is closer to one than the corridor’s own numbers allow.
Primary documents and data
Every figure in this analysis is drawn from the public sources or companion analyses set out below and is reproducible from them. Sources are grouped by the claim or quantity they support.
1.The claim examined. Imbleau, M., President and Chief Executive Officer of Alto. “High-speed rail is not a leap of faith: why it matters for Canada’s growth.” Commentary, altotrain.ca, April 17, 2026. altotrain.ca. The source, stated without further citation, of the ninety-five-million and one-hundred-and-forty-million intercity-trip figures, the eighteen-to-twenty-two-million population claim, and the twenty-four-million passenger target for 2055.
2.Alto planning documents in which the 95-million figure does not appear. Alto, Fast Forward: Shaping Canada’s Future with a High-Speed Rail Network (March 2025). VIA HFR – VIA TGF Inc., Corporate Plan Summary 2024-25 – 2028-29. Alto, June 2026 What We Heard Report on the corridor study area public consultation. All at altotrain.ca.
3.Companion research, Citizen Research Initiative. Intercity Car Trips Between Toronto, Ottawa and Montréal (2026) — road-side measurement of end-to-end car travel at the Highway 401 Québec-boundary screenline, the per-leg car person-trips of Table 1, and the road-market capture rates of Table 2. HPR Research Report — Ridership (2026) — the demand reference class and Car Dependency Index (Figure 1); the modal-shift model, R = P × μ × s × φ(t); the population basis (Figure 2) and the 6.3-million deficit; and the triangulation against independent forecasts (Figure 3). All at citizenresearch.ca.
4.Traffic and travel-demand data. Ministry of Transportation of Ontario, Provincial Highways Traffic Volumes — annual average daily traffic on Highway 401, sections between the Highway 416 interchange and the Québec boundary. VIA Rail Canada, 2025 Annual Report (Montréal, March 2026): 4.40 million passengers system-wide and 986 million passenger-miles; 4.18 million on the Québec City–Windsor corridor and 3.34 million on the Corridor East service group; audited service-group subsidy figures implying an average Corridor East trip of about 355 kilometres. Statistics Canada, Air passenger traffic at Canadian airports (table 23-10-0253), together with airport-authority passenger statistics for Toronto Pearson, Montréal–Trudeau, and Ottawa Macdonald–Cartier. Transport Canada, Transportation in Canada annual report.
5.Population. Statistics Canada, Population Projections for Canada, Provinces and Territories, January 2026 vintage (catalogue 17-20-0003), which incorporates the 2024–25 federal Immigration Levels Plan; and Census of Population, 2021, for the corridor’s census-metropolitan-area populations. These underpin the 19.8-million (post-cap) and 26.1-million (pre-2024 counterfactual) 2055 corridor figures and the 6.3-million deficit.
6.Comparator corridor forecasts. Transport Canada and the EcoTrain consortium, Updated Feasibility Study of a High-Speed Rail Service in the Québec City–Windsor Corridor (2011). Federal Joint Project Office and the VIA High Frequency Rail baseline (2021). Transportation Research at McGill (TRAM), corridor demand modelling. C.D. Howe Institute (2026), high-speed-rail scenario. Munk School Global Economic Policy Lab, corridor demand. Schabas, M., Alto High-Speed Rail: Conceptual Design and Business Case, Senate submission on Bill C-15 (January 2026). These supply the independent ridership band of Figure 3.
7.Forecasting method and optimism bias. B. Flyvbjerg, “Survival of the Unfittest: Why the Worst Infrastructure Gets Built — and What We Can Do About It” (Oxford Review of Economic Policy, 2009), and related work establishing reference-class forecasting; B. Flyvbjerg and D. Gardner, How Big Things Get Done (2023). HM Treasury (United Kingdom), The Green Book and its supplementary guidance on optimism bias. Oxford Global Projects, reference-class forecasting datasets and practice. UK National Audit Office, successive reports on High Speed 2 (HS2) documenting systematic optimism in demand forecasts and cost escalation.
Independent, non-partisan research on the proposed Toronto–Québec City high-speed rail corridor.