Section 1
The contractor and the public
Suppose our roof is damaged, and we are restricted by our bank to dealing with only one contractor for the repair. The contractor tells us there are two options, A and B, both of which are risky and expensive. Then we find out there is a third option, which is not so risky or expensive. The contractor has not only concealed this from us but now refuses to talk about it.
Is this an ethically acceptable way of doing business? No, it seems to violate basic values of honesty and transparency.
By analogy, this seems to be how Alto has tried to do business with us as a public. The roof is our broken inter-city transportation system. The two expensive and risky options are two new high-speed rail [HSR] corridors put forward in the Alto project proposal of 2025-26. What I will call the ‘northern Shield corridor’ lies north of Highway 7, and what I will call the ‘Frontenac/Napanee corridor’ lies south of Highway 7. Farther south another corridor already exists, along the CN right of way and Highway 401. This third, most southerly corridor is the one that Alto is reluctant to discuss.1
To put this in another way, the imaginary contractor and the real agents of Alto are both selling their solutions with logical fallacies. The contractor tells us: you need to fix your roof, so you need my options A or B. Alto: you need to fix your broken transportation system, so you need a new transportation corridor. Neither argument follows, because in each case there is a third option.
Section 2
Good development vs. maldevelopment
Some development is worthwhile, but some is quite undesirable; this is an ethical difference, based on values, and with 80 years of post-WWII experience we know a lot about what these values are. Worthwhile development not only produces more, it also enhances people’s well-being and freedom, so that they are better able to shape their own lives for the better; it also does so equitably and sustainably. These are the pillars of what has been identified as a worthwhile ‘human development’ approach by the influential economist Mahbub ul Haq in collaboration with Nobel laureate Amartya Sen.2
Meanwhile, other development researchers have studied what these broad values require in practice in cases of development projects (like Alto) that involve land-taking.3 Some guidance can be found in national legal systems, in international human rights law, and in operational policies of international financial institutions. Yet the evidence shows that ‘even when all three approaches are applied consistently, outcomes … are generally still poor’, impacting negatively on the livelihoods and well-being of people affected.4 A recent synthesis of this research has formulated six guiding principles to fill these gaps. Three of these are most significant for the Alto proposal:
2. Fair procedures: promote inclusive decision-making through a fair and transparent procedure from the outset and throughout the lifecycle of the project;
3. Fair distribution: ensure a fair distribution of impacts and benefits and align with the Sustainable Development Goals;
6. Remedy and accountability: ensure remedy and accountability through access to grievance redress mechanisms, remediation and legal recourse.5
These values and principles help to distinguish between good development and maldevelopment in five dimensions of the Alto proposal: public interest, landowner impact, community impact, environmental impact, and Indigenous peoples’ consent.
Section 3
Public interest, public need
Development ethics tells us that people should not be displaced and land should not be taken for development except for projects that are in the public interest.6 What does ‘public interest’ mean here? It means that the gains or advantages created by the project are not entirely private gains, that very significant gains accrue to us as a public. An important standard of public interest is public need. Building schools and hospitals involves land-taking, by which some residents may be displaced, and yet there is great gain to the public, in having schools and hospitals, simply because schools and hospitals are things we need, as a public. This does not entail that building a particular school in a particular place is the best way to meet this need, but it does give very strong reason for building some such school where it is most needed.
The term ‘high-speed rail’ has been used with different meanings in recent discussions, and so I want to be clear that what I will mean is rail service with maximum speeds faster than 200km/hr. This range corresponds with the definition of HSR by the International Union of Railways.7 This range includes what Alto means by ‘high-speed’, which is faster than 300km/hr, but it also includes speeds in the 200 range. Unlike the Alto definition (>300km/hr), the broader UIC definition captures the majority of high-speed rail services currently offered in Japan and Europe.8
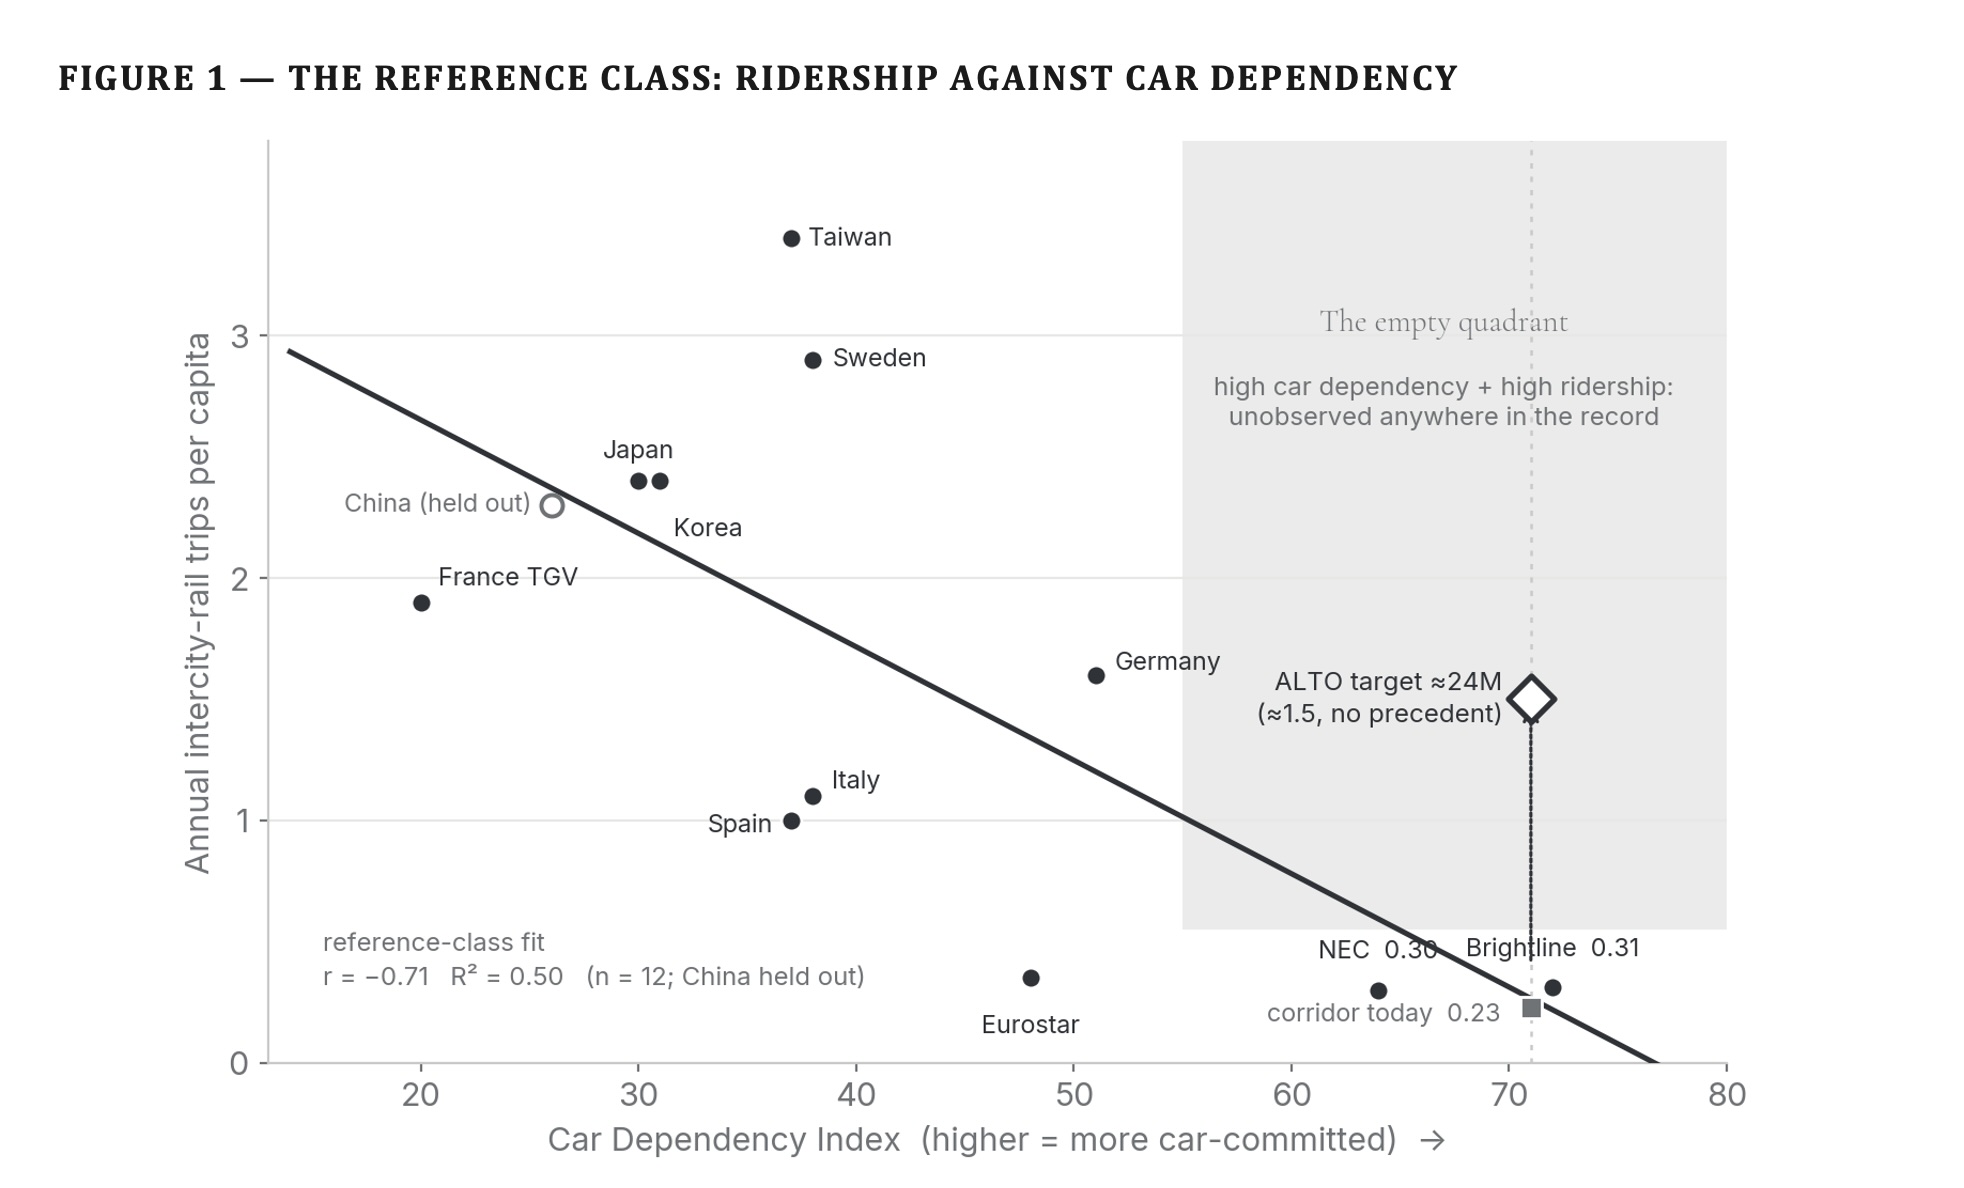
There is a strong case that high-speed rail, in this sense, is a public need in Ontario and Québec. According to this argument, HSR is needed to shift people’s choices in the Ontario-Québec corridor from airplanes, cars, and buses to trains. This is needed for two main reasons. First, continued reliance on cars, buses, and airplanes, for generations to come, has an unacceptable carbon footprint, which will contribute to ever greater loss of life, property, homes, and habitats through climate change. Second, continued reliance on cars, buses, and airplanes imposes a drag on economic productivity, putting downward pressure on livelihoods and well-being throughout the economy. For these two reasons, it is argued, we have a long-term need to change the mode of inter-city transport in this corridor, and, to achieve this we have a long-term public need for high-speed rail.9
However, this does not determine where and how HSR should be built – with one exception. Building HSR stations at locations removed from city centres defeats the purpose of HSR (for travelers) by adding commuting time to reach the stations.10 As to where and how HSR is built, public benefit is only one value that matters: we also have equity/fairness/justice and sustainability to consider. There are equity issues pertaining to landowners, communities, and Indigenous peoples, which I will consider in the next three sections; environmental values will be considered in section 7. All of these raise further issues of accountability.
Section 4
Landowner impact
When we notice unfairness or injustice, we are perceiving some kind of deprivation as being wrong. Even if a development project meets public needs and creates public benefits, our intuitive sense of justice will object if the project imposes unwarranted burdens and harms on others. It remains true for cooking that, ‘If you want make an omelet you have to break some eggs,’ – but not as a metaphor excusing harmful development. Thus it is widely accepted that development projects should not make people worse off, either by displacing them from their land, or through other community impacts.11
Paying people market value for the land that is taken from them may still leave them worse off. One reason is the impact of land-taking on livelihoods. When his land was assessed for compensation by an oil pipeline project, a Ugandan farmer remarked, ‘I had 10 mango trees where I used to make a lot of money every season and look after 11 dependents, we got only 670,000 [shillings] … they didn’t think about the capital value required to plant new trees and how many years it would take us to start harvesting fruits again.’12 The Alto project does not threaten any mango trees in Eastern Ontario, but it does threaten to impact livelihoods by dividing farms. It may be possible to mitigate these effects, but it would be complicated: organizing and paying for land swaps so that each farm is made whole by other land on the same side of the fenced-off right of way. One challenge of land replacement strategies like these is to ensure that the replacement land is of as good quality as the land lost. If this is not possible, compensation for lost revenue/livelihood would require revenue sharing plans on the part of the project.
The Ontario Federation of Agriculture has stated:
It is not acceptable for any railway to divide properties and thereby “landlock” the interior of the lot. Any crossing must be at least 10 metres wide to allow large and irregularly shaped farm and forestry equipment to be conveyed safely across the railway. Over- and underpasses must be engineered to accommodate the weight, height, and width of not only today’s farm and forestry equipment but also what machines may be used in the future. Crossings must also be engineered to prevent equipment rollovers. Alto must also preserve drainage system functionality and not adversely affect natural drainage systems.
Alto has stated that the entirety of the railway corridor will be fenced. Alto must consult on the fencing design to ensure farm animals cannot stray onto the tracks, as some farm animals have special fencing needs.
In addition, Transport Canada and Alto must provide fair and proportionate compensation for other negative affections caused by the railway, which will permanently affect farm production and limit growth potential.13
The issue here is equity: if these effects are not fully mitigated and/or compensated, the farmers will bear special burdens for the building of high-speed rail – as if an arbitrary high-speed rail tax were imposed upon farmers on whose land track was laid.
Currently no accountability mechanisms have been established to ensure that such mitigations and compensations are carried out, and to which landowners can seek recourse in case mitigation and compensation are not carried out. Government has an ethical obligation to establish such mechanisms before making a final investment decision.
Section 5
Community impacts
According to Alto:
High-speed rail is one of the world’s safest modes of intercity transportation. This partly stems from the fact that its tracks are physically separate from regular road traffic. There are no crossings connecting roadways and the tracks, thereby minimizing the risk of collisions. In addition, the high-speed rail network’s right-of-way is completely fenced in. Elevated tracks and tunnels mean the trains can cross entire cities without interacting with other road vehicles or trains.14
However, this same railway separation also has other consequences for human security. Limited overpass/underpass crossings may increase distances and times for fire and ambulance services, potentially causing fatal delays.15 These security gaps can be mitigated by careful planning of overpasses and underpasses; mitigation plans should be agreed with the municipalities responsible for delivering these services. Best practices of high-speed rail systems in other countries should be followed.
Once again accountability is a problem. To date no accountability mechanisms have been established to ensure agreement and planning for timely fire and emergency health services after Alto rail lines have been built and separated from roadways. Nor is there any body to which municipalities can seek recourse in case such agreement and planning do not occur, or in case agreements are not fulfilled. Government has an ethical obligation to establish such mechanisms before making a final investment decision.
If the Frontenac/Napanee or northern shield corridors are chosen for HSR, existing VIA service will be impacted by service cuts as longer-distance travellers shift to HSR. At present Kingston is the fifth-busiest passenger train station in the country. There is a public need to maintain viable service for these passengers and others from stations along the existing VIA corridor. Moreover, community impacts from Alto would reach far beyond eastern Ontario. If 80% of VIA revenue currently comes from passengers travelling in the Windsor-Québec corridor, and much of this is diverted to Cadence as operator of HSR between Toronto and Québec, much less will be available to support other major VIA trains, such as: Montréal-Halifax (‘The Ocean’); Toronto-Vancouver (‘The Canadian’); Winnipeg-Churchill; Jasper-Prince Rupert; Sudbury-White River; Montréal-Jonquière/Senneterre. Allowing these train services to be degraded or discontinued would constitute a clear neglect of public interest. Accordingly, the Alto HSR Citizens Research Initiative has called for two immediate legislative responses:
Statutory Service Guarantee for the Kingston SubdivisionAny federal legislation enabling ALTO must include a statutory charter guaranteeing minimum VIA Rail service levels on the Kingston Subdivision. The charter must specify minimum daily frequencies, protect morning and evening service windows, and require public consultation before schedule changes affecting intermediate communities.
Dedicated, Legislated Funding for the National Rail NetworkParliament must establish a dedicated funding stream for VIA Rail’s non-corridor network — The Ocean, The Canadian, and remote services — entirely independent of corridor revenue that will transfer to Cadence. This fund must be protected as a condition of any ALTO implementation agreement.16
The appropriate timing for such legislative action would be as close as possible to the final investment decision on the Alto project.
Section 6
Indigenous peoples’ consent
Alto has stated, ‘We are committed to engaging in meaningful consultations with the aim of securing the Free, Prior, and Informed Consent (FPIC), of potentially impacted communities.’17 The phrasing is ambiguous. Are they committed to achieving FPIC, or only to holding ‘meaningful consultations with the aim’ of doing so? The UN Declaration on the Rights of Indigenous Peoples is unambiguous on this point.
Article 322. States shall consult and cooperate in good faith with the indigenous peoples concerned through their own representative institutions in order to obtain their free and informed consent prior to the approval of any project affecting their lands or territories and other resources, particularly in connection with the development, utilization or exploitation of mineral, water or other resources.18
Meaningful consultation is not the end; it is only a means to achieving ‘free and informed consent prior to the approval of any project affecting their lands or territories and other resources’.
The earlier High Frequency Rail project which preceded Alto included consultation with ‘more than 40 potentially impacted Indigenous communities and organizations’.19 However, that consultation focused entirely on supplementing the Request for Proposals with provisions for Indigenous social benefits and participation. There was no mention of consent with regard to impact on Indigenous territory; in any case, the Request for Proposals for HFR has been superseded by the Alto HSR proposal awarded to Cadence, now in co-development phase. Site selection and alignment have not yet been specified by Alto and Cadence. At the present time it is unclear whether any discussions have been undertaken with the Mohawk of the Bay of Quinte in Ontario or the Mohawk of Kanesatake in Quebec about use of or impact on their territories. Nor is there any evidence of commitment to recourse or accountability mechanisms for benefit/land/participation commitments that will be made to them.
Section 7
Environmental Impact
For the route through the Frontenac Arch and Napanee Plain, environmental risks are significant. For the northern route largely over Canadian Shield, risks are less clear. For the southernmost corridor, environmental risks have already been incurred by the CN right of way and Highway 401; one would expect additional risks from HSR to be small by comparison. Doing nothing to shift travelers over to rail also incurs the environmental risks incurred by flying and driving, notably contributions to climate change. The difficult question is actually the normative question: which risks must be avoided? If worthwhile development is environmentally sustainable, then the answer is that we must avoid risks that are unsustainable, and this shifts the question to: what are the meaning and standards for sustainability?
While precise answers to these normative questions are elusive, two broad ways of framing them have emerged over the past forty years to provide starting points for public deliberation about environmental risks. The 1987 Brundtland Commission proposed that development is sustainable when it meets the needs of present generations without jeopardizing the needs of future generations.20 More recently, the UNDP Human Development Report of 2020 called for steering development to ease the ‘planetary pressures’ that historical and contemporary social and economic development unleash.21 The main idea here is that development puts pressures on the planet, and the planet pushes back in ways that make present and future human flourishing more uncertain. At the extreme:
Climate change and biodiversity integrity loss are tightly coupled core boundaries, and human activities are currently pushing both of them into a high-risk zone. If humanity breaches planetary boundaries too far or for too long, it may disrupt planetary life support systems, with substantial risks for human life as we know it.22
The HSR corridor over part of the Frontenac Arch will also traverse an adjoining limestone plain surrounding the Napanee and Salmon Rivers. Under the limestone plain is found karst geology, featuring sinkholes, fissures, caves, and disappearing streams; above it are rare alvar ecosystems based on terrain with thin or no soil cover. These ecosystems harbour several species protected by the Species at Risk Act; it is doubtful that Alto could show that its construction can meet requirements of this Act. Construction would also affect subsurface water flows in unpredictable ways, possibly damaging freshwater access and use downstream. For other ecosystems in other places it may be possible to mitigate environmental impacts of HSR, as for example best practice standards have evolved in Europe for protecting essential pathways for migratory species. If such mitigation strategies can succeed for a CN/401 corridor, or for a northern shield corridor, they must be planned, budgeted, and carried out. However, in the Frontenac Arch and Napanee Plain these particular mitigation strategies may be of no use, due to the combination of karst geology below and alvar ecosystems above. Since biodiversity and freshwater access are two dimensions in which there are planetary boundaries, it follows that, in this corridor, an HSR line would be adding to planetary pressures rather than reducing them. Building HSR in the Frontenac/Napanee corridor, then, qualifies as environmental maldevelopment.23
In the northern Shield corridor, biodiversity and freshwater impacts may be less pronounced and more amenable to mitigation. The HSR line and its construction are less likely to disrupt water flow in this corridor, where streams run parallel to rail alignment. The line would disrupt movement by larger mammals such as moose, elk, and bear, but these are not species at risk. More research is needed to determine what kinds of mitigation are required; international evidence suggests that there are few types of overpass that large mammals will actually use, and these are quite expensive.24 Effects on other species also requires further study and assessment. A clear standard for wildlife mitigation, with accountability mechanisms, is needed to ensure that adequate mitigation measures are chosen and implemented.
Section 8
Ranking the options: from morally worst to not so bad
These two frameworks – future generations and planetary pressures – can help to orient discussion of environmental and social impacts in ethical, value-based terms. We can consider what will be the result of rolling out the various HSR options over multiple future generations. How will these decisions now affect planetary pressures exerted by humans then? Is it possible to assess or at least imagine how much closer to or in excess of planetary boundaries we get, in each scenario? In light of this, we can rank those options, as to how comparatively undesirable they are, from a development ethics perspective.
The following rankings are only illustrative, expressing my own moral assessment, based on reasons for concern that I am aware of at the present time. This illustration, however, does have a point, namely that it is plausible and powerful to rank the options before us in terms of their enduring impact both to enhance human well-being and to reduce the dangerous pressures we are placing upon the planetary systems that sustain us. What we need, I conclude, is a public deliberation to make such a ranking.
1
Status quo.If there is no replacement for current VIA Rail levels of service, travelers will continue to be shunted into cars, buses, and airplanes to travel between Québec, Montréal, Ottawa, and Toronto (and indeed London and Windsor). The carbon footprint for this travel will grow apace. There being no other proposals on the horizon to compensate, I conclude that continuation of the status quo on VIA Rail will mean continued contribution to the death, illness, and destruction of property and habitats that result from carbon-induced climate change.
2
Frontenac/Napanee corridor, without mitigation.Mitigation for landowners and community safety are feasible and morally mandatory; however, for the sake of ranking consider the possibility that it is not carried out, so we have: unnecessary and inequitable loss to livelihoods and human security. In that respect, this option ranks worse than the following one:
3
Frontenac/Napanee corridor, with human/community mitigation.Well-being and equity issues in the previous option are removed, but, on the environmental side, ecological mitigation seems unlikely. Over many generations, then, the effects we can anticipate from HSR include (a) expansion of human well-being; (b) reduction in the particular pressures imposed by the carbon footprint of travel between Windsor and Québec; but (c) significantly increased planetary pressures both on biodiversity and on freshwater access.
4
Northern Canadian Shield corridor, without mitigation.Although much of this territory is more remote, there are still roads, tracks, and migratory paths that can be cut off by HSR fencing. Human security and wildlife migration will still be impacted unless mitigation measures are adopted.
5
Northern Canadian Shield corridor, with mitigation.With landowner and community mitigation, inequitable losses are reduced, so that we can anticipate (a) expansion of human well-being, along with (b) reduction in the particular pressures imposed by the carbon footprint of travel between Windsor and Québec; (c) with mitigation it may be possible to avoid increasing planetary pressures on biodiversity, but this is not perfectly clear, either; (d) adverse impacts on fresh water are less likely. Rolling this forward over multiple generations, we want to ensure monitoring for unforeseen environmental problems. This could be addressed by establishing capability in each region affected by HSR for ongoing environmental monitoring, funded by revenue sharing from operation of HSR service.
6
Southern CN/401 corridor, without mitigation.Because this corridor already exists, one might expect fewer new adverse impacts. However, without mitigation, mandatory grade separation and fencing will adversely affect humans and other species alike, which makes this option worse than the final one.
7
Southern CN/401 corridor, with mitigationfor community and wildlife impacts to highest standards of European/Asian HSR, with further direction from the environmental assessment. With landowner and community mitigation, inequitable losses are reduced, so that we can anticipate (a) expansion of human well-being. In addition, the problem of depriving service to Kingston is avoided. Over future generations we can also expect (b) reduction in the particular pressures imposed by the carbon footprint of travel between Windsor and Québec. Following best European/Asian practices, modified by site-specific environmental assessment, (c) with mitigation it may be possible to avoid increasing planetary pressures on biodiversity as well as (d) impacts on fresh water. Still, rolling this forward over multiple generations, we want to ensure monitoring for unforeseen environmental problems by establishing, in each affected region, capability for ongoing environmental monitoring, funded by revenue sharing from HSR operation.
The worst option, according to this, is the status quo. Doing nothing now about intercity travel has the worst impact on well-being and planetary pressures for future generations. The Frontenac/Napanee options are not much better. An independent public panel, I believe, would confirm these rankings and could also shed more light on the others.
Section 9
Recommendations to the Government of Canada
1
Make corridor proposals public, including the CN/401 corridor. Immediately require Alto to develop and make public feasible alignment plans for (a) the CN/401 corridor, along with any alignment plans under active consideration for (b) the northern Canadian Shield corridor; and (c) the Frontenac/Napanee corridor. Require each of these plans to include cost estimates for wildlife and road crossings at high international standards, for land replacement to maintain farm viability, and for revenue sharing to fund ongoing monitoring of environmental impacts.
2
Make corridor choice a public choice. Prior to Final Investment Decision, appoint an independent public panel to recommend choice between corridor proposals (including the status quo), (a) on grounds of public interest, community impact, and environmental impacts/pressures; (b) considering these impacts for several generations (c) with powers to modify any proposals submitted, and (d) with a mandate to recommend mechanisms of recourse and accountability.
3
Obtain Indigenous peoples’ consent. Prior to Final Investment Decision, ensure that free and informed consent to impacts on their lands has been given by affected Indigenous peoples, along with mechanisms of recourse and accountability for community and environmental impacts on those lands as well as for commitments to Indigenous participation and community benefits.
4
Establish accountability mechanisms and environmental monitoring. Withhold Final Investment Decision until mechanisms of recourse and accountability have been established to support commitments for (a) landowners, (b) communities, (c) wildlife impacts, and (d) Indigenous communities. Do not invest in an HSR proposal that does not allocate revenue in the operational phase for ongoing regionally-controlled environmental monitoring.
5
Protect VIA Rail with legislation and funding. Establish service levels and funding streams for regional service along the Windsor-Montreal corridor and for VIA Rail’s non-corridor network – The Ocean, The Canadian, and remote services.
Section 10
Recommendations to Alto
A1
Corridor proposals. From the perspective of development ethics, corridor choice is not yours to make; this is properly a public choice. Accordingly, you are obligated to prepare development options for all of the feasible HSR corridors, to facilitate public choice among them.
A2
Request and obtain Indigenous people’s consent. Ensure that free and informed consent to impacts on their lands has been given by affected Indigenous peoples.
A3
Negotiate livelihood replacement. In negotiating with landowners, ensure that compensation covers livelihood replacement (including, for farmers, drainage and access to fields), including revenue sharing if necessary.
A4
Negotiate revenue sharing for ongoing regionally-controlled environmental monitoring during the operational phase.
A5
Negotiate mechanisms of recourse and accountability to support commitments made for (a) landowners, (b) communities, (c) wildlife impacts and environmental monitoring, and (d) Indigenous communities.
References
Notes
2Mahbub ul Haq, Reflections on Human Development (Oxford: Oxford University Press, 1995). Amartya Sen, Development as Freedom. (Cambridge, MA: Harvard University Press, 1999.
3Peter Penz, Jay Drydyk, and Pablo Bose, Displacement by Development: Ethics, Rights, and Responsibilities (Cambridge: Cambridge University Press, 2011).
4Smyth, Eddie, Susanna Price, and Frank Vanclay, ‘Fair and Equitable Land Access (FELA) by Development Projects: Enhancing Governance for Sustainable Development Outcomes When Projects Displace People,’ (Sustainable Development 2025, p. 3.
6Penz, Drydyk, and Bose 2011, p. 211.
7Union Internationale des Chemins de fer (UIC), ‘The Definition of High Speed Rail’ (UIC Communications: 2018). Accessed April 13, 2026.
uic.org.
9While I find that this argument is sound, it is only fair to note that others disagree. The core argument I have outlined is supplemented with other lines of argument in Alto’s ‘Fast Forward’ document (Alto (VIA HFR – VIA TGF Inc.), ‘Fast Forward: Shaping Canada’s Future with a High-Speed Rail Network’ (March 2025)
altotrain.ca) For opposing arguments see Tasnim Fariha, and David Jones, ‘High-Speed Potential, High-Stakes Decisions: The Policy Case for Alto’ (C.D. Howe Institute, December 11, 2025)
cdhowe.org, Jerome Gessaroli, ‘Canada’s next Budget Bomb Is the Alto High-Speed Rail Project’ (Macdonald-Laurier Institute, January 14, 2026.)
macdonaldlaurier.ca. The Citizens Research Initiative argues for upgrading the status quo to a ‘High Performance Rail’ system with top speeds not exceeding 200km/hr. (
Where we Stand on the Route, op. cit.) For arguments that raise complications rather than expressing outright opposition, see also: Johnny Renton, ‘The Good, Bad and Awful of the Alto High Speed Rail Project, and How to Fix the Flaws and Concerns Surrounding It.’ (Substack: Next Stop, Downtown Canada, February 4, 2026)
johnnyrenton.substack.com; Kathryn Smith Exon and Egon Terplan. ‘Keeping High-Speed Rail on Track: Learning from Other North American Projects’ (Toronto: School of Cities, June 6, 2025)
schoolofcities.utoronto.ca; and Michael Schabas, ‘Alto Conceptual Design and Business Case” (January 12, 2026) available on Google Docs,
Google Docs.
11Penz, Drydyk, and Bose, Chapter 7.
12Nassir Mwanje, ‘Community Perceptions of Fair Compensation in Land Expropriation: Insights from Uganda through a Capability Approach’ (Journal of Human Development and Capabilities, forthcoming).
14Alto (VIA HFR – VIA TGF Inc.),
Advanced Engineering Driving High-Speed Rail (February 19, 2026)
altotrain.ca.
16ALTO HSR Citizen Research Initiative, ‘VIA Rail on the Kingston Subdivision: Service Erosion, Funding Collapse, and the National Rail Risk from ALTO HSR’ (April 2026)
citizenresearch.ca/via-future.
17Alto (VIA HFR – VIA TGF Inc.), ‘Building Together: Indigenous Partnerships in Alto’s Vision’
altotrain.ca.
18United Nations,
Declaration on the Rights of Indigenous Peoples (General Assembly, 2007)
un.org
19Alto (VIA HFR – VIA TGF Inc.).
What We Heard & What We’re Doing Report. 2023.
altotrain.ca.
20World Commission on Environment and Development, Our Common Future (Oxford: Oxford University Press, 1987).
21The ‘planetary pressures’ framework is based on several decades of ‘planetary boundaries’ research. To simplify: the core idea is that there are nine specific dimensions of planetary change that range from low risk to growing risk to high risk for human flourishing. Among these, ozone depletion, climate change, biodiversity, ocean acidification, land use change, and freshwater use are most familiar in the public sphere. A good entry point into the literature is Human Development Report 2020: The Next Frontier; Human Development and the Anthropocene, Chapter 2, ‘Unprecedented – The Scope, Scale and Speed of Human Pressures on the Planet’ (New York: UNDP, 2020), pp. 45-68.
24See Hyett op. cit. and two other publications of ALTO HSR Citizen Research Imitative (2026):
The Wildlife Crossing Problem citizenresearch.ca/wildlife-crossings;
Wildlife Connectivity, Hunting Heritage, and Game Species Habitat: Impacts of the Proposed ALTO High-Speed Rail Corridors citizenresearch.ca.