Tag: Highway 401

  • Development ethics for Alto

    Guest Submission · Development Ethics

    Development Ethics for Alto

    Brief to the Alto online public consultation

    JD
    Jay Drydyk
    Professor Emeritus, Carleton University
    Past President, International Development Ethics Association
    Publisher’s Note

    The ALTO HSR Citizen Research Initiative is pleased to publish this guest brief with the author’s permission. It is reproduced as written; the analysis, rankings, and recommendations are Dr. Drydyk’s own. Footnotes appear as endnotes at the foot of the page.

    Section 1

    The contractor and the public

    Suppose our roof is damaged, and we are restricted by our bank to dealing with only one contractor for the repair. The contractor tells us there are two options, A and B, both of which are risky and expensive. Then we find out there is a third option, which is not so risky or expensive. The contractor has not only concealed this from us but now refuses to talk about it.

    Is this an ethically acceptable way of doing business? No, it seems to violate basic values of honesty and transparency.

    By analogy, this seems to be how Alto has tried to do business with us as a public. The roof is our broken inter-city transportation system. The two expensive and risky options are two new high-speed rail [HSR] corridors put forward in the Alto project proposal of 2025-26. What I will call the ‘northern Shield corridor’ lies north of Highway 7, and what I will call the ‘Frontenac/Napanee corridor’ lies south of Highway 7. Farther south another corridor already exists, along the CN right of way and Highway 401. This third, most southerly corridor is the one that Alto is reluctant to discuss.1

    To put this in another way, the imaginary contractor and the real agents of Alto are both selling their solutions with logical fallacies. The contractor tells us: you need to fix your roof, so you need my options A or B. Alto: you need to fix your broken transportation system, so you need a new transportation corridor. Neither argument follows, because in each case there is a third option.

    Section 2

    Good development vs. maldevelopment

    Some development is worthwhile, but some is quite undesirable; this is an ethical difference, based on values, and with 80 years of post-WWII experience we know a lot about what these values are. Worthwhile development not only produces more, it also enhances people’s well-being and freedom, so that they are better able to shape their own lives for the better; it also does so equitably and sustainably. These are the pillars of what has been identified as a worthwhile ‘human development’ approach by the influential economist Mahbub ul Haq in collaboration with Nobel laureate Amartya Sen.2

    Meanwhile, other development researchers have studied what these broad values require in practice in cases of development projects (like Alto) that involve land-taking.3 Some guidance can be found in national legal systems, in international human rights law, and in operational policies of international financial institutions. Yet the evidence shows that ‘even when all three approaches are applied consistently, outcomes … are generally still poor’, impacting negatively on the livelihoods and well-being of people affected.4 A recent synthesis of this research has formulated six guiding principles to fill these gaps. Three of these are most significant for the Alto proposal:

    2. Fair procedures: promote inclusive decision-making through a fair and transparent procedure from the outset and throughout the lifecycle of the project;

    3. Fair distribution: ensure a fair distribution of impacts and benefits and align with the Sustainable Development Goals;

    6. Remedy and accountability: ensure remedy and accountability through access to grievance redress mechanisms, remediation and legal recourse.5

    These values and principles help to distinguish between good development and maldevelopment in five dimensions of the Alto proposal: public interest, landowner impact, community impact, environmental impact, and Indigenous peoples’ consent.

    Section 3

    Public interest, public need

    Development ethics tells us that people should not be displaced and land should not be taken for development except for projects that are in the public interest.6 What does ‘public interest’ mean here? It means that the gains or advantages created by the project are not entirely private gains, that very significant gains accrue to us as a public. An important standard of public interest is public need. Building schools and hospitals involves land-taking, by which some residents may be displaced, and yet there is great gain to the public, in having schools and hospitals, simply because schools and hospitals are things we need, as a public. This does not entail that building a particular school in a particular place is the best way to meet this need, but it does give very strong reason for building some such school where it is most needed.

    The term ‘high-speed rail’ has been used with different meanings in recent discussions, and so I want to be clear that what I will mean is rail service with maximum speeds faster than 200km/hr. This range corresponds with the definition of HSR by the International Union of Railways.7 This range includes what Alto means by ‘high-speed’, which is faster than 300km/hr, but it also includes speeds in the 200 range. Unlike the Alto definition (>300km/hr), the broader UIC definition captures the majority of high-speed rail services currently offered in Japan and Europe.8

    There is a strong case that high-speed rail, in this sense, is a public need in Ontario and Québec. According to this argument, HSR is needed to shift people’s choices in the Ontario-Québec corridor from airplanes, cars, and buses to trains. This is needed for two main reasons. First, continued reliance on cars, buses, and airplanes, for generations to come, has an unacceptable carbon footprint, which will contribute to ever greater loss of life, property, homes, and habitats through climate change. Second, continued reliance on cars, buses, and airplanes imposes a drag on economic productivity, putting downward pressure on livelihoods and well-being throughout the economy. For these two reasons, it is argued, we have a long-term need to change the mode of inter-city transport in this corridor, and, to achieve this we have a long-term public need for high-speed rail.9

    However, this does not determine where and how HSR should be built – with one exception. Building HSR stations at locations removed from city centres defeats the purpose of HSR (for travelers) by adding commuting time to reach the stations.10 As to where and how HSR is built, public benefit is only one value that matters: we also have equity/fairness/justice and sustainability to consider. There are equity issues pertaining to landowners, communities, and Indigenous peoples, which I will consider in the next three sections; environmental values will be considered in section 7. All of these raise further issues of accountability.

    Section 4

    Landowner impact

    When we notice unfairness or injustice, we are perceiving some kind of deprivation as being wrong. Even if a development project meets public needs and creates public benefits, our intuitive sense of justice will object if the project imposes unwarranted burdens and harms on others. It remains true for cooking that, ‘If you want make an omelet you have to break some eggs,’ – but not as a metaphor excusing harmful development. Thus it is widely accepted that development projects should not make people worse off, either by displacing them from their land, or through other community impacts.11

    Paying people market value for the land that is taken from them may still leave them worse off. One reason is the impact of land-taking on livelihoods. When his land was assessed for compensation by an oil pipeline project, a Ugandan farmer remarked, ‘I had 10 mango trees where I used to make a lot of money every season and look after 11 dependents, we got only 670,000 [shillings] … they didn’t think about the capital value required to plant new trees and how many years it would take us to start harvesting fruits again.’12 The Alto project does not threaten any mango trees in Eastern Ontario, but it does threaten to impact livelihoods by dividing farms. It may be possible to mitigate these effects, but it would be complicated: organizing and paying for land swaps so that each farm is made whole by other land on the same side of the fenced-off right of way. One challenge of land replacement strategies like these is to ensure that the replacement land is of as good quality as the land lost. If this is not possible, compensation for lost revenue/livelihood would require revenue sharing plans on the part of the project.

    The Ontario Federation of Agriculture has stated:

    It is not acceptable for any railway to divide properties and thereby “landlock” the interior of the lot. Any crossing must be at least 10 metres wide to allow large and irregularly shaped farm and forestry equipment to be conveyed safely across the railway. Over- and underpasses must be engineered to accommodate the weight, height, and width of not only today’s farm and forestry equipment but also what machines may be used in the future. Crossings must also be engineered to prevent equipment rollovers. Alto must also preserve drainage system functionality and not adversely affect natural drainage systems.

    Alto has stated that the entirety of the railway corridor will be fenced. Alto must consult on the fencing design to ensure farm animals cannot stray onto the tracks, as some farm animals have special fencing needs.

    In addition, Transport Canada and Alto must provide fair and proportionate compensation for other negative affections caused by the railway, which will permanently affect farm production and limit growth potential.13

    The issue here is equity: if these effects are not fully mitigated and/or compensated, the farmers will bear special burdens for the building of high-speed rail – as if an arbitrary high-speed rail tax were imposed upon farmers on whose land track was laid.

    Currently no accountability mechanisms have been established to ensure that such mitigations and compensations are carried out, and to which landowners can seek recourse in case mitigation and compensation are not carried out. Government has an ethical obligation to establish such mechanisms before making a final investment decision.

    Section 5

    Community impacts

    According to Alto:

    However, this same railway separation also has other consequences for human security. Limited overpass/underpass crossings may increase distances and times for fire and ambulance services, potentially causing fatal delays.15 These security gaps can be mitigated by careful planning of overpasses and underpasses; mitigation plans should be agreed with the municipalities responsible for delivering these services. Best practices of high-speed rail systems in other countries should be followed.

    Once again accountability is a problem. To date no accountability mechanisms have been established to ensure agreement and planning for timely fire and emergency health services after Alto rail lines have been built and separated from roadways. Nor is there any body to which municipalities can seek recourse in case such agreement and planning do not occur, or in case agreements are not fulfilled. Government has an ethical obligation to establish such mechanisms before making a final investment decision.

    If the Frontenac/Napanee or northern shield corridors are chosen for HSR, existing VIA service will be impacted by service cuts as longer-distance travellers shift to HSR. At present Kingston is the fifth-busiest passenger train station in the country. There is a public need to maintain viable service for these passengers and others from stations along the existing VIA corridor. Moreover, community impacts from Alto would reach far beyond eastern Ontario. If 80% of VIA revenue currently comes from passengers travelling in the Windsor-Québec corridor, and much of this is diverted to Cadence as operator of HSR between Toronto and Québec, much less will be available to support other major VIA trains, such as: Montréal-Halifax (‘The Ocean’); Toronto-Vancouver (‘The Canadian’); Winnipeg-Churchill; Jasper-Prince Rupert; Sudbury-White River; Montréal-Jonquière/Senneterre. Allowing these train services to be degraded or discontinued would constitute a clear neglect of public interest. Accordingly, the Alto HSR Citizens Research Initiative has called for two immediate legislative responses:

    Statutory Service Guarantee for the Kingston SubdivisionAny federal legislation enabling ALTO must include a statutory charter guaranteeing minimum VIA Rail service levels on the Kingston Subdivision. The charter must specify minimum daily frequencies, protect morning and evening service windows, and require public consultation before schedule changes affecting intermediate communities.

    Dedicated, Legislated Funding for the National Rail NetworkParliament must establish a dedicated funding stream for VIA Rail’s non-corridor network — The Ocean, The Canadian, and remote services — entirely independent of corridor revenue that will transfer to Cadence. This fund must be protected as a condition of any ALTO implementation agreement.16

    The appropriate timing for such legislative action would be as close as possible to the final investment decision on the Alto project.

    Section 6

    Indigenous peoples’ consent

    Alto has stated, ‘We are committed to engaging in meaningful consultations with the aim of securing the Free, Prior, and Informed Consent (FPIC), of potentially impacted communities.’17 The phrasing is ambiguous. Are they committed to achieving FPIC, or only to holding ‘meaningful consultations with the aim’ of doing so? The UN Declaration on the Rights of Indigenous Peoples is unambiguous on this point.

    Meaningful consultation is not the end; it is only a means to achieving ‘free and informed consent prior to the approval of any project affecting their lands or territories and other resources’.

    The earlier High Frequency Rail project which preceded Alto included consultation with ‘more than 40 potentially impacted Indigenous communities and organizations’.19 However, that consultation focused entirely on supplementing the Request for Proposals with provisions for Indigenous social benefits and participation. There was no mention of consent with regard to impact on Indigenous territory; in any case, the Request for Proposals for HFR has been superseded by the Alto HSR proposal awarded to Cadence, now in co-development phase. Site selection and alignment have not yet been specified by Alto and Cadence. At the present time it is unclear whether any discussions have been undertaken with the Mohawk of the Bay of Quinte in Ontario or the Mohawk of Kanesatake in Quebec about use of or impact on their territories. Nor is there any evidence of commitment to recourse or accountability mechanisms for benefit/land/participation commitments that will be made to them.

    Section 7

    Environmental Impact

    For the route through the Frontenac Arch and Napanee Plain, environmental risks are significant. For the northern route largely over Canadian Shield, risks are less clear. For the southernmost corridor, environmental risks have already been incurred by the CN right of way and Highway 401; one would expect additional risks from HSR to be small by comparison. Doing nothing to shift travelers over to rail also incurs the environmental risks incurred by flying and driving, notably contributions to climate change. The difficult question is actually the normative question: which risks must be avoided? If worthwhile development is environmentally sustainable, then the answer is that we must avoid risks that are unsustainable, and this shifts the question to: what are the meaning and standards for sustainability?

    While precise answers to these normative questions are elusive, two broad ways of framing them have emerged over the past forty years to provide starting points for public deliberation about environmental risks. The 1987 Brundtland Commission proposed that development is sustainable when it meets the needs of present generations without jeopardizing the needs of future generations.20 More recently, the UNDP Human Development Report of 2020 called for steering development to ease the ‘planetary pressures’ that historical and contemporary social and economic development unleash.21 The main idea here is that development puts pressures on the planet, and the planet pushes back in ways that make present and future human flourishing more uncertain. At the extreme:

    Climate change and biodiversity integrity loss are tightly coupled core boundaries, and human activities are currently pushing both of them into a high-risk zone. If humanity breaches planetary boundaries too far or for too long, it may disrupt planetary life support systems, with substantial risks for human life as we know it.22

    The HSR corridor over part of the Frontenac Arch will also traverse an adjoining limestone plain surrounding the Napanee and Salmon Rivers. Under the limestone plain is found karst geology, featuring sinkholes, fissures, caves, and disappearing streams; above it are rare alvar ecosystems based on terrain with thin or no soil cover. These ecosystems harbour several species protected by the Species at Risk Act; it is doubtful that Alto could show that its construction can meet requirements of this Act. Construction would also affect subsurface water flows in unpredictable ways, possibly damaging freshwater access and use downstream. For other ecosystems in other places it may be possible to mitigate environmental impacts of HSR, as for example best practice standards have evolved in Europe for protecting essential pathways for migratory species. If such mitigation strategies can succeed for a CN/401 corridor, or for a northern shield corridor, they must be planned, budgeted, and carried out. However, in the Frontenac Arch and Napanee Plain these particular mitigation strategies may be of no use, due to the combination of karst geology below and alvar ecosystems above. Since biodiversity and freshwater access are two dimensions in which there are planetary boundaries, it follows that, in this corridor, an HSR line would be adding to planetary pressures rather than reducing them. Building HSR in the Frontenac/Napanee corridor, then, qualifies as environmental maldevelopment.23

    In the northern Shield corridor, biodiversity and freshwater impacts may be less pronounced and more amenable to mitigation. The HSR line and its construction are less likely to disrupt water flow in this corridor, where streams run parallel to rail alignment. The line would disrupt movement by larger mammals such as moose, elk, and bear, but these are not species at risk. More research is needed to determine what kinds of mitigation are required; international evidence suggests that there are few types of overpass that large mammals will actually use, and these are quite expensive.24 Effects on other species also requires further study and assessment. A clear standard for wildlife mitigation, with accountability mechanisms, is needed to ensure that adequate mitigation measures are chosen and implemented.

    Section 8

    Ranking the options: from morally worst to not so bad

    These two frameworks – future generations and planetary pressures – can help to orient discussion of environmental and social impacts in ethical, value-based terms. We can consider what will be the result of rolling out the various HSR options over multiple future generations. How will these decisions now affect planetary pressures exerted by humans then? Is it possible to assess or at least imagine how much closer to or in excess of planetary boundaries we get, in each scenario? In light of this, we can rank those options, as to how comparatively undesirable they are, from a development ethics perspective.

    The following rankings are only illustrative, expressing my own moral assessment, based on reasons for concern that I am aware of at the present time. This illustration, however, does have a point, namely that it is plausible and powerful to rank the options before us in terms of their enduring impact both to enhance human well-being and to reduce the dangerous pressures we are placing upon the planetary systems that sustain us. What we need, I conclude, is a public deliberation to make such a ranking.

    1
    Status quo.If there is no replacement for current VIA Rail levels of service, travelers will continue to be shunted into cars, buses, and airplanes to travel between Québec, Montréal, Ottawa, and Toronto (and indeed London and Windsor). The carbon footprint for this travel will grow apace. There being no other proposals on the horizon to compensate, I conclude that continuation of the status quo on VIA Rail will mean continued contribution to the death, illness, and destruction of property and habitats that result from carbon-induced climate change.
    2
    Frontenac/Napanee corridor, without mitigation.Mitigation for landowners and community safety are feasible and morally mandatory; however, for the sake of ranking consider the possibility that it is not carried out, so we have: unnecessary and inequitable loss to livelihoods and human security. In that respect, this option ranks worse than the following one:
    3
    Frontenac/Napanee corridor, with human/community mitigation.Well-being and equity issues in the previous option are removed, but, on the environmental side, ecological mitigation seems unlikely. Over many generations, then, the effects we can anticipate from HSR include (a) expansion of human well-being; (b) reduction in the particular pressures imposed by the carbon footprint of travel between Windsor and Québec; but (c) significantly increased planetary pressures both on biodiversity and on freshwater access.
    4
    Northern Canadian Shield corridor, without mitigation.Although much of this territory is more remote, there are still roads, tracks, and migratory paths that can be cut off by HSR fencing. Human security and wildlife migration will still be impacted unless mitigation measures are adopted.
    5
    Northern Canadian Shield corridor, with mitigation.With landowner and community mitigation, inequitable losses are reduced, so that we can anticipate (a) expansion of human well-being, along with (b) reduction in the particular pressures imposed by the carbon footprint of travel between Windsor and Québec; (c) with mitigation it may be possible to avoid increasing planetary pressures on biodiversity, but this is not perfectly clear, either; (d) adverse impacts on fresh water are less likely. Rolling this forward over multiple generations, we want to ensure monitoring for unforeseen environmental problems. This could be addressed by establishing capability in each region affected by HSR for ongoing environmental monitoring, funded by revenue sharing from operation of HSR service.
    6
    Southern CN/401 corridor, without mitigation.Because this corridor already exists, one might expect fewer new adverse impacts. However, without mitigation, mandatory grade separation and fencing will adversely affect humans and other species alike, which makes this option worse than the final one.
    7
    Southern CN/401 corridor, with mitigationfor community and wildlife impacts to highest standards of European/Asian HSR, with further direction from the environmental assessment. With landowner and community mitigation, inequitable losses are reduced, so that we can anticipate (a) expansion of human well-being. In addition, the problem of depriving service to Kingston is avoided. Over future generations we can also expect (b) reduction in the particular pressures imposed by the carbon footprint of travel between Windsor and Québec. Following best European/Asian practices, modified by site-specific environmental assessment, (c) with mitigation it may be possible to avoid increasing planetary pressures on biodiversity as well as (d) impacts on fresh water. Still, rolling this forward over multiple generations, we want to ensure monitoring for unforeseen environmental problems by establishing, in each affected region, capability for ongoing environmental monitoring, funded by revenue sharing from HSR operation.

    The worst option, according to this, is the status quo. Doing nothing now about intercity travel has the worst impact on well-being and planetary pressures for future generations. The Frontenac/Napanee options are not much better. An independent public panel, I believe, would confirm these rankings and could also shed more light on the others.

    Section 9

    Recommendations to the Government of Canada

    1
    Make corridor proposals public, including the CN/401 corridor. Immediately require Alto to develop and make public feasible alignment plans for (a) the CN/401 corridor, along with any alignment plans under active consideration for (b) the northern Canadian Shield corridor; and (c) the Frontenac/Napanee corridor. Require each of these plans to include cost estimates for wildlife and road crossings at high international standards, for land replacement to maintain farm viability, and for revenue sharing to fund ongoing monitoring of environmental impacts.
    2
    Make corridor choice a public choice. Prior to Final Investment Decision, appoint an independent public panel to recommend choice between corridor proposals (including the status quo), (a) on grounds of public interest, community impact, and environmental impacts/pressures; (b) considering these impacts for several generations (c) with powers to modify any proposals submitted, and (d) with a mandate to recommend mechanisms of recourse and accountability.
    3
    Obtain Indigenous peoples’ consent. Prior to Final Investment Decision, ensure that free and informed consent to impacts on their lands has been given by affected Indigenous peoples, along with mechanisms of recourse and accountability for community and environmental impacts on those lands as well as for commitments to Indigenous participation and community benefits.
    4
    Establish accountability mechanisms and environmental monitoring. Withhold Final Investment Decision until mechanisms of recourse and accountability have been established to support commitments for (a) landowners, (b) communities, (c) wildlife impacts, and (d) Indigenous communities. Do not invest in an HSR proposal that does not allocate revenue in the operational phase for ongoing regionally-controlled environmental monitoring.
    5
    Protect VIA Rail with legislation and funding. Establish service levels and funding streams for regional service along the Windsor-Montreal corridor and for VIA Rail’s non-corridor network – The Ocean, The Canadian, and remote services.
    Section 10

    Recommendations to Alto

    A1
    Corridor proposals. From the perspective of development ethics, corridor choice is not yours to make; this is properly a public choice. Accordingly, you are obligated to prepare development options for all of the feasible HSR corridors, to facilitate public choice among them.
    A2
    Request and obtain Indigenous people’s consent. Ensure that free and informed consent to impacts on their lands has been given by affected Indigenous peoples.
    A3
    Negotiate livelihood replacement. In negotiating with landowners, ensure that compensation covers livelihood replacement (including, for farmers, drainage and access to fields), including revenue sharing if necessary.
    A4
    Negotiate revenue sharing for ongoing regionally-controlled environmental monitoring during the operational phase.
    A5
    Negotiate mechanisms of recourse and accountability to support commitments made for (a) landowners, (b) communities, (c) wildlife impacts and environmental monitoring, and (d) Indigenous communities.
    References

    Notes

    1
    ALTO HSR Citizen Research Initiative, How History Led Us Here, March 2026, citizenresearch.ca/how-history-led-us-here, and Where We Stand on the Route, altohsrcitizenresearch.ca, accessed April 9, 2026.
    2
    Mahbub ul Haq, Reflections on Human Development (Oxford: Oxford University Press, 1995). Amartya Sen, Development as Freedom. (Cambridge, MA: Harvard University Press, 1999.
    3
    Peter Penz, Jay Drydyk, and Pablo Bose, Displacement by Development: Ethics, Rights, and Responsibilities (Cambridge: Cambridge University Press, 2011).
    4
    Smyth, Eddie, Susanna Price, and Frank Vanclay, ‘Fair and Equitable Land Access (FELA) by Development Projects: Enhancing Governance for Sustainable Development Outcomes When Projects Displace People,’ (Sustainable Development 2025, p. 3.
    5
    Ibid.
    6
    Penz, Drydyk, and Bose 2011, p. 211.
    7
    Union Internationale des Chemins de fer (UIC), ‘The Definition of High Speed Rail’ (UIC Communications: 2018). Accessed April 13, 2026. uic.org.
    8
    Wikipedia, ‘High-Speed Rail in Europe’ (March 31, 2026) en.wikipedia.org. Wikipedia, ‘Shinkansen’ (March 14, 2026) en.wikipedia.org.
    9
    While I find that this argument is sound, it is only fair to note that others disagree. The core argument I have outlined is supplemented with other lines of argument in Alto’s ‘Fast Forward’ document (Alto (VIA HFR – VIA TGF Inc.), ‘Fast Forward: Shaping Canada’s Future with a High-Speed Rail Network’ (March 2025) altotrain.ca) For opposing arguments see Tasnim Fariha, and David Jones, ‘High-Speed Potential, High-Stakes Decisions: The Policy Case for Alto’ (C.D. Howe Institute, December 11, 2025) cdhowe.org, Jerome Gessaroli, ‘Canada’s next Budget Bomb Is the Alto High-Speed Rail Project’ (Macdonald-Laurier Institute, January 14, 2026.) macdonaldlaurier.ca. The Citizens Research Initiative argues for upgrading the status quo to a ‘High Performance Rail’ system with top speeds not exceeding 200km/hr. (Where we Stand on the Route, op. cit.) For arguments that raise complications rather than expressing outright opposition, see also: Johnny Renton, ‘The Good, Bad and Awful of the Alto High Speed Rail Project, and How to Fix the Flaws and Concerns Surrounding It.’ (Substack: Next Stop, Downtown Canada, February 4, 2026) johnnyrenton.substack.com; Kathryn Smith Exon and Egon Terplan. ‘Keeping High-Speed Rail on Track: Learning from Other North American Projects’ (Toronto: School of Cities, June 6, 2025) schoolofcities.utoronto.ca; and Michael Schabas, ‘Alto Conceptual Design and Business Case” (January 12, 2026) available on Google Docs, Google Docs.
    10
    ALTO HSR Citizen Research Initiative, The Station Location Problem (2026) citizenresearch.ca/station-location.
    11
    Penz, Drydyk, and Bose, Chapter 7.
    12
    Nassir Mwanje, ‘Community Perceptions of Fair Compensation in Land Expropriation: Insights from Uganda through a Capability Approach’ (Journal of Human Development and Capabilities, forthcoming).
    13
    Ontario Federation of Agriculture, ‘High-Speed Rail’ (2026) ofa.on.ca/issues/high-speed-rail.
    14
    Alto (VIA HFR – VIA TGF Inc.), Advanced Engineering Driving High-Speed Rail (February 19, 2026) altotrain.ca.
    15
    ALTO HSR Citizen Research Initiative, Fire Services – Citizen Research (March 2026) citizenresearch.ca/fire-services, and Healthcare Access – Citizen Research (March 2026) citizenresearch.ca/healthcare-access.
    16
    ALTO HSR Citizen Research Initiative, ‘VIA Rail on the Kingston Subdivision: Service Erosion, Funding Collapse, and the National Rail Risk from ALTO HSR’ (April 2026) citizenresearch.ca/via-future.
    17
    Alto (VIA HFR – VIA TGF Inc.), ‘Building Together: Indigenous Partnerships in Alto’s Vision’ altotrain.ca.
    18
    United Nations, Declaration on the Rights of Indigenous Peoples (General Assembly, 2007) un.org
    19
    Alto (VIA HFR – VIA TGF Inc.). What We Heard & What We’re Doing Report. 2023. altotrain.ca.
    20
    World Commission on Environment and Development, Our Common Future (Oxford: Oxford University Press, 1987).
    21
    The ‘planetary pressures’ framework is based on several decades of ‘planetary boundaries’ research. To simplify: the core idea is that there are nine specific dimensions of planetary change that range from low risk to growing risk to high risk for human flourishing. Among these, ozone depletion, climate change, biodiversity, ocean acidification, land use change, and freshwater use are most familiar in the public sphere. A good entry point into the literature is Human Development Report 2020: The Next Frontier; Human Development and the Anthropocene, Chapter 2, ‘Unprecedented – The Scope, Scale and Speed of Human Pressures on the Planet’ (New York: UNDP, 2020), pp. 45-68.
    22
    UNDP op. cit., p. 51.
    23
    See Andrew Hyett, How Hydrology Shapes the Design – and Cost – of High-Speed Rail (March 2026) citizenresearch.ca, and the following publications by ALTO HSR Citizen Research Initiative (2026): Potential Effects of High-Speed Rail on the Napanee River citizenresearch.ca/napanee-river-2; A River in the Path of Two Rail Corridors citizenresearch.ca/salmon-river;
    24
    See Hyett op. cit. and two other publications of ALTO HSR Citizen Research Imitative (2026): The Wildlife Crossing Problem citizenresearch.ca/wildlife-crossings; Wildlife Connectivity, Hunting Heritage, and Game Species Habitat: Impacts of the Proposed ALTO High-Speed Rail Corridors citizenresearch.ca.
  • Undressing the addressable market

    Technical Brief · Corridor Demand

    Undressing the Addressable Market

    Alto’s demand case, read against the corridor’s roadside counts, its current population path, and the international reference class.

    ⚠ New Finding · The 95-million figure has no published source

    Alto’s April 2026 commentary states that “ninety-five million intercity trips take place each year between the cities Alto will serve,” rising to 140 million by 2049. The figure has been repeated across government communications and press coverage since. It does not appear in Alto’s own explanatory document Fast Forward (March 2025), the Corporate Plan Summary 2024-25 to 2028-29, or the June 2026 What We Heard consultation report. No independent analyst — C.D. Howe, the Munk School, McGill TRAM — has adopted it. The denominator that anchors Alto’s modest-quarter framing is stated in a commentary without any published derivation.

    Key Finding

    95 M → ~25 M.  Alto’s 95-million-intercity-trips figure counts every trip, by every mode, over every distance, across the whole corridor. The market a high-speed line can realistically serve — the longer, station-to-station journeys where rail competes with air and car — is roughly a quarter of it, about 25 million a year; the rest is short, regional, and off-corridor travel no train could carry.

    Central independent ridership sits at 8–9 million a year, rising toward 10 at maturity — less than half of Alto’s 24-million target. The three markets a fast service actually converts (car, air, and existing rail) sum to about that level. The reference-class floor from comparable car-dependent corridors is 4–5 million. Alto’s 24-million target stands alone above every published independent forecast.

    Download
    Undressing the Addressable Market — Full Brief (PDF)
    Technical brief with methodology, tables, figures, and full source citations

    Download PDF

    The Claim

    Alto’s demand case, in its own words

    In an April 17, 2026 opinion piece published in the Toronto Star and La Presse and reproduced on altotrain.ca, Alto’s chief executive set out the demand case for the Toronto–Québec City high-speed line. Its central figures are a headline market of ninety-five million intercity trips a year across the corridor, rising to one hundred and forty million by 2049; a population of eighteen million reaching twenty-two million within fifteen years; and a target of twenty-four million annual passengers by 2055, presented as consistent with international outcomes. The piece is framed to reassure — its very title insists that high-speed rail is no leap of faith.

    This brief tests the claim on its own terms. It does not dispute that the corridor is large, that it is growing, or that its intercity system is under strain — all three are true. It disputes the inference the commentary draws from them: that a twenty-four-million forecast is therefore measured, modest, and safe.

    Read against three independent bodies of evidence — the corridor’s roadside traffic counts, the population path Statistics Canada now projects, and the international record of what comparable high-speed lines actually carry — the demand case rests on optimistic framing rather than measurement. Where the commentary offers large round numbers and a single favourable analogue, the evidence points to central ridership near a third of the headline, and to a growth story built on a population Canada has already walked back.

    What the Evidence Shows

    Six findings

    The findings rest on four independent methods, each built to be reproducible from public data: a reference class of comparable corridors, a modal-shift ridership model, a market-by-market demand build-up, and a re-basing on Statistics Canada’s current population. A fifth lens — the standard appraisal treatment of optimism bias — governs how all four are read.

    Central independent ridership is 8–9 million a year, not 24

    Rising toward 10 at maturity. The risk-adjusted floor from comparable car-dependent corridors is 4–5 million. Alto’s 24-million target sits above every published independent forecast of the corridor.

    The demand builds from three real sources, not a 95-million abstraction

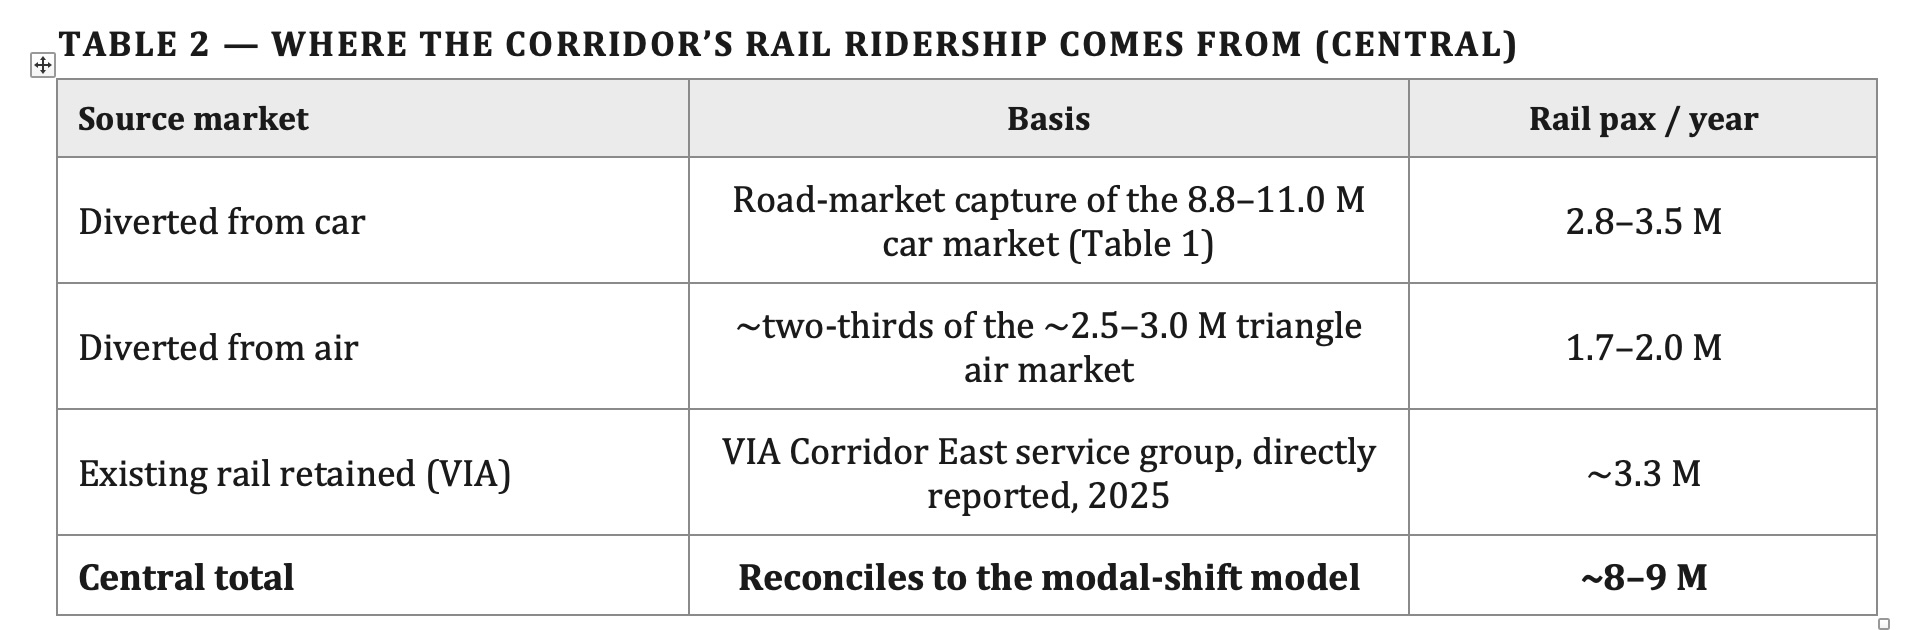
    The market a fast service actually converts is measurable: the cars crossing the corridor, the air travellers on the competitive pairs, and the existing VIA riders it retains. Added together — roughly 2.8–3.5 million from car, 1.7–2.0 million from air, and about 3.3 million retained rail (VIA’s directly reported 2025 Corridor East ridership) — they come to about 8 to 9 million. The 95-million figure is an all-modes, all-pairs total that no service captures.

    The 95-million figure itself is unsourced

    Stated in the commentary without citation, and absent from Fast Forward (March 2025), the Corporate Plan Summary 2024-25 to 2028-29, and the June 2026 What We Heard consultation report. No independent analyst has adopted it. The denominator that anchors the modest-quarter framing is not just broad but unpublished.

    The demand-growth story reverses the per-capita trend

    Ninety-five to one hundred and forty million over 2026–2049 is about 1.7 per cent a year, faster than the corridor’s own population growth. The gap implies rising travel per resident — against the grain of hybrid work and videoconferencing.

    The population base is the pre-cap one

    Twenty-two million in fifteen years extrapolates the 2015–2025 immigration surge. Statistics Canada’s January 2026 projection is lower; on the current path the corridor is about 6.3 million people smaller by 2055 than the counterfactual Alto’s numbers assume.

    The one comparator offered is a best case

    Madrid–Barcelona is among the strongest high-speed successes on record. The honest reference class — the full distribution of high-speed outcomes, many of which undershot their forecasts — brackets the answer far below 24 million.

    Method 1 · Reference Class

    What comparable corridors actually carry

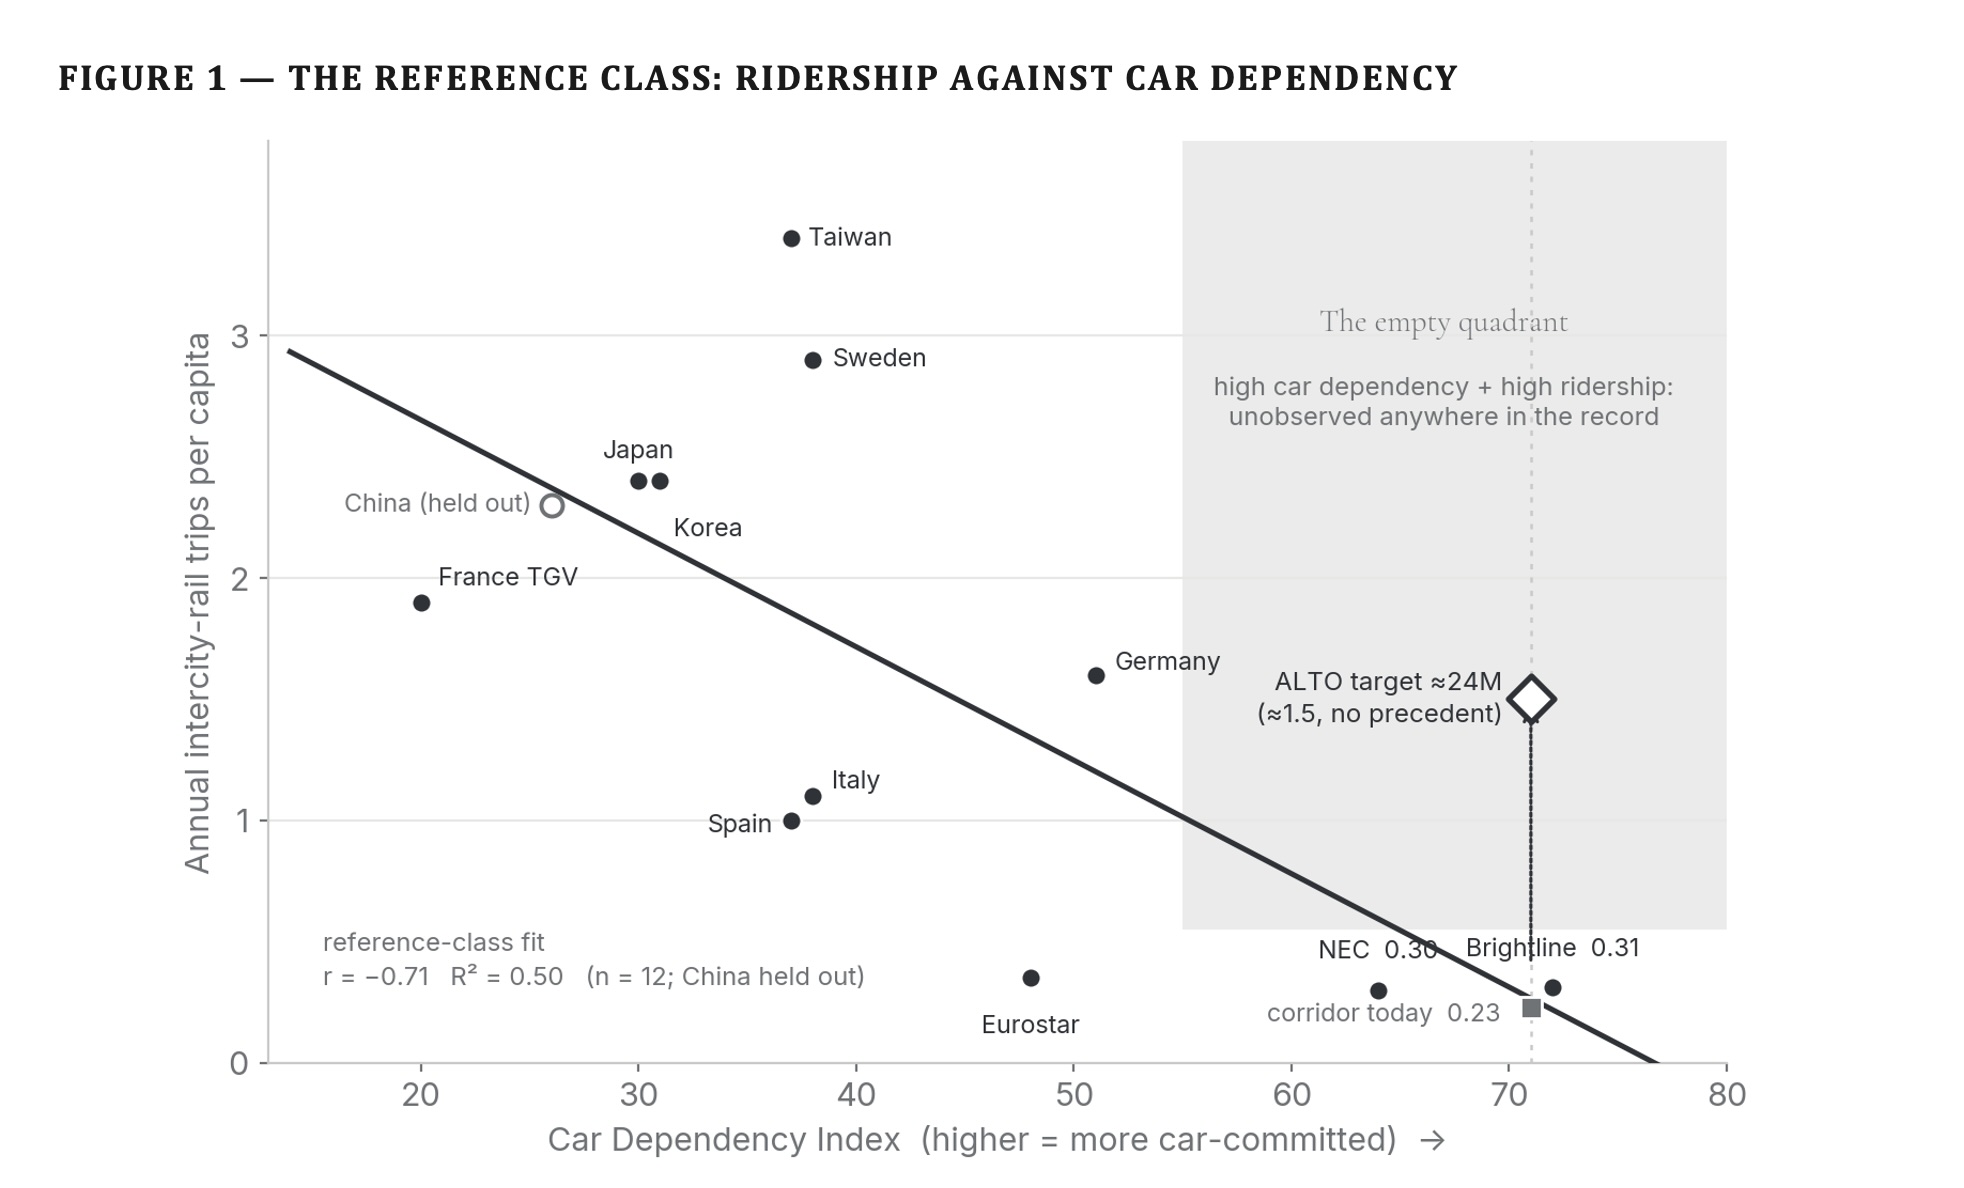
    Rather than model the corridor from assumptions, the reference-class method asks what corridors with similar car dependence, density, and trip lengths actually achieve once fast rail opens. Each candidate corridor is scored on a Car Dependency Index (CDI) — a composite of car mode share, population density, and transit provision at the endpoints. The Toronto–Québec City corridor’s high car dependence places it with reference cases that, rescaled to this line, carry the equivalent of roughly 4 to 5 million corridor trips a year at maturity. This is the risk-adjusted floor: what the evidence says the corridor is most likely to do before any speed, fare, or density assumption is layered on.

    Figure 1 — Comparable intercity-rail corridors plotted by their Car Dependency Index against annual ridership; the Toronto–Québec City corridor's high car dependence places it with reference cases carrying 4 to 5 million corridor trips a year.
    Figure 1 — The reference class: ridership against car dependency. Comparable intercity-rail corridors scored by their Car Dependency Index. The Toronto–Québec City corridor’s high car dependence places it with reference cases that, rescaled to this line, carry the equivalent of roughly 4 to 5 million corridor trips a year — the risk-adjusted floor.
    Methods 2 & 3 · The Three Markets

    Demand, counted not modelled

    A fast service on this corridor draws from three distinct current populations: the car market, the air market on the competitive city pairs, and the existing rail riders. Each is measurable from public data. Because they are distinct populations, they add without double-counting.

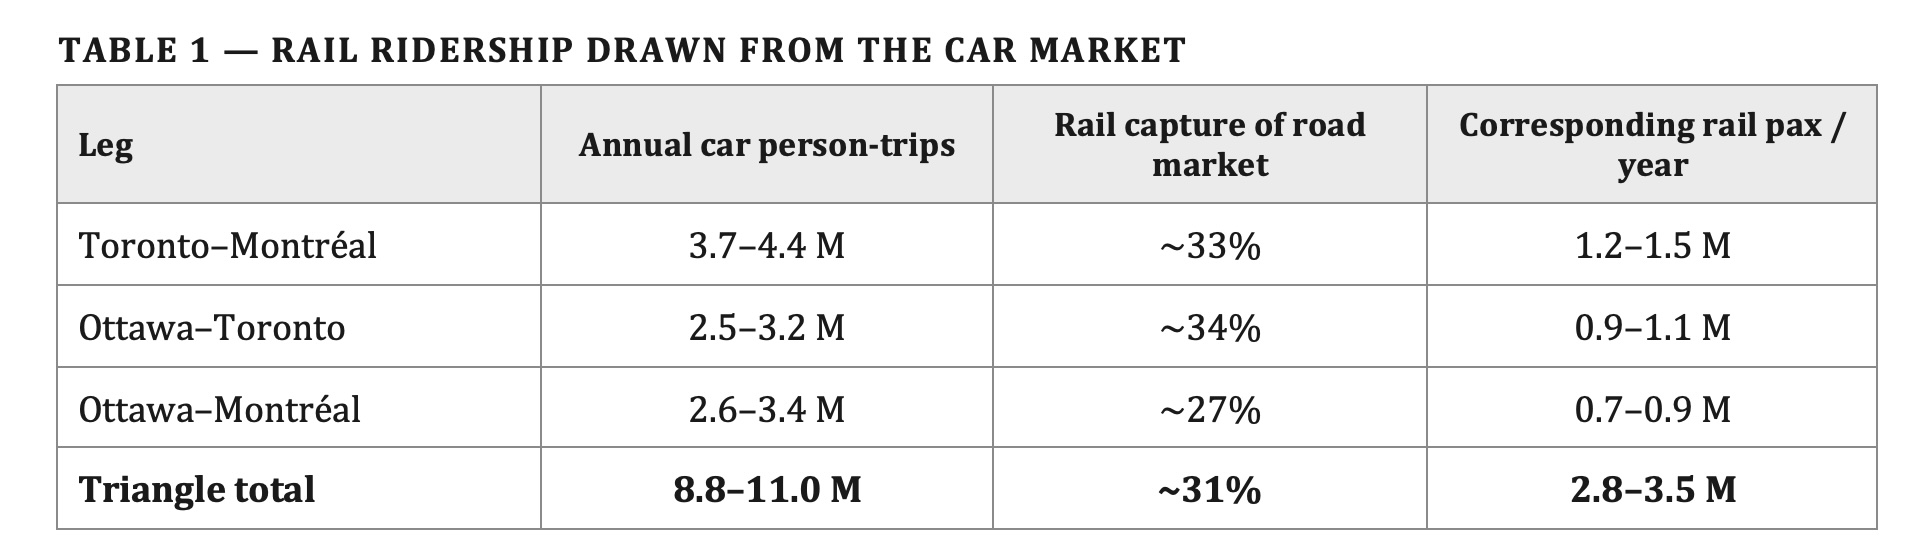
    The car market is read at the Highway 401 screenline where it crosses into Québec, after Ottawa-bound traffic has left via Highway 416 and Cornwall-local traffic has loaded, stripped of the 30 to 35 per cent commercial-truck share and short regional trips: roughly 8.8 to 11.0 million end-to-end car person-trips a year across the triangle at an occupancy of 2.0. Applying the road-market capture rates converts these into the rail ridership the car market alone would yield.

    Table 1 — Rail ridership drawn from the car market: per-leg car person-trips and rail capture rates for Toronto–Montréal, Ottawa–Toronto, and Ottawa–Montréal, summing to 2.8–3.5 million rail passengers per year from the car market.
    Table 1 — Rail ridership drawn from the car market. Capture rates are road-market shares from the modal-shift analysis at a moderate-fare regime; they express rail’s share of the combined car-and-rail market. Only Toronto–Montréal is confirmed by roadside counts; the Ottawa legs are demand-sized.

    The car market is only one of three. A fast corridor service also draws from the air travellers on the same city pairs, and it retains the passengers already riding the train. The corridor air market on the competitive pairs — Toronto–Montréal, Toronto–Ottawa, and the smaller Ottawa–Montréal — is on the order of 2.5 to 3.0 million point-to-point passengers a year, of which a fast train on these distances captures about two-thirds.

    Existing conventional rail is now reported directly in VIA’s 2025 annual results: 3.34 million passengers a year on the Corridor East service group (Québec City–Montréal–Ottawa–Toronto), within a Québec City–Windsor corridor total of 4.18 million. Essentially all of the triangle share is retained by a faster, more reliable service. VIA’s audited subsidy figures also fix the shape of the trip-length distribution: 48.51 dollars per passenger over 0.22 dollars per passenger-mile is an average trip of about 355 kilometres — roughly a third of the end-to-end corridor distance. Even the passengers already choosing rail are, on average, taking journeys well short of the full corridor.

    Table 2 — Where the corridor's rail ridership comes from: diversion from car (2.8–3.5M), diversion from air (1.7–2.0M), and existing VIA rail retained (~3.3M), summing to a central total of approximately 8–9 million rail passengers per year.
    Table 2 — Where the corridor’s rail ridership comes from (central). Car, air, and existing-rail travellers are distinct current populations, so the three sources add without double-counting. The rail line uses VIA’s Corridor East service group directly, rather than deriving a triangle share of the wider Québec City–Windsor total. The total is the central case around 2055; it rises toward 10 million at maturity as the ramp completes, and remains far below 24 million.
    Method 4 · The Population Basis

    The 6.3-million deficit

    Every ridership figure scales with the population beneath it, so the choice of population path is decisive. The brief uses Statistics Canada’s January 2026 projection (catalogue 17-20-0003), which incorporates the 2024–25 federal Immigration Levels Plan.

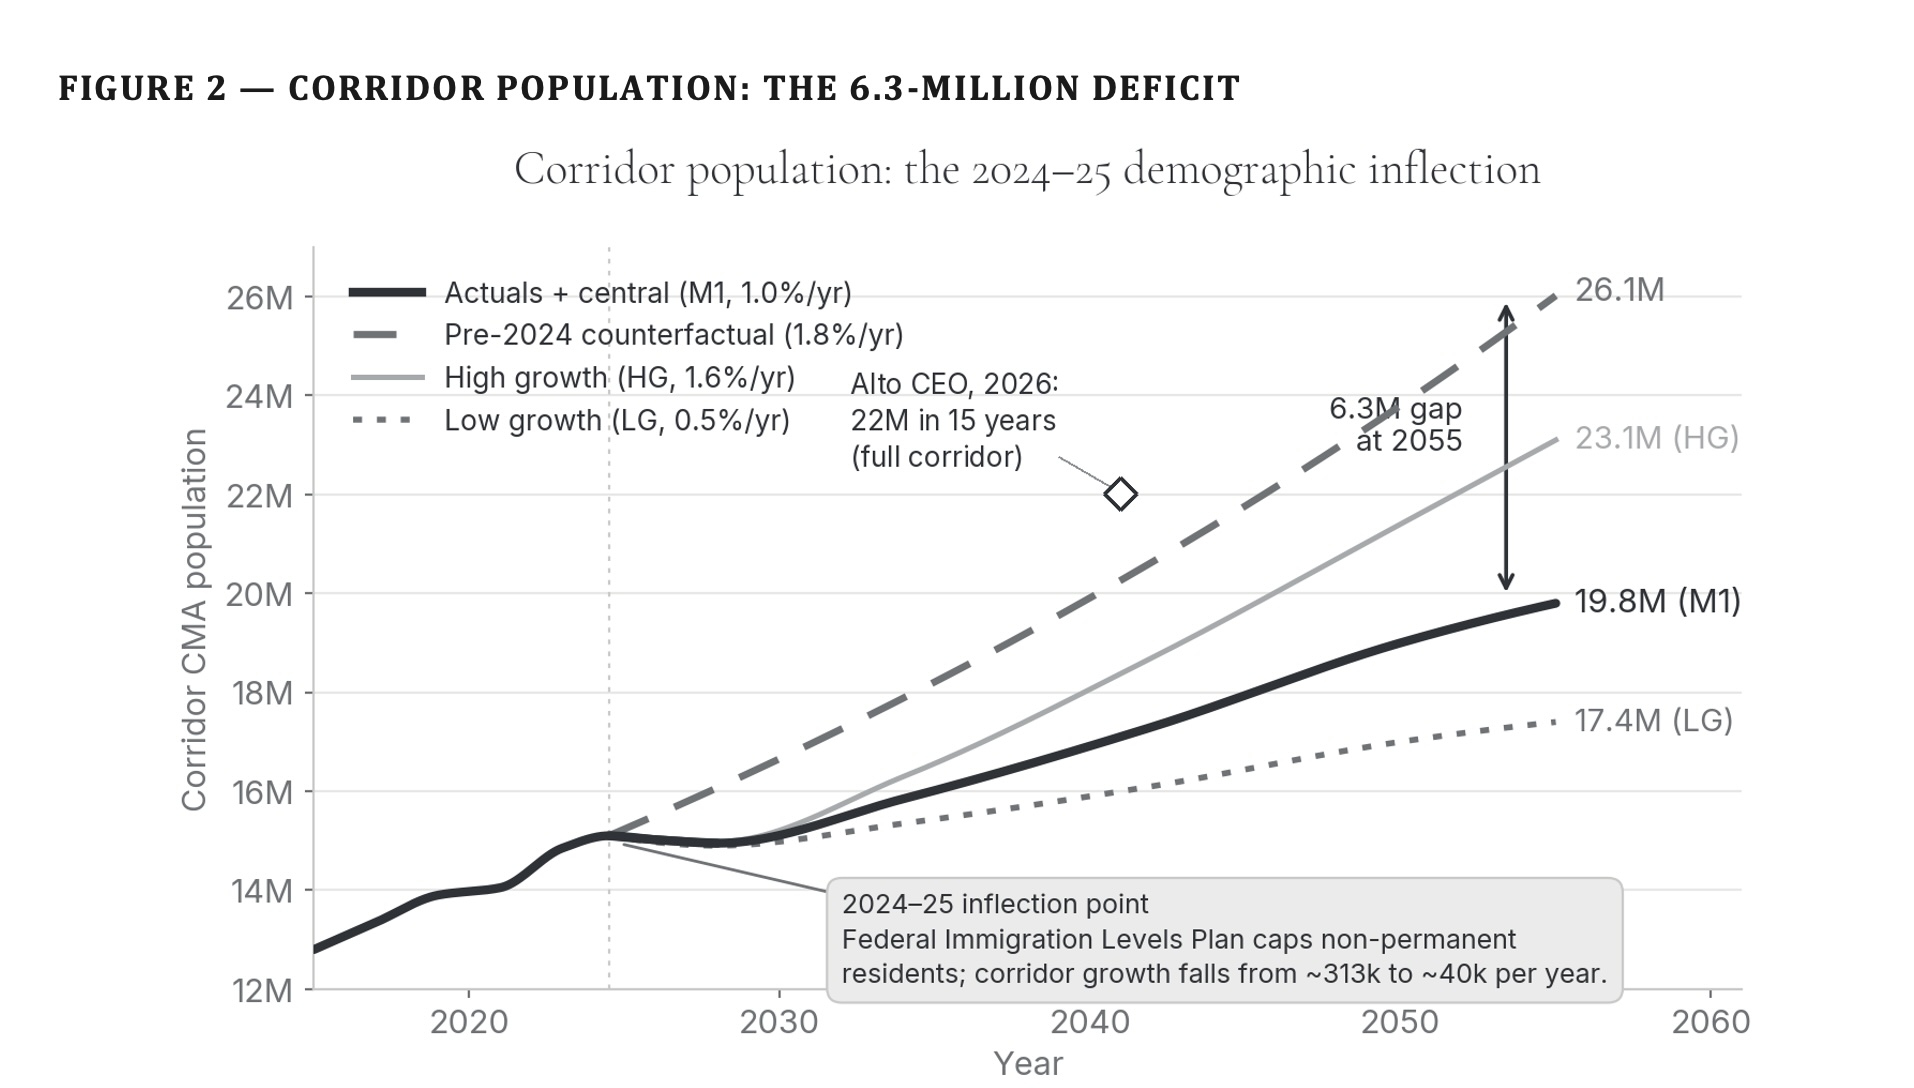
    Against the pre-2024 growth path that older corridor forecasts — and the commentary’s twenty-two-million figure — assume, this is materially lower: the corridor reaches about 19.8 million by 2055 on the current path, versus 26.1 million on the counterfactual, a deficit of 6.3 million. Because ridership scales with population, a forecast on the old path is inflated by roughly the same proportion the population has been cut — before any question of mode share or capture even arises.

    Figure 2 — Corridor population time series 2015–2060 showing four trajectories: pre-2024 counterfactual reaching 26.1M by 2055; Statistics Canada January 2026 central projection reaching 19.8M; high-growth 23.1M; low-growth 17.4M. Alto's CEO's 22M-in-fifteen-years forecast is marked as an outlier above the current path.
    Figure 2 — Corridor population: the 6.3-million deficit. The pre-2024 counterfactual (~1.8%/yr) reaches 26.1 million by 2055; Statistics Canada’s post-cap January 2026 projection (~1.0%/yr) reaches 19.8 million — a 6.3-million gap that every ridership figure scales with. The open diamond marks Alto’s own forecast of 22 million within fifteen years; its implied ~1.35%/yr growth runs above the current path.
    Triangulation

    Where Alto’s target sits against every independent forecast

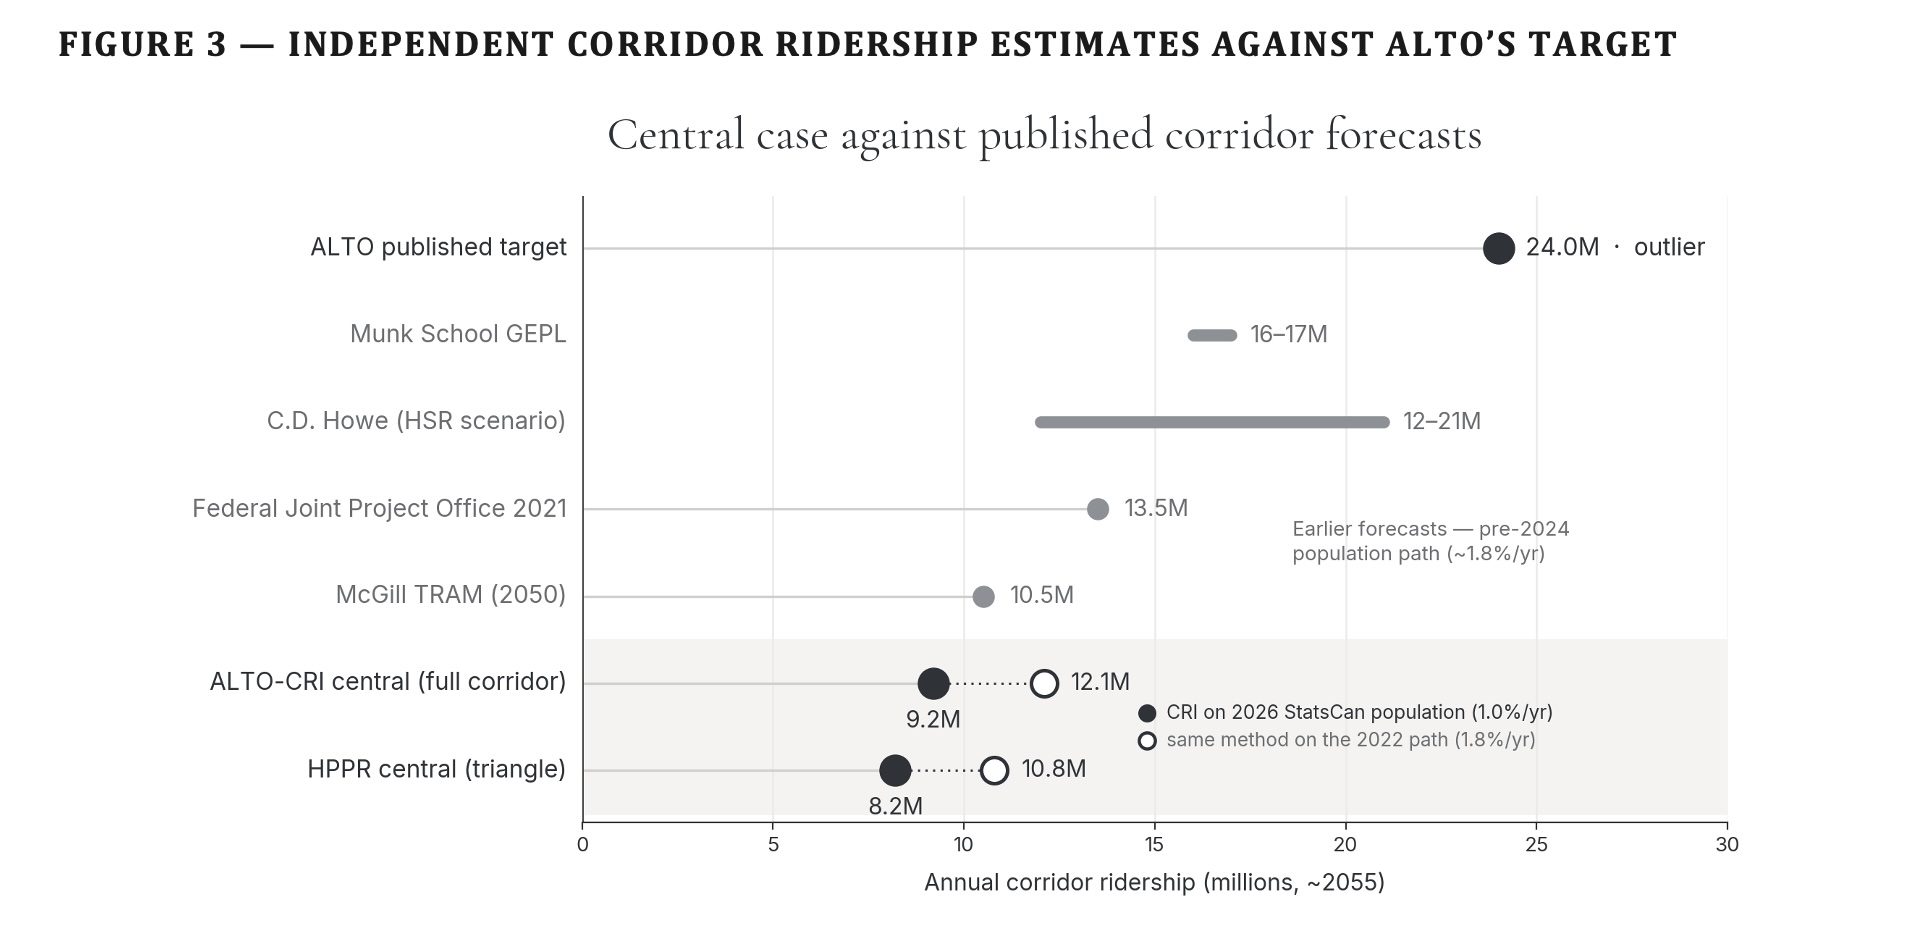
    The three methods converge. The demand-side build-up sums to about 8 to 9 million a year; the bottom-up modal-shift model lands in the same place; the reference class puts a floor near 4 to 5 million. Set beside the full band of independent corridor estimates, Alto’s 24-million target stands alone above every one.

    Figure 3 — Independent corridor ridership estimates around 2055. Alto's published target of 24.0M is shown as an outlier above every independent forecast: Munk School 16–17M, C.D. Howe 12–21M, Federal Joint Project Office 13.5M, McGill TRAM 10.5M, and the Initiative's own central case at 9.2–12.1M.
    Figure 3 — Independent corridor ridership estimates against Alto’s target. Annual corridor ridership around 2055. Alto’s 24-million target stands alone above every independent forecast — the Munk School, C.D. Howe, the Joint Project Office, and McGill — and above the Initiative’s own central case (filled markers). The open markers plot the Initiative’s method on the pre-2024 population Alto’s numbers assume; even then it stays within the published band, so the distance is population basis, not method.
    The Claim, Audited

    Where the 95-million figure appears — and where it doesn’t

    A demand denominator on which a $60–90 billion capital commitment rests should be reproducible from published sources. Alto’s is not. The ninety-five-million and one-hundred-and-forty-million figures are stated in the April 2026 commentary without citation and are absent from every canonical planning document the corporation has published.

    PresentImbleau, M., “High-speed rail is not a leap of faith: why it matters for Canada’s growth” — Op-ed, Toronto Star and La Presse, April 17, 2026; reproduced on altotrain.ca. The single document in which the 95-million and 140-million figures appear. Stated without citation, methodology, or reference to any underlying study.

    AbsentFast Forward: Shaping Canada’s Future with a High-Speed Rail Network (March 2025) — Alto’s own public-facing explanatory document. Discusses ridership growth from ~3 million (2024) to 24 million (2055) and 43 million (2084), but does not reference the 95-million intercity-trip figure or provide any market-total denominator on that scale.

    AbsentVIA HFR – VIA TGF Inc., Corporate Plan Summary 2024-25 to 2028-29 (November 2024) — the corporation’s tabled planning document referenced by the Library of Parliament backgrounder on the project. Contains ridership targets (“17 million by 2059” for HFR, before the HSR rebrand) but no 95-million total-market figure.

    AbsentJune 2026 What We Heard Report on the corridor study area — Alto’s own summary of the January–April 2026 consultation, running to more than 130 pages. Does not reference a 95-million figure.

    AbsentQuarterly Financial Reports through Q3 2025-26 — Alto’s mandatory reporting to Parliament. Does not reference a 95-million figure.

    AbsentIndependent published analyses of the corridor — the C.D. Howe Institute’s All Aboard study (March 2026), the Munk School Global Economic Policy Lab’s HSR analysis, Transportation Research at McGill’s corridor demand modelling, and Michael Schabas’s Senate submission on Bill C-15 (January 2026, 65 pp.). None uses the 95-million figure.

    The finding does not, on its own, resolve whether the 95-million figure is defensible. It resolves whether the figure is auditable. On the public record as it stands, it is not: no derivation has been published, no methodology has been described, and no independent source has adopted it.

    Recommendation

    Three things follow

    The demand case that anchors a 1,000-kilometre corridor, a $60–90 billion capital commitment, and a multi-decade delivery programme cannot responsibly rest on figures that have not been made auditable. Three steps would meet the standard.

    Release the demand model for independent audit

    A forecast that anchors an alignment and a multi-decade capital commitment cannot responsibly remain unpublished. In particular, the derivation of the ninety-five-million and one-hundred-and-forty-million intercity-trip figures cited in the April 2026 commentary should be published alongside the underlying model.

    Adjust toward the reference class and current population

    Standard megaproject appraisal requires promoter forecasts to be adjusted toward the reference class rather than accepted at face value. Alto’s should also be re-based on Statistics Canada’s January 2026 population projection, rather than the pre-2024 path the current forecast assumes.

    Size the corridor decision to the audited demand

    Not to a ninety-five-million headline or a twenty-four-million target that no independent method reaches. High-speed rail need not be a leap of faith. But the demand case as currently stated is closer to one than the corridor’s own numbers allow.

    Download Full Brief
    Undressing the Addressable Market (PDF)
    Full methodology, tables, figures, basis and limitations, and complete source citations

    Download PDF

    Sources

    Primary documents and data

    Every figure in this analysis is drawn from the public sources or companion analyses set out below and is reproducible from them. Sources are grouped by the claim or quantity they support.

    1.The claim examined. Imbleau, M., President and Chief Executive Officer of Alto. “High-speed rail is not a leap of faith: why it matters for Canada’s growth.” Commentary, altotrain.ca, April 17, 2026. altotrain.ca. The source, stated without further citation, of the ninety-five-million and one-hundred-and-forty-million intercity-trip figures, the eighteen-to-twenty-two-million population claim, and the twenty-four-million passenger target for 2055.

    2.Alto planning documents in which the 95-million figure does not appear. Alto, Fast Forward: Shaping Canada’s Future with a High-Speed Rail Network (March 2025). VIA HFR – VIA TGF Inc., Corporate Plan Summary 2024-25 – 2028-29. Alto, June 2026 What We Heard Report on the corridor study area public consultation. All at altotrain.ca.

    3.Companion research, Citizen Research Initiative. Intercity Car Trips Between Toronto, Ottawa and Montréal (2026) — road-side measurement of end-to-end car travel at the Highway 401 Québec-boundary screenline, the per-leg car person-trips of Table 1, and the road-market capture rates of Table 2. HPR Research Report — Ridership (2026) — the demand reference class and Car Dependency Index (Figure 1); the modal-shift model, R = P × μ × s × φ(t); the population basis (Figure 2) and the 6.3-million deficit; and the triangulation against independent forecasts (Figure 3). All at citizenresearch.ca.

    4.Traffic and travel-demand data. Ministry of Transportation of Ontario, Provincial Highways Traffic Volumes — annual average daily traffic on Highway 401, sections between the Highway 416 interchange and the Québec boundary. VIA Rail Canada, 2025 Annual Report (Montréal, March 2026): 4.40 million passengers system-wide and 986 million passenger-miles; 4.18 million on the Québec City–Windsor corridor and 3.34 million on the Corridor East service group; audited service-group subsidy figures implying an average Corridor East trip of about 355 kilometres. Statistics Canada, Air passenger traffic at Canadian airports (table 23-10-0253), together with airport-authority passenger statistics for Toronto Pearson, Montréal–Trudeau, and Ottawa Macdonald–Cartier. Transport Canada, Transportation in Canada annual report.

    5.Population. Statistics Canada, Population Projections for Canada, Provinces and Territories, January 2026 vintage (catalogue 17-20-0003), which incorporates the 2024–25 federal Immigration Levels Plan; and Census of Population, 2021, for the corridor’s census-metropolitan-area populations. These underpin the 19.8-million (post-cap) and 26.1-million (pre-2024 counterfactual) 2055 corridor figures and the 6.3-million deficit.

    6.Comparator corridor forecasts. Transport Canada and the EcoTrain consortium, Updated Feasibility Study of a High-Speed Rail Service in the Québec City–Windsor Corridor (2011). Federal Joint Project Office and the VIA High Frequency Rail baseline (2021). Transportation Research at McGill (TRAM), corridor demand modelling. C.D. Howe Institute (2026), high-speed-rail scenario. Munk School Global Economic Policy Lab, corridor demand. Schabas, M., Alto High-Speed Rail: Conceptual Design and Business Case, Senate submission on Bill C-15 (January 2026). These supply the independent ridership band of Figure 3.

    7.Forecasting method and optimism bias. B. Flyvbjerg, “Survival of the Unfittest: Why the Worst Infrastructure Gets Built — and What We Can Do About It” (Oxford Review of Economic Policy, 2009), and related work establishing reference-class forecasting; B. Flyvbjerg and D. Gardner, How Big Things Get Done (2023). HM Treasury (United Kingdom), The Green Book and its supplementary guidance on optimism bias. Oxford Global Projects, reference-class forecasting datasets and practice. UK National Audit Office, successive reports on High Speed 2 (HS2) documenting systematic optimism in demand forecasts and cost escalation.

    ALTO HSR Citizen Research Initiative  ·  citizenresearch.ca  ·  Corridor Demand Brief  ·  July 2026
    Independent, non-partisan research on the proposed Toronto–Québec City high-speed rail corridor.
  • Not off the hook

    CRI community brief · June 2026

    Not Off the Hook

    In Alto’s own words: why a Kingston station makes the southern corridor more uncertain for the communities around it, not less.

    Alto HSR Citizen Research Initiative · Independent & non-partisan

    The short version

    The June 22 announcement can feel like a finish line for the communities between Ottawa, Kingston and Peterborough. It is closer to a starting gun. Alto’s CEO has said the company is now “concentrating on the southern corridor,” that the corridor there is still wide, and that the alignment will be drawn “in the next few months.” A station in Kingston does not spare the townships the line must cross to reach it, instead, it commits the line to crossing them.

    Three reasons people think the fight is over and why each is wrong

    After a feel-good announcement, it is natural to assume the danger has passed. Here are the three readings going around the corridor, and why each one misreads what was actually said.

    What it feels like
    What is actually true
    “The route moved to Kingston, so my area is safe.”
    A station is a destination, not a route. The tracks still have to travel the whole Ottawa–Kingston–Peterborough band to get there. A Kingston stop does not lift the line off the surrounding townships; it commits the line to passing through them.
    “A decision was made.”
    It was not. The Minister directed Alto to study a southern option, hedged “subject to technical feasibility and project requirements.” The alignment for this segment is not chosen until the 2027 consultation, with the impact assessment to follow.
    “If I’m not right on the 401, I’m fine.”
    Alto’s CEO said the line will not follow the 401 the whole way, and that the Ottawa-to-near-Kingston stretch is “probably too curvy.” That means the inland, off-highway countryside is exactly where the route is still open.

    What the CEO actually said

    In an interview the day of the announcement, Alto’s president and CEO described a search area that is widening, not closing. He said the northern route along the Highway 7 corridor has not been scrapped, it is “not off the table”. However, the likelihood of going back north is “less and less obvious,” because the company is now “concentrating on the southern corridor.”

    He described the corridor between Ottawa, Kingston and Peterborough as still “fairly wide,” and said the job over the next few months is to determine how to get from Ottawa to Kingston with the “alignment of least impact” by following existing infrastructure where possible and trying to limit impact on the agricultural sector. He added that the line likely would not follow Highway 401 entirely, and that the Ottawa-to-near-Kingston stretch is too curvy to use the highway as a corridor there.

    Read together, those statements describe the southern band as the primary search area, still wide, and actively being drawn right now. That is the opposite of a settled outcome according to Alto’s CEO.

    A wider search area, not a narrower one

    “Wide corridor” is Alto’s own phrase, and a wide corridor means nothing inside it is fixed. The band still runs from Ottawa to Peterborough by way of Kingston, and the communities inside it — among them Stone Mills, Greater Napanee, Tyendinaga, Rideau Lakes, Tay Valley and South Frontenac — are not on the edge of this decision. They are inside the active study area. Adding Kingston as a destination does not shrink that band; it gives the line a reason to run through the middle of it.

    “Least impact” is a promise, not a plan

    The reassuring language — “least impact,” “follow existing infrastructure,” “limit impact on agriculture” — is worth reading carefully. None of it is defined, none of it is published, and none of it is a commitment any community can hold Alto to yet. “Least impact” still means an impact, on someone, somewhere; and the decision to avoid the 401 where it is too curvy means the alternative runs through open farmland and rural settlement. A goal stated in an interview is not a protection written into a route.

    It is also the moment to keep the alternative on the table. Many residents told the consultation they would rather see existing rail service improved first (we call it High Performance Rail) before a new line is carved through the countryside. That option does not disappear because a station was named; it is exactly the question a wide-open corridor should still be asking.

    The clock, and why now is the moment

    The decision that affects you has not happened. Here is when it does.

    This fall (2026)
    Alto narrows the Central segment (Ottawa–Montréal) corridor and runs another round of public consultation.
    2027
    Consultation on the western segment (Toronto–Ottawa) — which contains the Peterborough–Ottawa southern option and the Kingston question — the segment that decides the route through these communities.
    ~January 2027
    The federal impact assessment is expected to begin and run about two years, with its own input opportunities.

    The alignment is on the drawing board over the next few months. The relief that follows a feel-good announcement is exactly what empties the room while the line is being drawn. The communities that stay organized and on the record are the ones whose concerns will define what “least impact” ends up meaning.

    What keeps your community on the map

    • Stay organized across township lines. The corridor crosses many municipalities; the case is strongest when those communities speak together rather than each assuming the line will land on someone else.
    • Document your property now. Photographs, surveys, drainage, wells and septic, farm operations and field connectivity. A clear record is your strongest tool the moment a route is proposed nearby.
    • Put your council and your MP on record. Municipal resolutions and parliamentary questions can demand the alignment criteria and the evidence. Keep your community’s position documented before the route is drawn.
    • Ask to see the rules. “Least impact” should come with published criteria and weightings. Ask for them. A standard you cannot read is a standard no one can be held to.
    • Mark the dates. Fall 2026 (Central), 2027 (your segment), and the impact assessment. Those are the rooms where the route is decided: be in them.

    A station for Kingston is not a reprieve for the corridor. The line still has to get there. Alto has said it has not decided how.

    Download the full brief (PDF)

    Sources

    1. Elliot Ferguson, “Alto CEO says there are options to add Kingston to rail project,” Kingston Whig-Standard, June 22, 2026.
    2. Transport Canada, news release on the What We Heard report and Kingston as a potential stop, June 22, 2026. canada.ca
    3. Alto, Public Consultation — What We Heard Report, Corridor Study Area (134 pp), June 2026. altotrain.ca

    Quoted phrases are the words of Alto’s president and CEO as reported in the Kingston Whig-Standard interview of June 22, 2026. The Alto HSR Citizen Research Initiative is an independent, non-partisan research project examining the proposed corridor through Eastern Ontario.

  • Modal shift HSR car

    Citizen Research Initiative · Modal Shift Analysis · Note 2

    Modal Shift Between Rail and Car on the ALTO Corridor

    The car competes with rail at every distance, costs are weighed on fuel rather than full economics, and a full car of four tilts the comparison decisively toward driving. Why North American road–rail substitution is structurally harder — and how much of it ALTO’s speed actually buys.

    ⚠ What This Note Examines

    This note applies the evidence on rail–car substitution to the two principal corridor pairs — Toronto–Ottawa and Toronto–Montréal — in the North American context, comparing current VIA Rail, a High Performance Rail (HPR) alternative at 200 km/h, and ALTO at 300+ km/h.

    The road–rail comparison differs structurally from the rail–air analysis in Note 1: the car carries no fixed access penalty, perceived driving cost is dominated by fuel rather than full lifecycle cost, group travel decisively favours the car, and modal choice is more responsive to price than to time.

    Summary

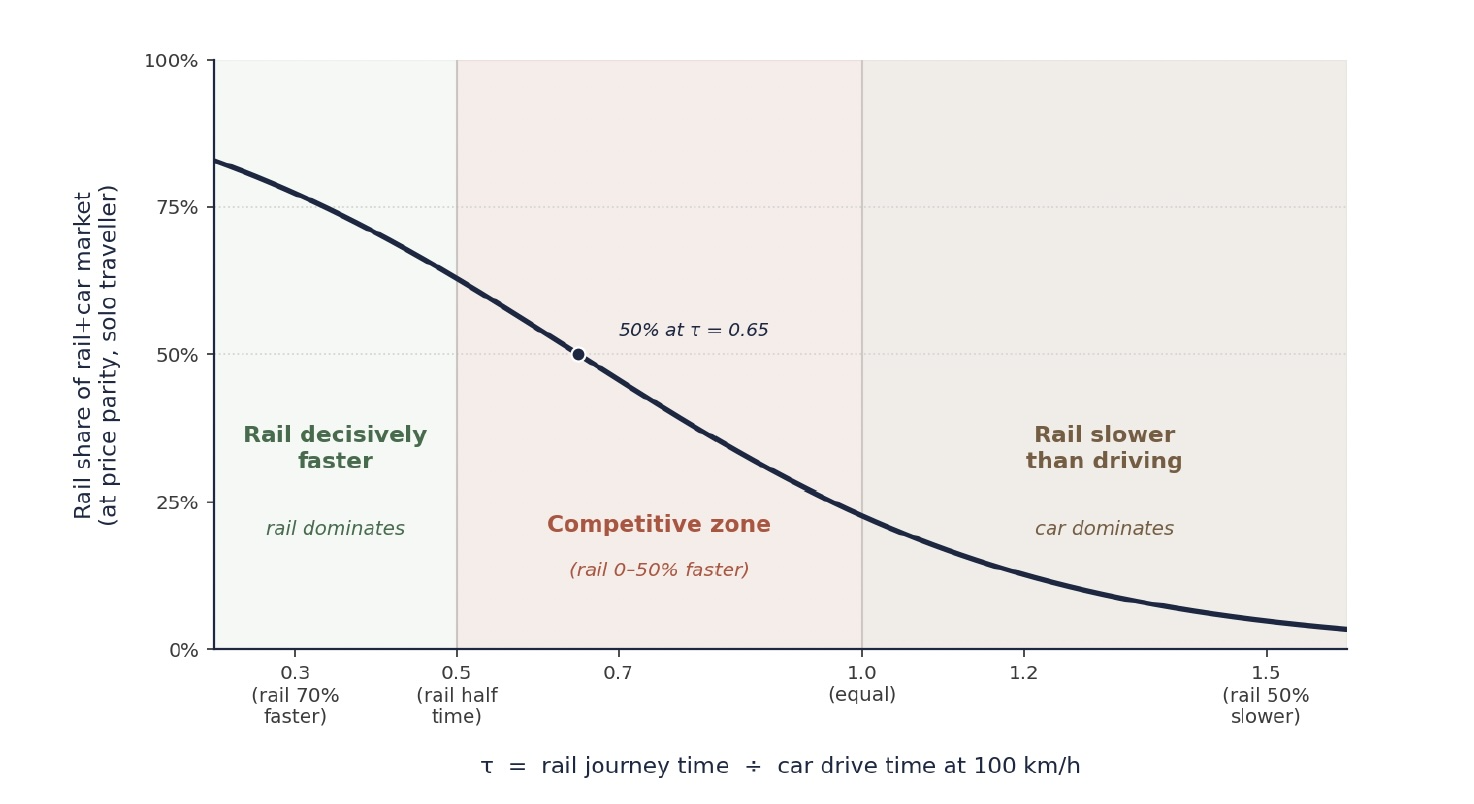
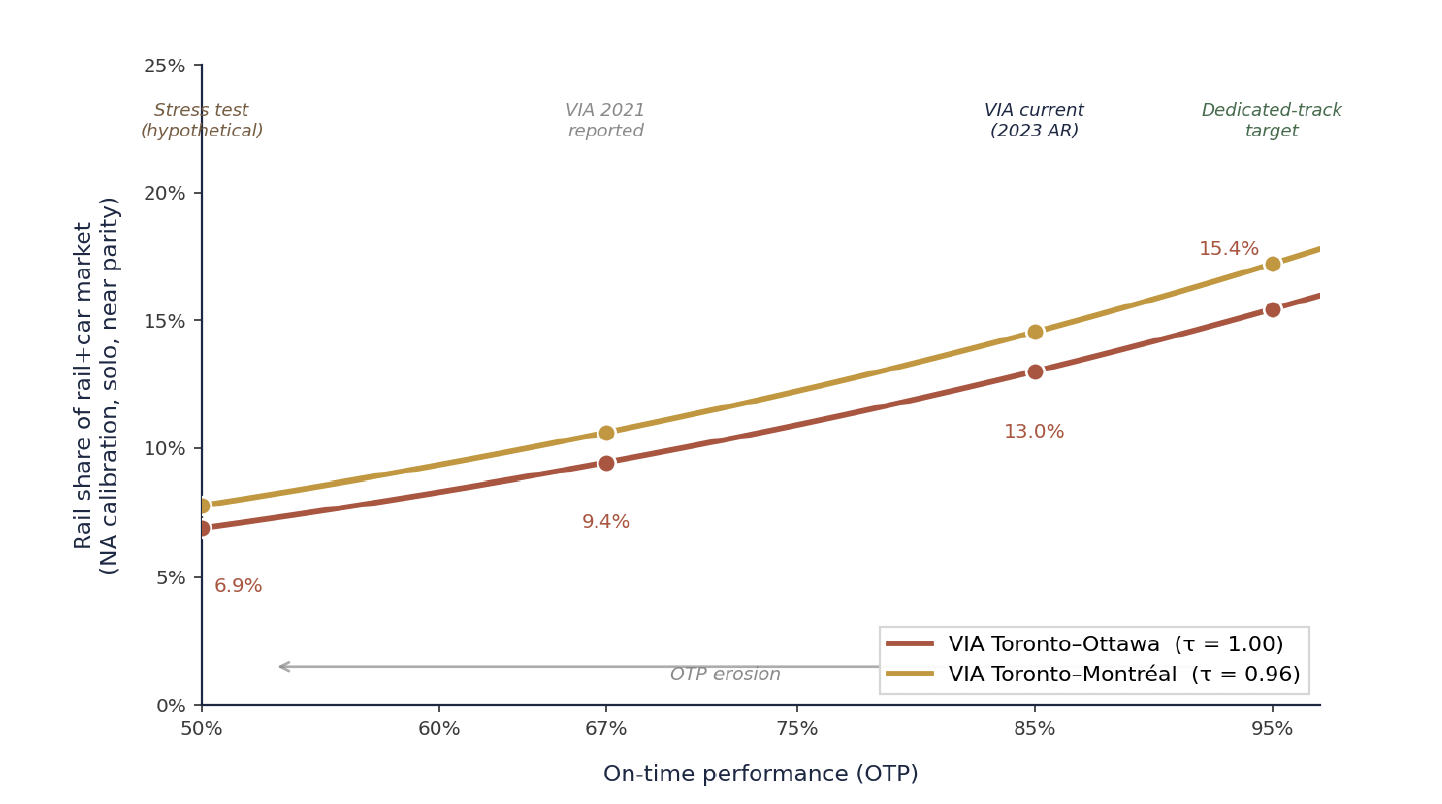
    The right competitive variable is not absolute rail time but the ratio τ of rail time to car drive time: τ = 0.5 means rail takes half as long as driving, τ = 1.0 means equal time. Because car drive time scales with distance, the same τ implies the same competitive geometry on any route length.

    The corridor’s road-substitutable demand is far larger than its air-substitutable demand — highway flow on the 401 between Toronto, Kingston, Ottawa and Montréal is several times the corridor’s annual air person-trips. Three structural features make North-American competition harder than European comparators: the 401/A20 is toll-free end-to-end, there is no congestion charging anywhere in Canada, and per-person car cost divides among occupants while rail charges per ticket. A family of four faces a per-person rail-to-car price ratio four times higher than a solo traveller.

    Under canonical conditions — solo traveller, current Canadian gas prices, near-parity pricing — on a North-American–calibrated curve anchored on VIA’s ~13% rail share, the model predicts ALTO captures about 51% of the rail+car market on Toronto–Ottawa and 41% on Toronto–Montréal; HPR captures about 33% on both. European-equivalent upper bounds — readings that would apply only if North American transport policy shifted toward European fuel taxes, tolls and station-area land use — are 67% and 58% for ALTO and around 50% for HPR.

    Download
    Modal Shift Note 2 — Road–Rail Research Note (PDF)
    The full 26-page note with all eleven figures, the European and North-American calibrations, the group-size and gas-price levers, the reliability analysis, and the methodology and sources
    Download PDF
    1 · Travel Time

    The competitive zone for road

    The literature on rail–car substitution differs sharply from the rail–air literature. The car carries no fixed time penalty equivalent to airport access, security and downtown-airport transit; parked at origin and arriving at destination, it has near-zero access cost on both ends, and its line-haul time degrades only slightly across the 100–1,000 km range. The result is that car competes against rail at every distance — including short-haul corridors where rail would dominate the air comparison.

    The right measure is therefore not absolute rail journey time but the ratio of rail time to car time. Defining τ = (rail time) ÷ (car drive time at 100 km/h) gives a distance-invariant measure of rail’s advantage: τ = 0.5 means rail takes half as long as driving; τ = 1.0 means equal time; τ > 1.0 means rail is slower. A 3-hour rail journey on a 540 km route (τ = 0.56) is competitively equivalent to a 1.5-hour journey on a 270 km route. This is the key structural difference from the rail-vs-air analysis, where rail’s fixed advantage at the access stage means absolute time is what matters.

    Road-rail modal-shift S-curve plotting rail share of the rail+car market against the time ratio tau, European calibration
    Figure 1. Modal-shift S-curve for rail–car substitution, plotting rail’s predicted share of the combined rail+car market against the time ratio τ = (rail journey time) ÷ (car drive time at 100 km/h). Logistic curve fitted with inflection at τ = 0.65 (rail captures 50% at price parity when ~35% faster than driving). Three zones: rail decisively faster (τ < 0.5); the competitive zone (0.5 < τ < 1.0); and rail slower than driving (τ > 1.0). Calibrated against the TGV Paris–Lyon pre/post comparison.

    The European calibration in Figure 1 represents what rail can achieve under conditions that favour modal shift — high fuel taxes, congestion charging, dense feeder transit, central stations, and a cultural baseline of rail use. North American conditions are systematically less favourable, and the same τ produces lower rail shares.

    North-American-calibrated S-curve anchored on current VIA Rail's 13% rail share, with the European curve shown for comparison
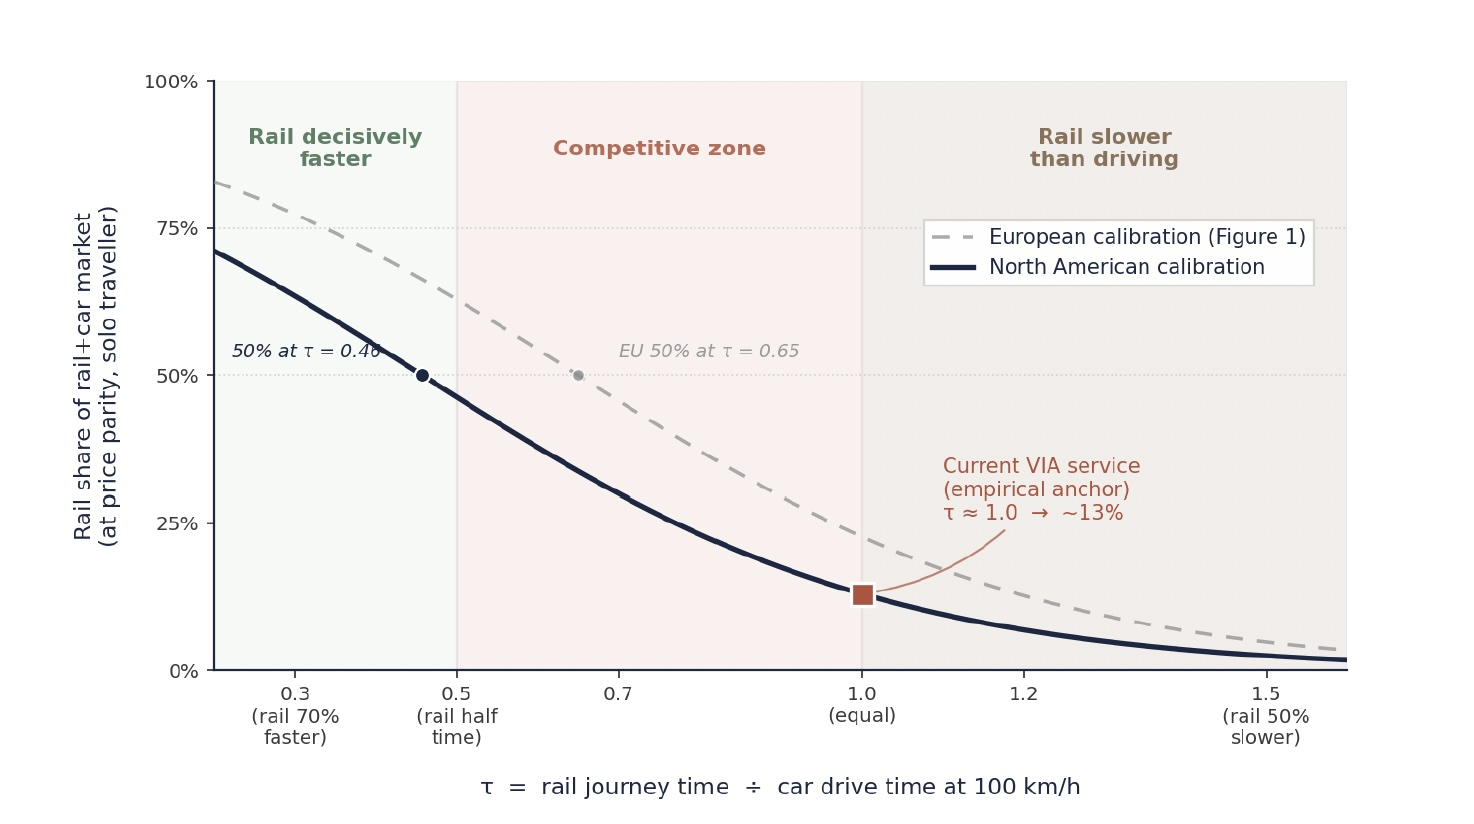
    Figure 1b. North-American–calibrated S-curve, anchored on current VIA Rail service (~13% rail share of the rail+car market at τ ≈ 1.0). The faded grey dashed curve is the European calibration from Figure 1. Inflection shifts left from τ = 0.65 to τ = 0.46: under North American conditions, rail must be ~54% faster than driving — rather than 35% — to capture half the market at parity. Equivalent to a constant utility penalty α ≈ 0.67 reflecting toll-free highways, low fuel taxes, free parking, dispersed land use, weak feeder transit, and a cultural autonomy preference.

    Read together, Figures 1 and 1b bracket the realistic range. The European curve represents what is achievable in principle if rail-favourable conditions were created; the NA curve gives what is achievable under prevailing structural conditions. The remainder of this note uses the NA calibration, with European-equivalent figures quoted alongside where the comparison is informative. The gap between them is policy-relevant: roughly 10 to 15 percentage points of modal share depend not on which infrastructure is built but on whether the broader transport-policy environment supports modal shift.

    Empirical anchors and the North American context

    The Paris–Lyon TGV cut journey time from ~4 hours to under 2 and lifted rail’s share against road from ~30% to ~67% — a 37-point shift. Madrid–Barcelona AVE and Tokyo–Osaka Shinkansen deliver comparable shares against parallel highways. But all operate under conditions the corridor does not share. North America carries none of these reinforcements: the 401/A20 is toll-free end-to-end, Canadian fuel taxes are roughly one-third of European levels, there is no congestion charging in any Canadian city, and land use at both ends is car-oriented. The cross-elasticity literature confirms rail and car barely substitute — a 10% rise in fuel prices produces only a 1 to 4% rise in transit ridership.

    Rail’s competitive position against the car turns on the time ratio τ, not absolute journey time. The North American absence of tolls, congestion charges, and high fuel taxes means realised modal share will likely sit substantially below the European-anchored model’s predictions.
    2 · Price

    Elasticity, group size, and perceived cost

    The road–rail price comparison differs from rail–air in three ways: the elasticity of substitution is higher, the per-person ratio depends decisively on group size, and the cost of driving travellers actually weigh is the perceived cost (mostly fuel), not the full economic cost. The same logit form applies, but with a larger price coefficient (γ = 1.5 against 1.0 for rail–air), reflecting own-price elasticities of −1.0 to −1.6 for leisure demand against −0.4 to −0.7 for business.

    European price family

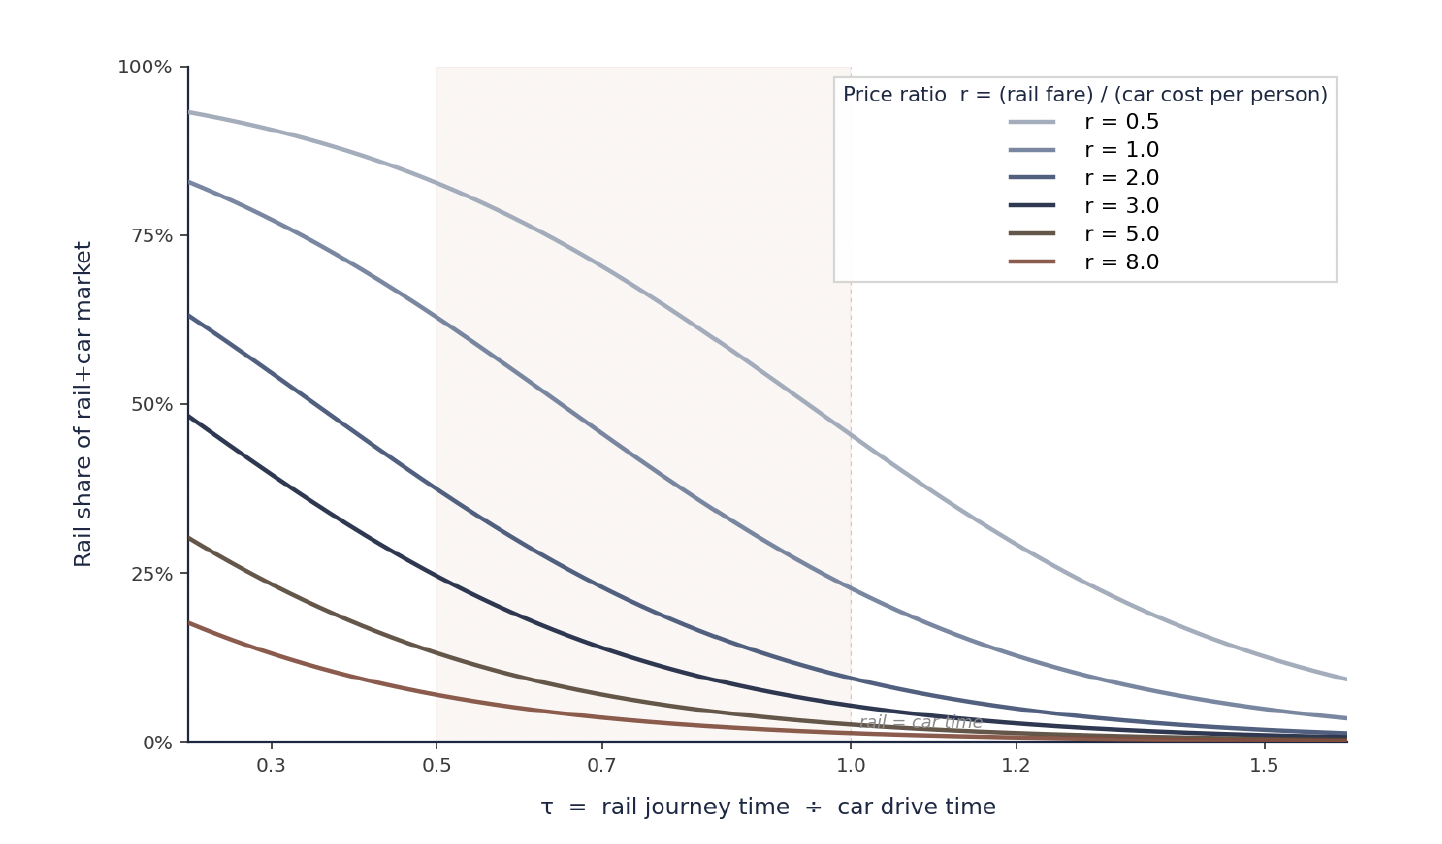
    Figure 2a shows the curve family at six price ratios under the European calibration. The wide range (0.5 to 8.0) reflects that group travel can drive the per-person ratio well above 5 even at parity-pricing intentions, since car cost divides among occupants while rail fare does not.

    North American price family

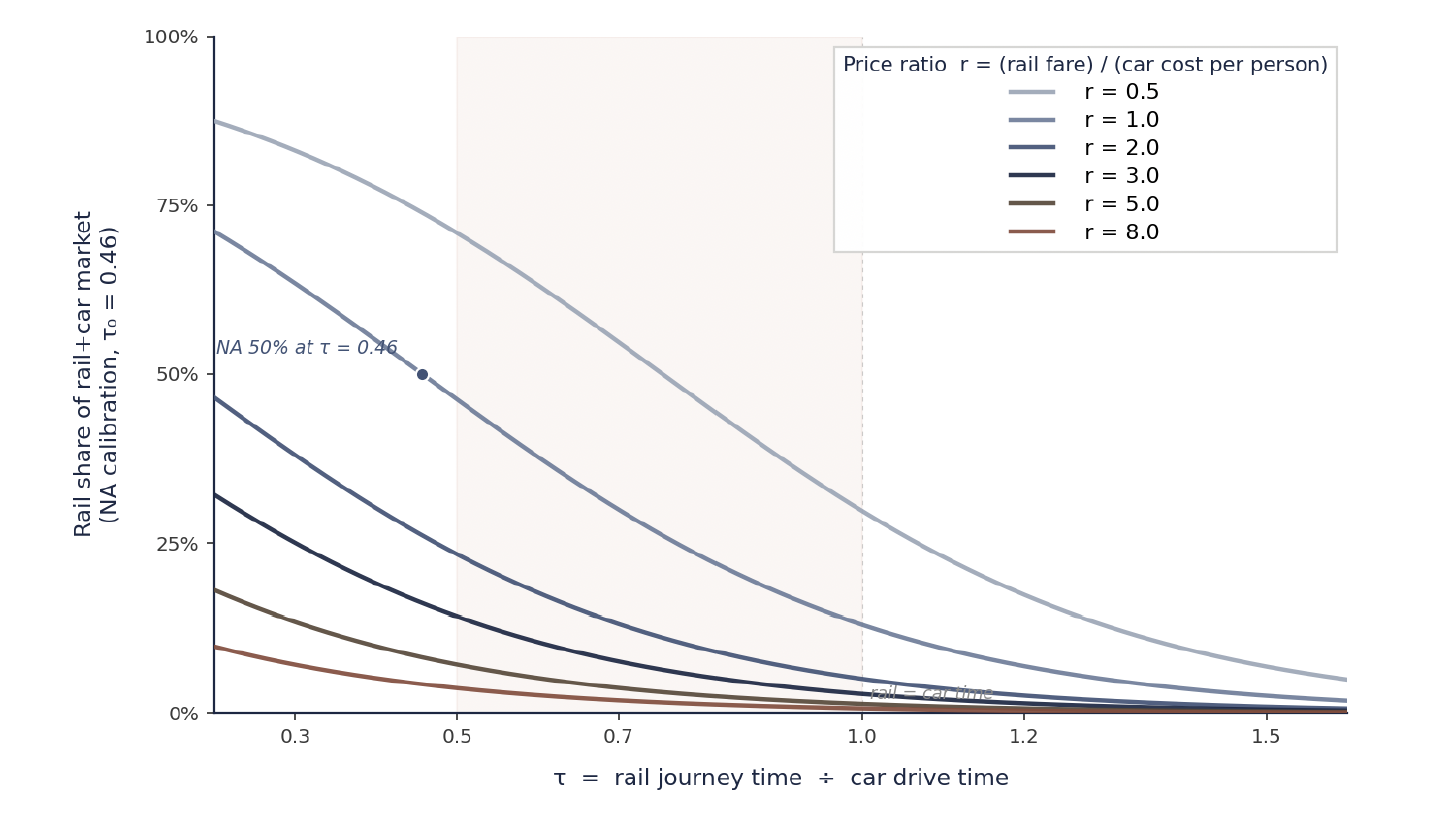
    Figure 2b applies the same six ratios under the NA calibration (τ₀ = 0.46). Each curve sits 15 to 20 points below its European counterpart at every τ. This family drives the corridor predictions in the rest of the note.

    Family of road-rail S-curves at six rail-to-car price ratios, European calibration
    Figure 2a. Family of road–rail S-curves at six rail-to-car-per-person price ratios (r = rail fare ÷ car cost per person), European calibration. The middle navy curve at r = 1.0 is price parity. The family spans 0.5 to 8.0, reflecting that group travel can push the per-person ratio well above 5.
    Family of road-rail S-curves at six price ratios, North American calibration
    Figure 2b. The same six ratios under the North American calibration (τ₀ = 0.46). Each curve sits 15 to 20 points below its European counterpart. This family is used throughout the rest of the note.

    Perceived versus full cost of driving

    Drivers compare rail fare against the perceived cost of driving, not the full economic cost. On Toronto–Montréal, one-way fuel for a typical car (9.4 L/100 km at ~$1.65/L) is about $84; the full economic cost — depreciation, insurance, maintenance — is more than three times that, around $300. But fixed costs are not perceived at the moment of choice; the car is owned regardless. A VIA Economy fare of ~$80 against perceived car cost of $84 produces a price ratio near 1.0 for a solo traveller. Against full cost the same fare would imply a ratio of 0.27 — and would predict a far larger rail share than the corridor actually carries, the empirical tell that perceived cost is the right input.

    The group-size effect

    Cars carry one to four passengers at a single fuel cost; rail charges per ticket. The per-person rail-to-car ratio is therefore ~1.0 for a solo traveller, 1.9 for a couple, 2.9 for three, and 3.8 for a full car of four. Family travel and any leisure trip with two or more travellers structurally favours the car — a multiplier with no analogue in the rail–air comparison. At parity pricing, ALTO’s Toronto–Ottawa share drops from ~51% solo to ~12% for a family of four; on Toronto–Montréal from 41% to 8%.

    Gas price as a modal-shift lever

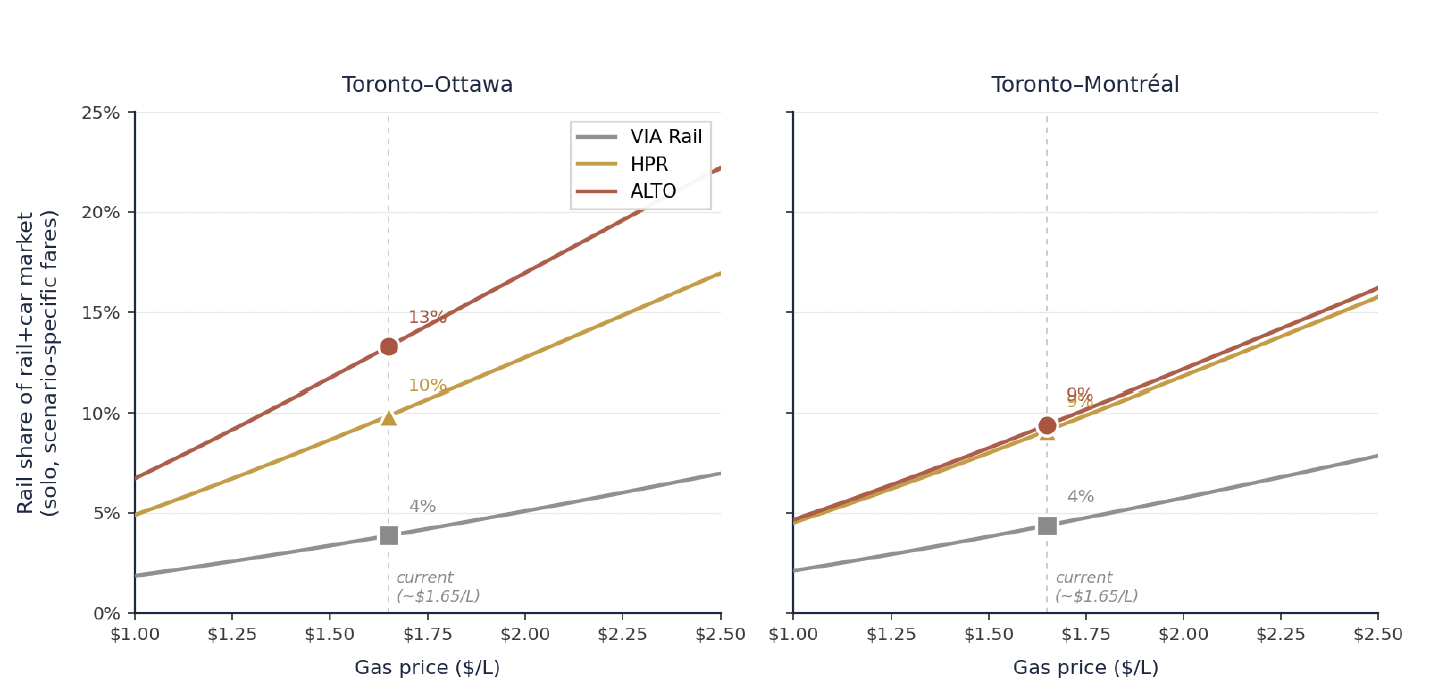
    Because perceived car cost is dominated by fuel, the price ratio is sensitive to gas prices in a way the air comparison is not. A swing from $1.30 to $2.00/L — well within historic range — moves the solo Toronto–Montréal ratio from 1.21 to 0.79. Carbon pricing and fuel-tax policy are levers on rail modal share that operate as strongly as line-haul speed, at much lower capital cost.

    Group-size effects can suppress predicted rail share by 75 to 90 per cent; gas-price swings can move it by 10 to 20 percentage points. These dimensions matter as much as infrastructure choice.
    3 · Travel Time on the Corridor

    Where the corridor sits on the curve

    The same two principal pairs carry the bulk of rail-substitutable demand, but the absolute road flow is very large. The 401 between Toronto, Kingston, Ottawa and Montréal carries tens of millions of person-trips a year — several times the corridor’s air person-trips. Even a small percentage shift represents a meaningful absolute volume.

    Table 1. Approximate annual person-trip volumes (both directions) by mode on each principal pair, and resulting current modal shares. Order-of-magnitude estimates (±25% air/rail, ±30% car). Bus volumes excluded for clarity.
    City pairAirRail (VIA)CarRail share of rail+airRail share of rail+car
    Toronto–Montréal~1.9 M~800 K~6 M~30%~13%
    Toronto–Ottawa~0.9 M~800 K~4.5 M~47%~14%
    Ottawa–Montréal~0.45 M~525 K~4 M~54%~12%

    Three observations follow. The road-substitutable market dwarfs the air-substitutable market on every pair — car volumes are three to ten times rail+air combined. Current rail-vs-air shares are already meaningful (~30% on Toronto–Montréal, ~half on the shorter pairs), but rail-vs-car shares sit in the 12 to 14% range across all three. And the structural similarity of road–rail shares despite very different distances confirms the τ-normalisation: current VIA service produces τ values close to 1.0 on every pair.

    Table 2. Approximate segment-level travel times for car (driving on 401/A20, no congestion) alongside rail under three scenarios. *Toronto–Montréal under current VIA runs 5 h 13 min on the 538 km direct routing; the parallel car drive is ~5 h 30 min.
    City pairDistanceCar (401)VIA currentHPR (200 km/h)ALTO (300+ km/h)
    Toronto–Ottawa~450 km~4 h 30 min~4 h 30 min~2 h 55 min~2 h
    Toronto–Montréal~540 km~5 h 30 min5 h 13 min*~3 h 38 min~3 h
    Ottawa–Montréal~190 km~2 h~1 h 55 min~1 h 30 min~1 h
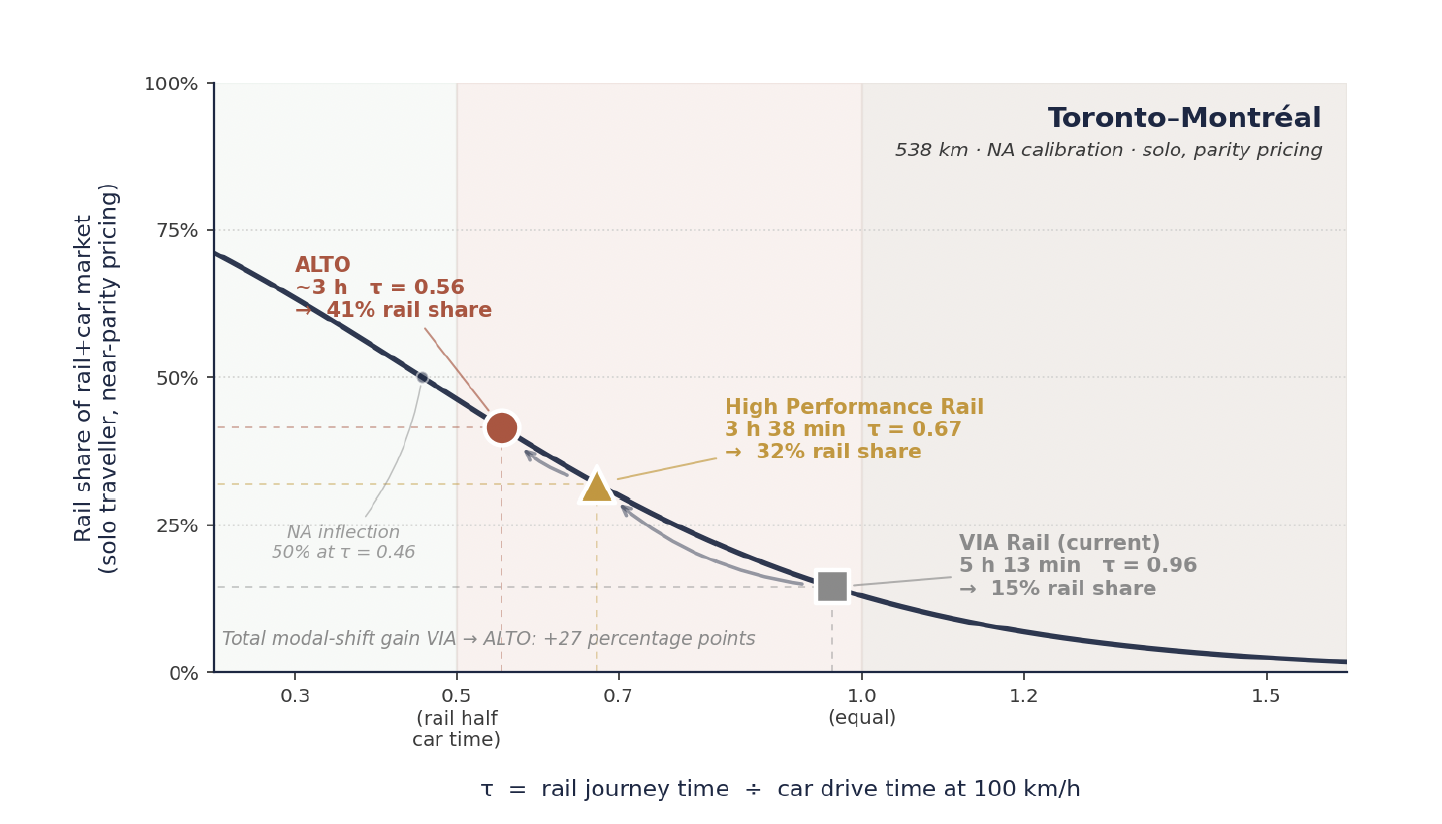
    Modal-shift progression for Toronto-Montreal under VIA, HPR and ALTO at solo, near-parity pricing on the NA-calibrated curve
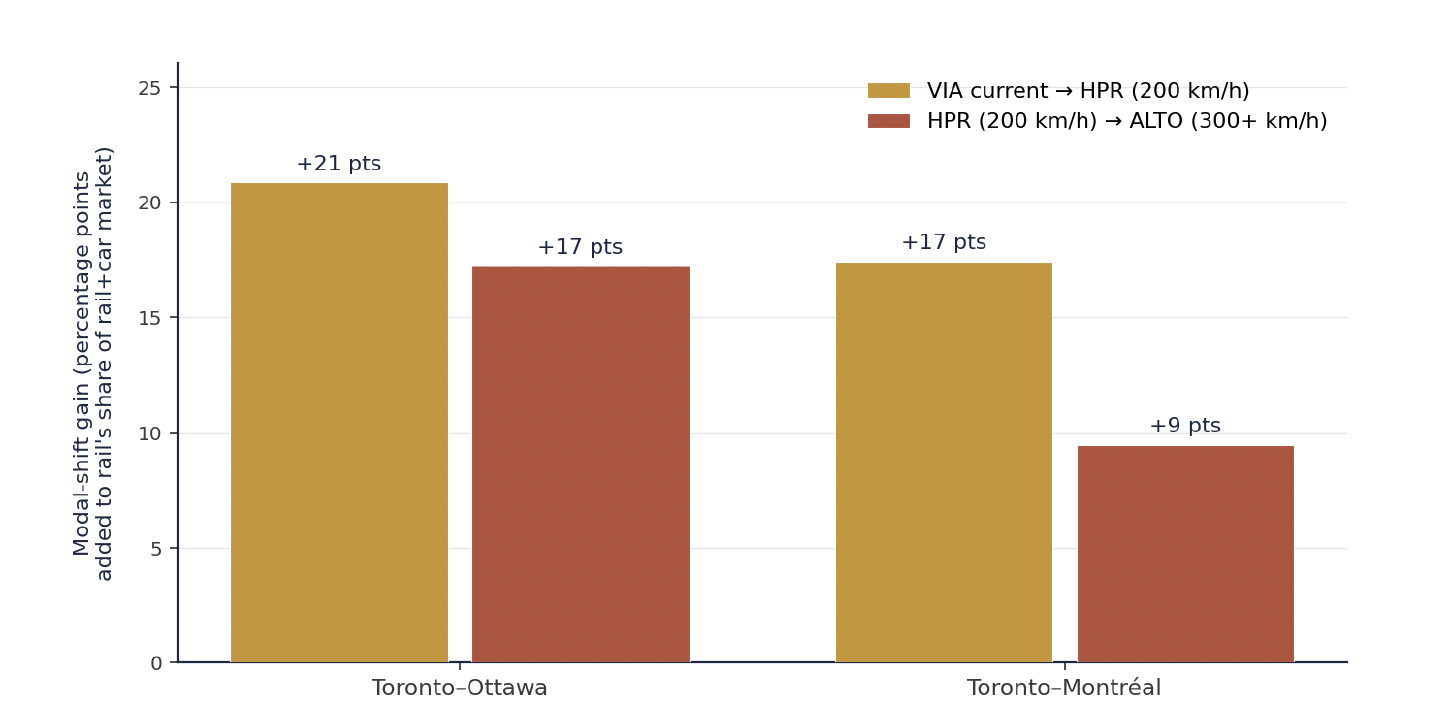
    Figure 3. Modal-shift progression for Toronto–Montréal under the three rail scenarios, plotted on the North-American–calibrated S-curve at solo traveller and near-parity pricing. Predicted rail share of the rail+car market rises from ~15% under VIA, to 32% under HPR, to 41% under ALTO — a total gain of ~27 points, of which 17 points (about two-thirds) are captured by the HPR step alone.
    Table 3. Predicted rail share of the combined rail+car market on each principal pair under each scenario (NA calibration, near-parity, solo, current gas, current VIA-equivalent fares). The VIA shares match the Table 1 anchors, validating the calibration. HPR/ALTO values are order-of-magnitude estimates.
    City pairVIA currentHPR (200 km/h)ALTO (300+ km/h)
    Toronto–Ottawa~13%~34%~51%
    Toronto–Montréal~15%~32%~41%

    These are the time-only readings under the most favourable price configuration. Real corridor traffic is a mix of solo, couple and family travel, with fares that may rise above current VIA levels if HPR or ALTO recover more capital from passengers. Section 4 produces a more realistic envelope.

    4 · Price and Group Size on the Corridor

    Where the corridor sits on the price axis

    Figure 3 plotted the scenarios at price parity — the most favourable assumption for rail. But HPR and ALTO carry higher capital and operating costs than VIA’s shared-track service, and any realistic operating model recovers part of that from passengers. International HSR and the Brightline comparator place premium fares 30 to 80% above conventional rail. This analysis takes a moderate set: HPR at ~20% premium (r = 1.2), ALTO at ~50% premium (r = 1.5).

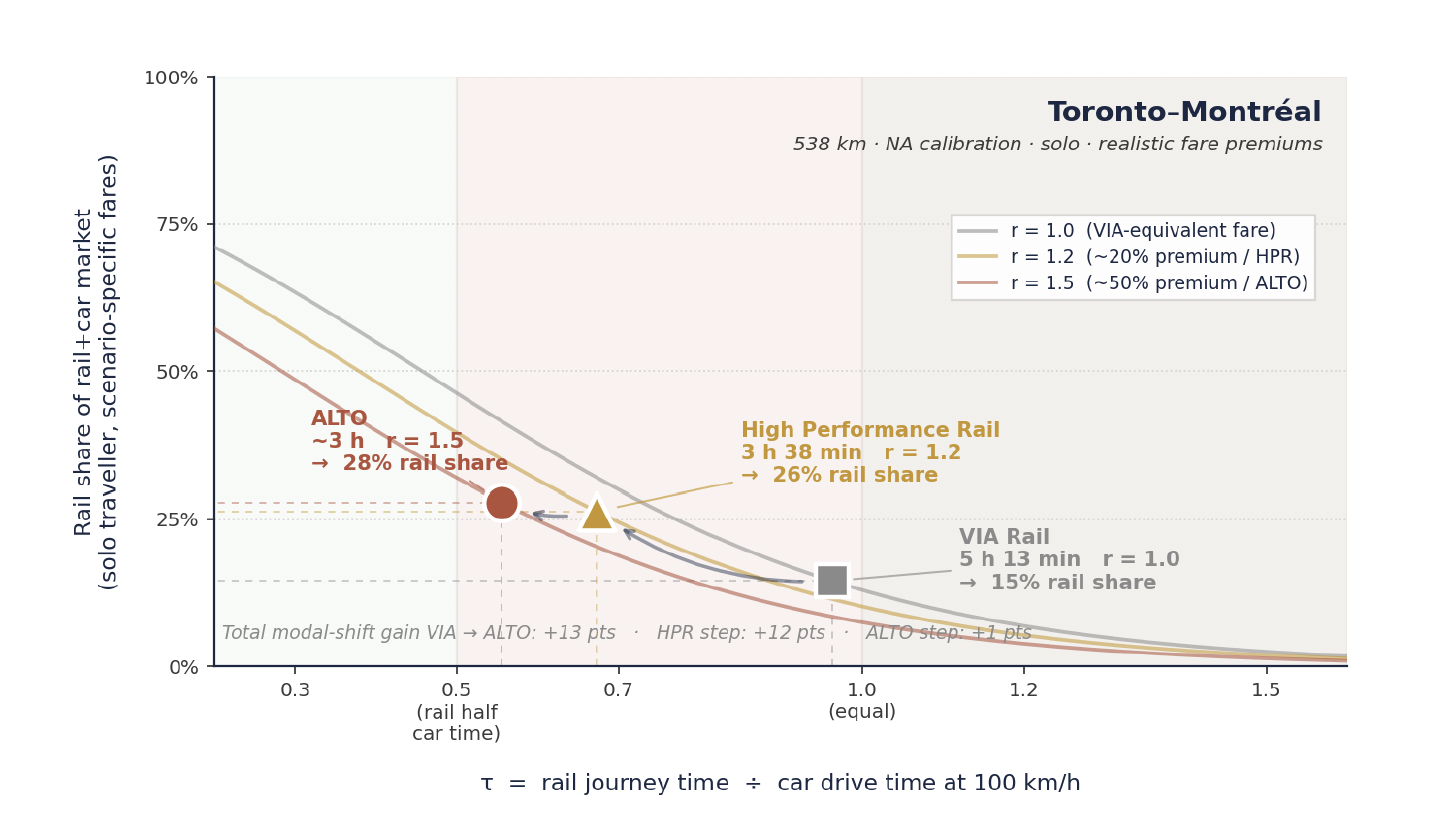
    Modal-shift progression for Toronto-Montreal with realistic fare premiums applied: VIA r=1.0, HPR r=1.2, ALTO r=1.5
    Figure 4. Toronto–Montréal under realistic scenario-specific fare premiums — VIA at r = 1.0, HPR at ~20% premium (r = 1.2), ALTO at ~50% premium (r = 1.5). Predicted shares: VIA 15%, HPR 26%, ALTO 28%. The total VIA → ALTO gain collapses from +27 points at parity to +13 points, with the HPR step doing essentially all the work (+12 pts) and the ALTO step adding only +1 to +2.

    Three observations follow. First, ALTO’s modal-share advantage over HPR — already modest at parity (+9 points on Toronto–Montréal) — essentially disappears once realistic fare premiums are applied, the two converging to within a point of each other. Second, this is robust: sensitivity at ALTO premiums between 30 and 80% produces ALTO shares between 30 and 24%, all within a few points of the HPR 26% reading. Third, the HPR step from current VIA to a dedicated 200 km/h corridor at VIA-equivalent fares captures essentially all of the realistically achievable road–rail modal shift; ALTO’s 300+ km/h capability is real but largely cancelled by the fare premium needed to fund it.

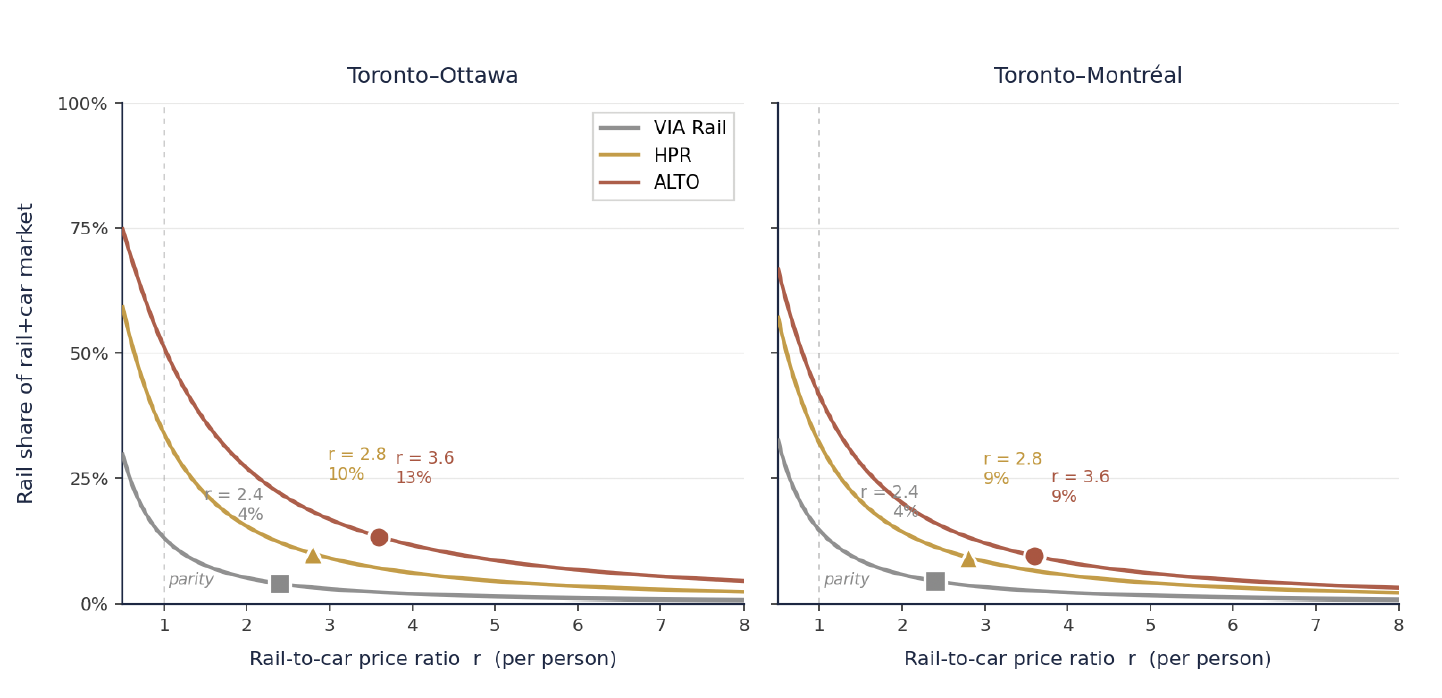
    Modal share as a function of per-person rail-to-car price ratio for each scenario on both Toronto pairs
    Figure 5. Modal share as a function of per-person rail-to-car price ratio, travel time held fixed. Reference operating points combine the solo/current-gas baseline with the realistic premiums: VIA at r = 2.4, HPR at r = 2.8, ALTO at r = 3.6. Predicted shares: VIA ~4% on both pairs; HPR ~10% (Toronto–Ottawa) and ~9% (Toronto–Montréal); ALTO ~13% and ~9%. Share falls steeply as the ratio rises, reflecting the higher price coefficient.
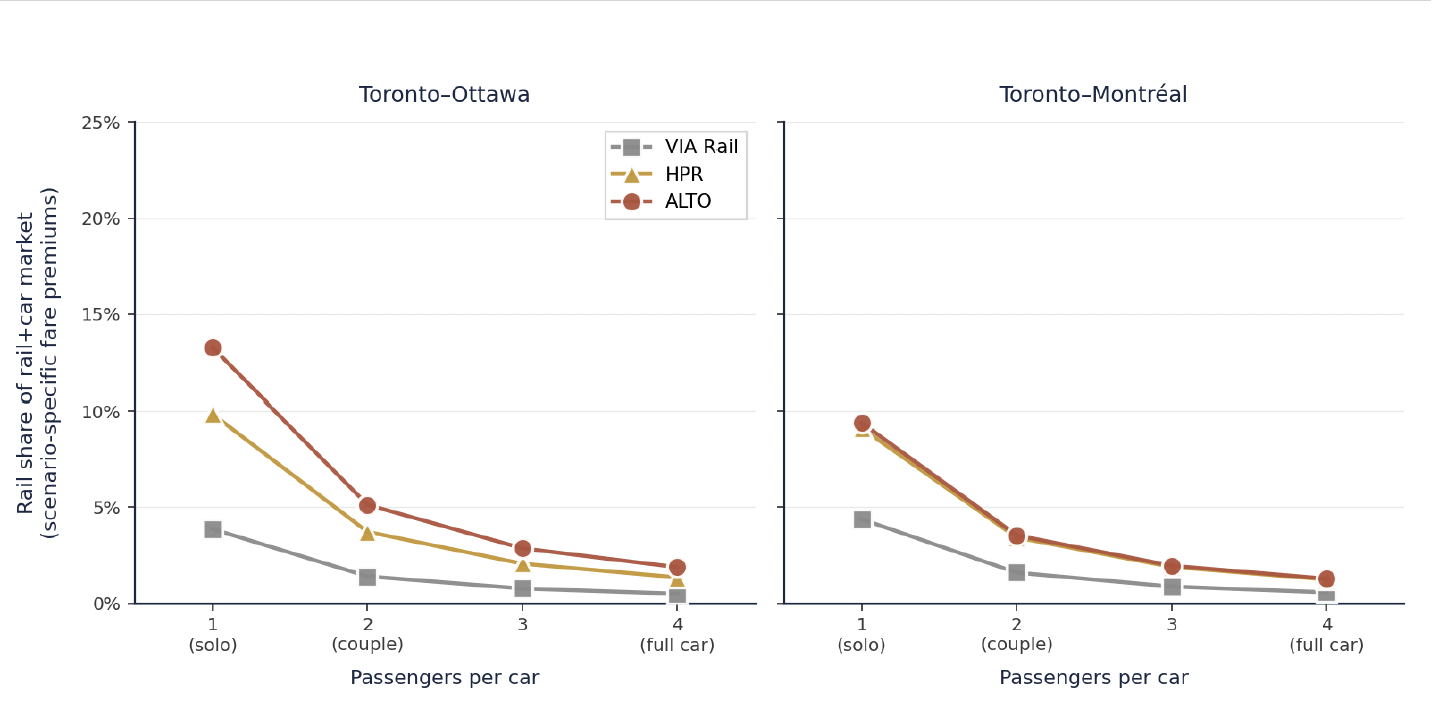
    Modal share as a function of group size from 1 to 4 passengers per car for each scenario
    Figure 6. Modal share against group size (1 to 4 passengers per car), each scenario scaling linearly from its base ratio. Toronto–Ottawa solo shares of 4% (VIA), 10% (HPR), 13% (ALTO) fall to ~1% across all three for a family of four; Toronto–Montréal similarly. The HPR and ALTO lines converge rapidly — a couple essentially eliminates the ALTO advantage.

    The rail-substitutable portion of corridor road traffic is concentrated on solo travellers paying single-person fares against per-person fuel costs. A second passenger halves rail share again; a car of three or four cannot be captured at any travel time or defensible fare. This narrows the realistic market to a small fraction of total road flow — predominantly business, single-traveller leisure, and downtown-to-downtown trips.

    Modal share as a function of gas price from $1.00 to $2.50 per litre for each scenario
    Figure 7. Modal share against gas price ($/L) at solo travel, anchored at the current ~$1.65/L (VIA r = 2.4, HPR r = 2.8, ALTO r = 3.6). A swing from $1.00 to $2.50 roughly triples rail share for each scenario, but absolute levels remain modest. HPR and ALTO converge almost exactly on Toronto–Montréal at all gas prices — fare premiums largely cancel ALTO’s speed advantage.

    Two policy implications follow. The corridor’s modal-shift outcomes are not solely a function of which infrastructure is chosen — they also depend on fuel pricing, carbon pricing and the broader transport-policy environment. And the comparative performance of HPR and ALTO is roughly stable across the gas-price range, so the scenario comparison is robust to fuel-price assumptions even if the absolute levels are not.

    5 · Reliability

    On-time performance and reliability

    Reliability operates as an effective time penalty whenever on-time performance (OTP) drops below a threshold travellers can rely on. Unreliable service makes travellers take an earlier departure than schedule alone requires, inflating their effective journey time by the buffer they carry. The model adds a utility term δ·(OTP_ref − OTP), with δ = 2.0 (the Wardman midpoint) and OTP_ref = 0.85 (VIA’s 2023 reported figure).

    Rail share of the rail+car market as on-time performance varies from 95% down to 50% for both Toronto pairs
    Figure 8. Rail share of the rail+car market for VIA Toronto–Ottawa and Toronto–Montréal as OTP varies from a 95% dedicated-track target down to a 50% stress-test floor. Reference points: dedicated-track target (95%), current VIA (85%), VIA’s 2021 figure (~67%, during heavy freight conflict), and a 50% stress test. As OTP erodes from 95 to 50%, Toronto–Ottawa share roughly halves (15.4% to 6.9%); Toronto–Montréal falls 17.2% to 7.8%.

    Three points follow. OTP is a meaningful but not dominant lever — its dynamic range across the observed band is about ±5 points, comparable to a $0.50/L fuel swing or a solo-to-couple shift. OTP and price are partial substitutes: a 10-point OTP improvement is worth roughly a 14% fare cut, which is why Brightline advertises 92% OTP precisely to support a fare premium. And crucially, the OTP gain inheres in the dedicated-track step, not the speed step — both HPR and ALTO eliminate the freight-train conflicts on shared CN track that cause VIA’s reliability problems, so OTP is not a differentiator between them.

    OTP erosion from 95 to 50 per cent halves VIA’s predicted rail share. The reliability gap between shared-track service and a dedicated alternative is real, but it is captured equally by HPR and ALTO — the speed step adds nothing to reliability.
    6 · Where the Returns Sit

    Where the modal-shift returns sit on the curve

    Because the curve is logistic, the value of additional time savings depends on where a route starts. On Toronto–Ottawa under the NA calibration, moving from VIA (τ = 1.00, ~13%) to HPR (τ = 0.65, ~34%) approaches the inflection and delivers the largest single increment; the move to ALTO (τ = 0.44, ~51%) adds another as the curve crosses its inflection. On Toronto–Montréal, the moves go from VIA at ~15% to HPR at ~32% to ALTO at ~41%.

    Decomposition of road-rail modal-shift gain by investment step: VIA to HPR versus HPR to ALTO on each pair
    Figure 9. Decomposition of road–rail modal-shift gain by investment step (solo, near-parity, NA calibration). Gold bars show the gain from VIA to HPR; terracotta bars the additional gain from HPR to ALTO. The HPR step adds 21 points on Toronto–Ottawa and 17 on Toronto–Montréal; the ALTO step adds 17 and 9. Under the European calibration the comparable figures would be 27/23 (HPR) and 17/10 (ALTO).
    17–21
    Percentage points captured by the VIA → HPR step (NA, near-parity)
    9–17
    Additional points from HPR → ALTO — shrinking under realistic premiums
    $2.5–8B
    Incremental capital cost per percentage point of ALTO-only road–rail shift

    The cost-effectiveness comparison is more challenging for ALTO than for HPR. ALTO’s $60–90 billion envelope is an incremental investment of $40–70 billion above the HPR option. Spread across the additional 9 to 17 points ALTO captures over HPR at canonical NA conditions, that works out to roughly $2.5 billion to $8 billion per percentage point — with the important caveat that road–rail shift, in absolute trip volumes, represents a much larger total person-trip diversion than the air–rail equivalent.

    The corridor’s road traffic is several times its air traffic, and even an NA-realistic 30 to 50 per cent rail share of rail+car represents a larger absolute volume than full capture of the rail+air market.
    7 · Implications

    What this means for the corridor decision

    Six conclusions follow from putting the road–rail evidence alongside the air–rail analysis.

    Structurally different from rail-vs-air

    The car competes at all distances; the competitive zone is narrower (1.5 to 3 hours); perceived cost is dominated by fuel; group travel tilts decisively toward driving; cross-elasticities are remarkably low; and structural North American conditions all suppress rail’s position relative to European comparators.

    The road prize is bigger

    Despite the headwinds, road-substitutable demand is far larger in absolute terms than air-substitutable demand. Even modest rail shares translate to large absolute diversions — between 1.4 and 3 million additional rail trips a year on the principal pairs. The road prize is bigger; it is just structurally harder to capture.

    Policy levers rival infrastructure

    Group size and fuel pricing are levers as substantial as the HPR/ALTO choice. Family travel suppresses rail share by ~75%; sustained higher fuel prices lift it by 15 to 30 points. Carbon pricing, fuel tax, congestion charging and parking pricing operate at much lower capital cost.

    Reliability is a dedicated-track gain

    OTP is substantial but bounded, and the gap between shared-track and dedicated service is captured by the move from VIA to either HPR or ALTO. The OTP step is inherent in the dedicated-track decision, not the speed decision.

    Sixth, this is the regime in which the High Performance Rail framework is most defensible on modal-shift grounds. The HPR step from VIA’s shared-track service to a dedicated, electrified 200 km/h corridor at VIA-style fares captures the majority of the road–rail opportunity on both pairs — adding 21 points on Toronto–Ottawa and 17 on Toronto–Montréal. ALTO’s additional speed adds 9 to 17 points at solo, near-parity conditions, but those points cost $40–70 billion above HPR, and under realistic group-mix and price assumptions the incremental advantage shrinks further.

    Taken together with the parallel rail–air analysis, the corridor decision turns on whether the right framework is being used. Modal-shift performance is multi-dimensional — time, price, group size, fuel cost, traveller type, structural context — and the headline time-only advantage that motivates ALTO’s case shrinks substantially once these dimensions are admitted. The High Performance Rail framework delivers the bulk of the corridor’s achievable modal-shift outcomes — on both the air market and the road market — at roughly a quarter of ALTO’s capital cost.

    Download Full Note
    Modal Shift Note 2 — Road–Rail Research Note (PDF)
    Reference document with the full methodology, both calibrations, sensitivity analysis, and the complete source list
    Download PDF
    Methodology

    Modelling approach

    The S-curve is a standard logistic of the form S(τ) = 1 / (1 + exp(K·(τ − τ₀))), where S(τ) is rail’s share of the combined rail+car market as a function of the time ratio τ = (rail time) ÷ (car drive time at 100 km/h). The τ-normalisation is a meaningful departure from the absolute-time framing of the rail–air analysis: because the car comparator scales with distance, τ gives a distance-invariant measure of rail’s competitive position. Parameters are K = 3.5 and τ₀ = 0.65 (European). The price family adds a utility term: S(τ, r) = 1 / (1 + exp(K·(τ − τ₀) + γ·ln r)), with γ = 1.5 — larger than the rail–air γ = 1.0, reflecting higher own-price elasticities for car-vs-rail substitution. For group travel, r_effective = r_solo × n.

    Two calibrations are presented. The European calibration (τ₀ = 0.65) is fitted to the TGV Paris–Lyon pre/post comparison. The North American calibration (τ₀ = 0.46) is anchored on current VIA’s ~13% rail share at τ ≈ 1.0; the two differ only in τ₀, the shift equivalent to a constant penalty α ≈ 0.67. The parameters are illustrative rather than predictive; sensitivity at K between 2.5 and 4.5, τ₀ between 0.40 and 0.75, and γ between 1.2 and 1.8 produces the same qualitative conclusions. An important caveat: the binary-logit model captures time-and-price geometry but not the structural North American factors — free parking, dispersed land use, weak feeder transit, family-travel norms, cultural autonomy preference — that suppress rail share. Model predictions should be read as upper bounds; realised share is likely 30 to 50% below them. Brightline Miami–Orlando, the closest North American analogue, is in extended ramp-up with bond ratings downgraded to CCC+, indirect confirmation that achievable shares emerge slowly here.

    Sources

    Principal sources

    1.
    ALTO HSR Citizen Research Initiative (2026). HPR Strategy, Chapter 4 — High Performance Passenger Rail (Express journey times). citizenresearch.ca
    2.
    VIA Rail Canada Annual Report 2023; published timetables, station-pair travel times and Economy fare ranges; ridership via Statista (2024) — Montréal–Ottawa–Toronto triangle at 2.1 million passengers.
    3.
    Cirium aviation analytics (2025), via Simple Flying — Toronto Pearson top destinations by capacity; ~930,000 one-way Toronto–Montréal seats on YYZ–YUL alone.
    4.
    Quebec City–Windsor Corridor reference data — ~108 flights per workday within the Toronto–Ottawa–Montréal triangle.
    5.
    Ministry of Transportation of Ontario (2019, 2024). Highway 401 Annual Average Daily Traffic counts; Toronto-area AADT exceeds 450,000 vehicles/day.
    6.
    Statistics Canada Tables 23-10-0253-01 (Air passenger traffic) and 51-204-X (Air Passenger Origin and Destination, Domestic).
    7.
    Currie, G. & Phung, J. (2007). Transit Ridership, Auto Gas Prices, and World Events. Transportation Research Record, 1992. — and Lago, A.M., Mayworm, P.D. & McEnroe, J.M. (1992). Ridership Response to Changes in Transit Services. Transportation Research Record, 818.
    8.
    Wardman, M. (2014). Price Elasticities of Surface Travel Demand: A Meta-analysis of UK Evidence. Journal of Transport Economics and Policy, 48.
    9.
    Mineta Transportation Institute (2017). Modal Shift and High-Speed Rail. P. Haas. — and Moeckel, R. et al. (2013). Mode Choice Modeling for Long-Distance Travel (nested logit, TSRC).
    10.
    Federal Highway Administration (2015). Analysis of Automobile Travel Demand Elasticities With Respect To Travel Cost. — and Litman, T. (VTPI). Transportation Elasticities. vtpi.org
    11.
    International Transport Forum (2019). Roundtable 176: What is the Value of Saving Travel Time? OECD/ITF.
    12.
    Brightline Florida (2024–2026). Monthly Revenue and Ridership Reports; KBRA bond rating actions. — and Geotab (2025). Travel Time vs. Toll Costs: Toronto’s 407 and 401.
    13.
    Ben-Akiva, M. & Lerman, S. (1985). Discrete Choice Analysis. MIT Press. — and Train, K. (2009). Discrete Choice Methods with Simulation, 2nd ed. Cambridge University Press.
    14.
    ALTO HSR Citizen Research Initiative companion notes: Note 1 — Modal shift between high-speed rail and air, and the Modal Shift & Ridership synthesis brief that sets this note alongside Notes 1, 3 and 4.