Modal Shift Between High-Speed Rail and Air on the ALTO Corridor
When does rail substitute for air — and how much of that substitution does ALTO’s 300+ km/h capability actually buy, once the price of the ticket is admitted into the analysis?
This note applies the international evidence on rail–air substitution to the two corridor pairs that account for the bulk of air-substitutable demand — Toronto–Ottawa and Toronto–Montréal — and compares three scenarios on both travel time and price: current VIA Rail service, a High Performance Rail (HPR) alternative at 200 km/h, and ALTO at 300+ km/h.
The headline question is not whether modal shift happens — the evidence is clear that it does — but where the modal-shift returns sit on the curve, and whether ALTO’s incremental speed is a cost-effective way to capture them.
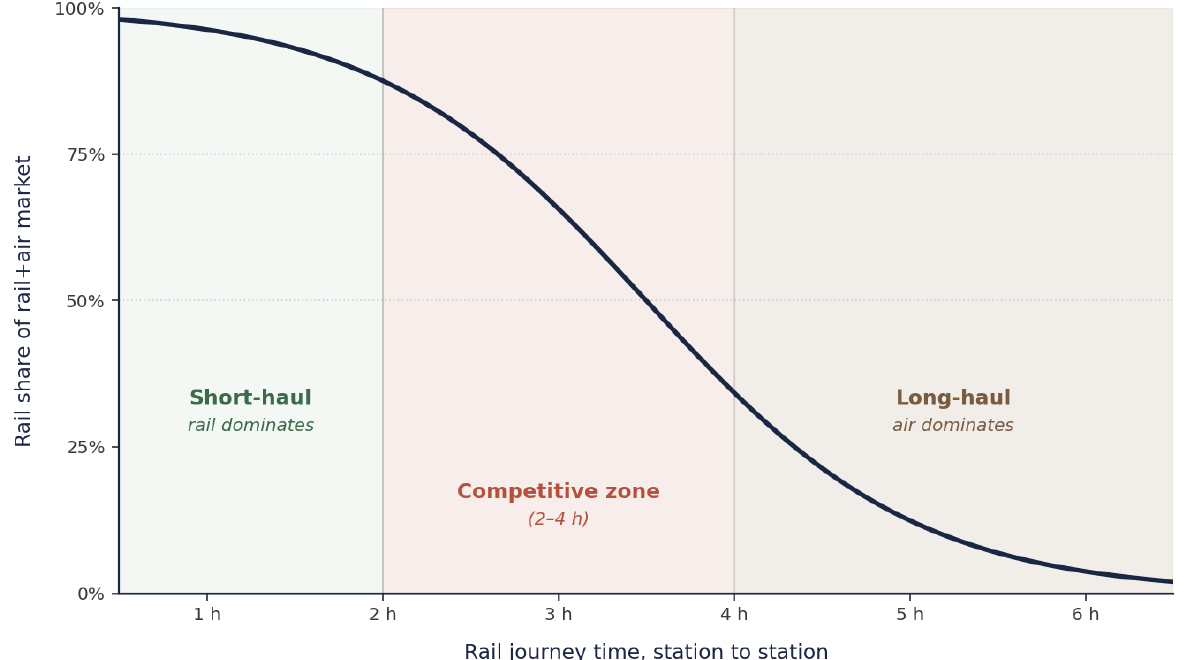
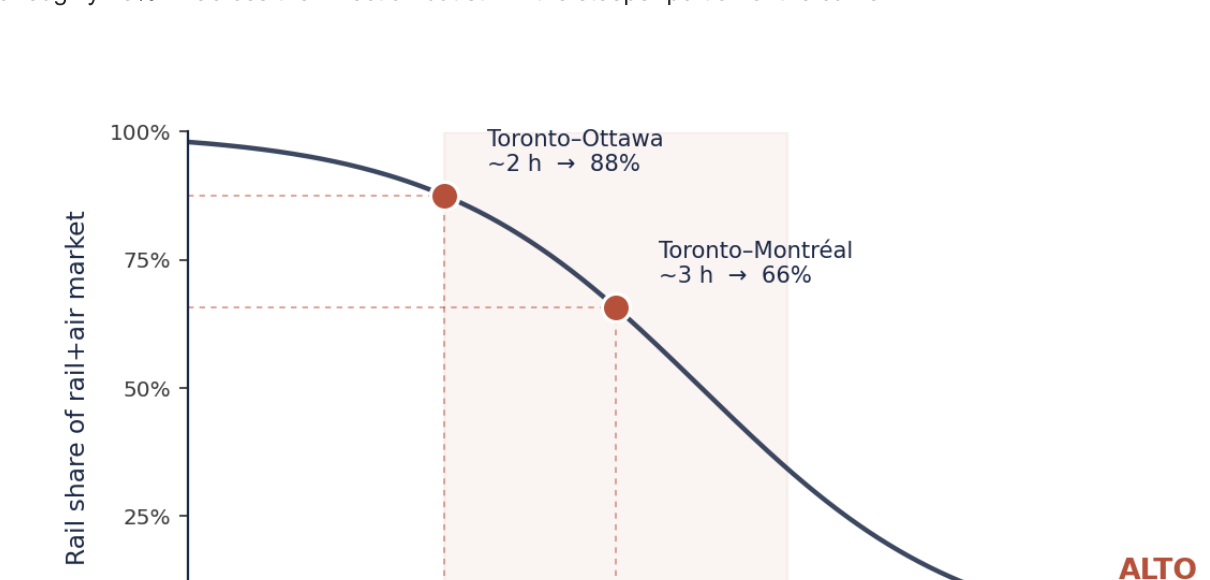
The international literature converges on a logistic S-curve: rail captures the majority of the combined rail+air market on city pairs with station-to-station times of two to four hours, and rail’s share collapses rapidly above five hours. Both principal Toronto pairs fall inside that competitive zone under any modern dedicated-track scenario.
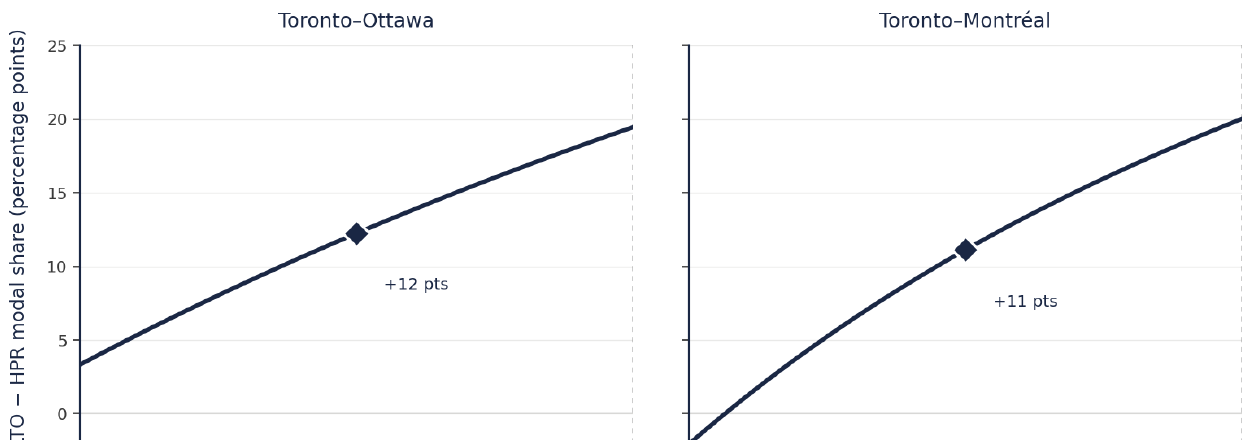
The majority of the achievable modal shift on each pair is captured by moving from VIA’s current shared-track service to a dedicated, electrified HPR corridor at conventional 200 km/h speeds. ALTO’s additional 300+ km/h capability captures a further 19 to 20 percentage points at price parity — a real but residual gain.
Once price enters the analysis, the picture shifts. Under canonical price assumptions — VIA at r ≈ 0.5, HPR at r ≈ 0.7, ALTO at r ≈ 1.0 — ALTO’s apparent 19–20-point time-only advantage shrinks to 11–13 points on the principal Toronto pairs. The cost-per-point of that incremental modal shift is several billion dollars; the cost-per-point of the larger HPR step that precedes it is much lower.
The competitive zone
The empirical literature on rail–air substitution converges on a consistent set of travel-time thresholds. Studies in Europe, China and Japan identify a competitive break-even of roughly 400 to 600 km (about 2 to 3 hours door-to-door) for short-haul routes, beyond which aviation begins to regain a time advantage. Medium-distance corridors of 600 to 1,100 km show the greatest demand elasticity. Long-haul segments above 1,400 km show minimal substitution — typically below 10 per cent.
The mechanism is the door-to-door time calculation. Below roughly 700 km, the overhead of reaching the airport, checking in, clearing security, boarding, taxiing and reaching the destination city centre adds enough that total air journey time matches or exceeds high-speed rail. Above this distance, air’s faster line-haul speed begins to dominate, and rail’s share falls steeply once journeys exceed about 4.5 hours.
This relationship is conventionally modelled as a logistic S-curve. The shape is characteristic: under two hours rail captures essentially the entire air market; between three and four hours rail typically captures 60 to 80 per cent; between four and five hours rail’s share collapses; above five hours rail captures only a residual share. Frequency, station centrality, fare structure and reliability shift the curve up or down by several points but do not change its overall shape.
Empirical anchors
Three European routes anchor the baseline. On Paris–Lyon, the TGV cut travel time from almost four hours to about two; rail’s share of the rail+air market rose from 40 to 72 per cent, while air collapsed from 31 to 7 per cent. On Madrid–Seville (471 km, completed 1992), rail share rose from 16 to 52 per cent of all modes. The Madrid–Barcelona AVE — at 621 km and 2 h 30 min the cleanest modern parallel to ALTO’s longer pairs — now carries roughly 75 per cent of travellers on the rail-vs-air pair.
Asian comparators reach further. The 2019 World Bank review found Chinese 350 km/h services remain competitive with air up to about 1,200 km. Beijing–Shanghai (1,318 km, 4 h 18 min) is the canonical case where high frequency and operating speed maintain rail dominance at distances that would normally favour air; Tokyo–Osaka (552 km, 2 h 22 min) is another textbook 80+ per cent rail-dominant pair.
The elasticity factor
The S-curve in Figure 1 holds prices implicitly at parity. Real modal choice is two-dimensional: passengers weigh both time and price, and the relative price of rail to air shifts the entire curve up or down. A logit choice model with a price-utility term captures this directly — each doubling of the rail-to-air price ratio shifts the curve’s inflection point earlier by an amount that depends on the price coefficient.
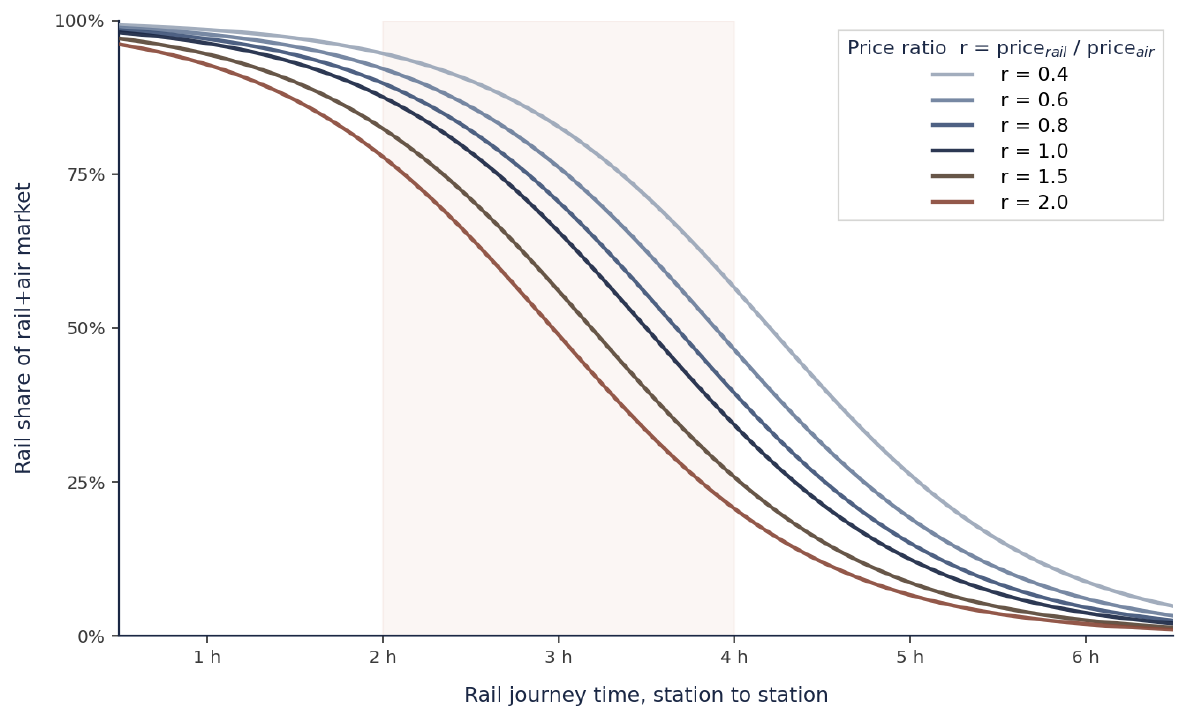
How to read the chart
The simplest use of Figure 2 is as a lookup. Pick a travel time, pick the curve matching the route’s price ratio, and read off the predicted share. A 3-hour journey at parity (r = 1.0) sits at roughly 60 per cent; the same journey at half the air fare (r = 0.5) sits closer to 75 per cent; at 1.5× the air fare (r = 1.5) it drops to around 45 per cent. A faster service at a higher price can deliver lower share than a slower service at a lower price — the family shows how the two effects combine.
Price sensitivity differs by traveller
Business travellers show much lower price sensitivity than leisure travellers — elasticities of roughly −0.4 to −0.7 for business against −1.0 to −1.6 for leisure. Each curve is really a weighted average of a flatter business curve and a steeper leisure one.
Air’s connecting-flight advantage
Air retains a structural edge the simple model misses: the connecting-flight network. Travellers continuing to long-haul destinations face mode-switching friction at the hub. The modal-share envelope should be read as a ceiling for the rail-substitutable portion of the market, not the air market as a whole.
On the empirical side, the high-share international routes combine competitive times with rail fares well below air: Madrid–Barcelona AVE Básico fares of €40–70 against air fares of €100–200 put the price ratio in the 0.4–0.6 band. Tokyo–Osaka is the contrasting case — prices roughly comparable (0.7–0.9), but central-station access and reliability sustain rail dominance without a price advantage.
Where the corridor sits on the curve
The corridor is not a single market. It is a sequence of overlapping city pairs whose distances place each segment in a different position on the curve. The bulk of air-substitutable demand is concentrated in two pairs: Toronto–Ottawa and Toronto–Montréal. The Toronto–Montréal air market alone runs 900,000+ annual seats. ALTO’s published target times — about 2 hours Toronto–Ottawa and just over 3 hours Toronto–Montréal — both fall inside the zone where international comparators capture 70 to 90 per cent of the rail+air market.
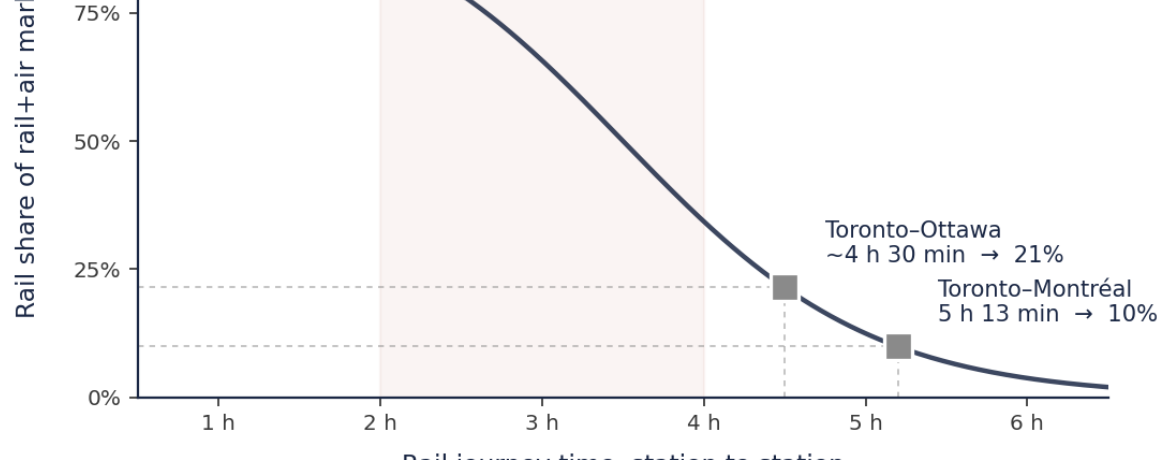
VIA’s existing Corridor service sits well outside that zone. Toronto–Montréal averages 5 h 13 min over 538 km; Toronto–Ottawa runs 4 to 4.5 hours. Trains are limited to 160 km/h on track shared with CN freight — the principal cause of both slow line-haul speed and poor reliability (on-time performance around 67 per cent as of 2021). Yet the Corridor is VIA’s commercial backbone, contributing 81 per cent of revenue and 95 per cent of ridership.
| City pair | Distance | VIA current | HPR (200 km/h) | ALTO (300+ km/h) |
|---|---|---|---|---|
| Toronto–Ottawa | ~450 km | ~4 h 30 min | ~2 h 55 min | ~2 h |
| Toronto–Montréal | ~540 km | 5 h 13 min* | ~3 h 38 min | ~3 h |
| Ottawa–Montréal | ~190 km | ~1 h 55 min | ~1 h 30 min | ~1 h |
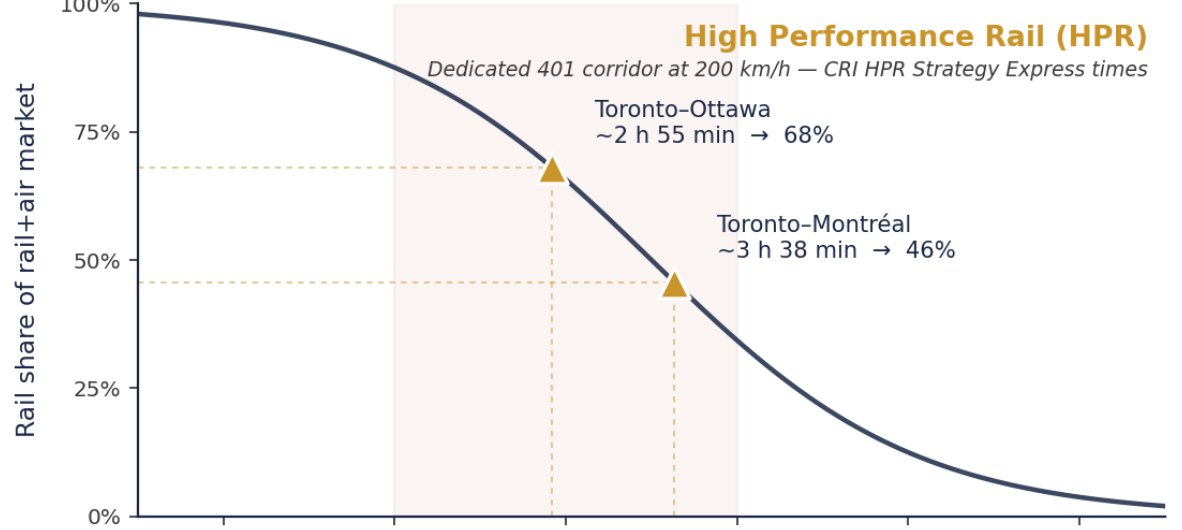
Plotted onto the S-curve, these times produce three pictures. Each panel highlights the two principal Toronto pairs under one scenario; the contrast between panels traces the modal-shift trajectory at price parity as corridor infrastructure improves.
| City pair | VIA current | HPR (200 km/h) | ALTO (300+ km/h) |
|---|---|---|---|
| Toronto–Ottawa | ~21% | ~68% | ~88% |
| Toronto–Montréal | ~10% | ~46% | ~66% |
These are the time-only readings — what each scenario would deliver if its fares matched air. In practice, fares depend on capital structure, and the three scenarios sit at quite different points on the price axis.
Where the corridor sits on the price axis
Current VIA Toronto–Montréal Economy fares of $80–120 against Air Canada fares of $200–400 put VIA at a price ratio of roughly 0.5 — the same band as Madrid–Barcelona. The structural fare advantage is already in place; the binding constraint on current rail share is travel time, not price.
Whether each new-build scenario preserves a fare advantage depends on capital-cost recovery. The CRI HPR Strategy estimates corridor capital in the order of $19 million/km — roughly $19–25 billion for the full Windsor–Montréal programme — producing annual debt service of $1.0–1.3 billion. Under the standard public-infrastructure subsidy model, HPR fares could plausibly sit at a modest premium over current VIA, placing HPR at r ≈ 0.7. ALTO’s $60–90 billion envelope produces debt service three to four times higher; under a fare cap holding the ratio at parity, ALTO settles at r ≈ 1.0, with subsidy absorbing the capital-cost gap.
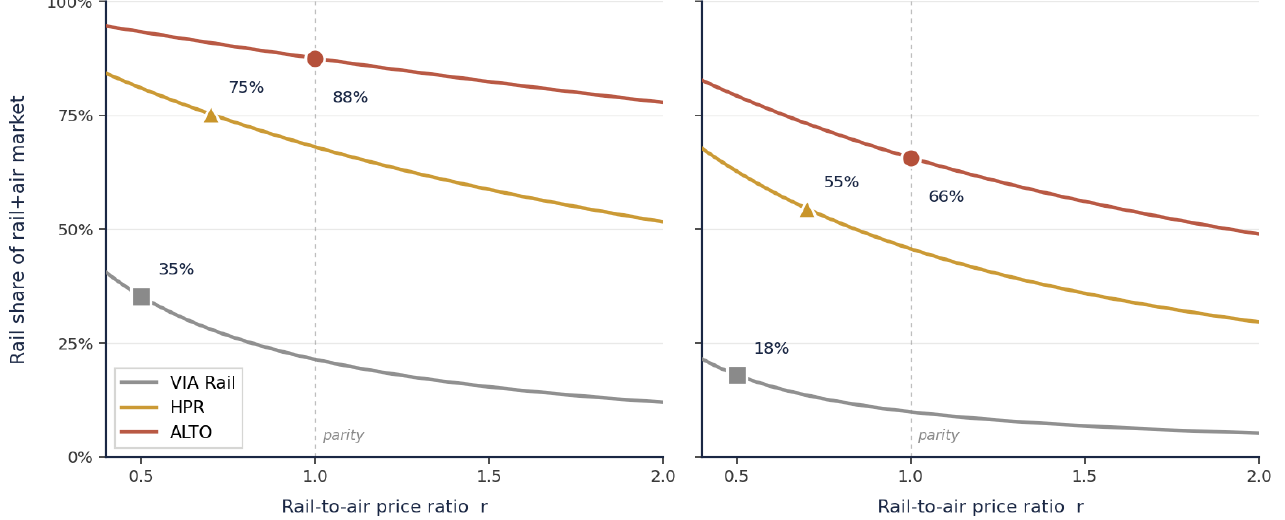
At their canonical ratios, the Toronto–Montréal scenarios deliver 18 per cent (VIA), 55 per cent (HPR) and 66 per cent (ALTO). ALTO retains an 11-point advantage over HPR — markedly smaller than the 20-point gap the price-parity readings imply, because ALTO’s higher capital cost drags its price ratio up the curve while HPR keeps a price advantage. On Toronto–Ottawa, both new-build scenarios sit high on the curve where price effects are smaller: ALTO ~88%, HPR ~75% — a 13-point gap. If HPR were held at the current VIA ratio (r ≈ 0.5), the gaps would close to 3 and 7 points respectively.
The HPR pricing lever, with ALTO held at parity
Fixing ALTO at parity and varying HPR’s fare relative to it puts the pricing decision directly in front of the reader.
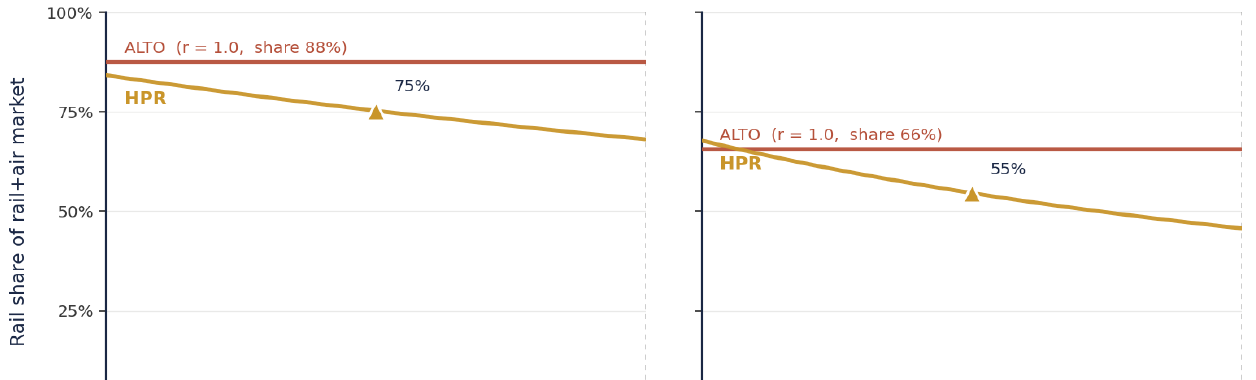
The two figures make explicit what the canonical readings imply: ALTO’s modal-shift advantage is highly contingent on HPR’s pricing model. Hold HPR fares near current VIA levels and the gap is 3 to 7 points; let them drift to 70 per cent of ALTO’s and the gap is 11 to 13; let them converge entirely and the full 19–20-point time-only advantage returns. The corridor decision is as much a question about HPR’s intended subsidy structure as about the choice of infrastructure — a question in the operator’s hands, not the engineer’s.
Where the modal-shift returns sit on the curve
Because the curve is logistic — flat at the top, steep in the middle, flat at the bottom — the value of additional time savings depends critically on where a route starts. On Toronto–Montréal, moving from VIA’s 5 h 13 min to HPR’s 3 h 38 min crosses much of the steep middle and delivers a large gain; the further move to ALTO’s 3-hour service stays in the steeper portion and adds a meaningful increment. On Toronto–Ottawa, HPR’s 2 h 55 min already places the route high on the curve, so ALTO’s 2-hour service produces smaller share gains.
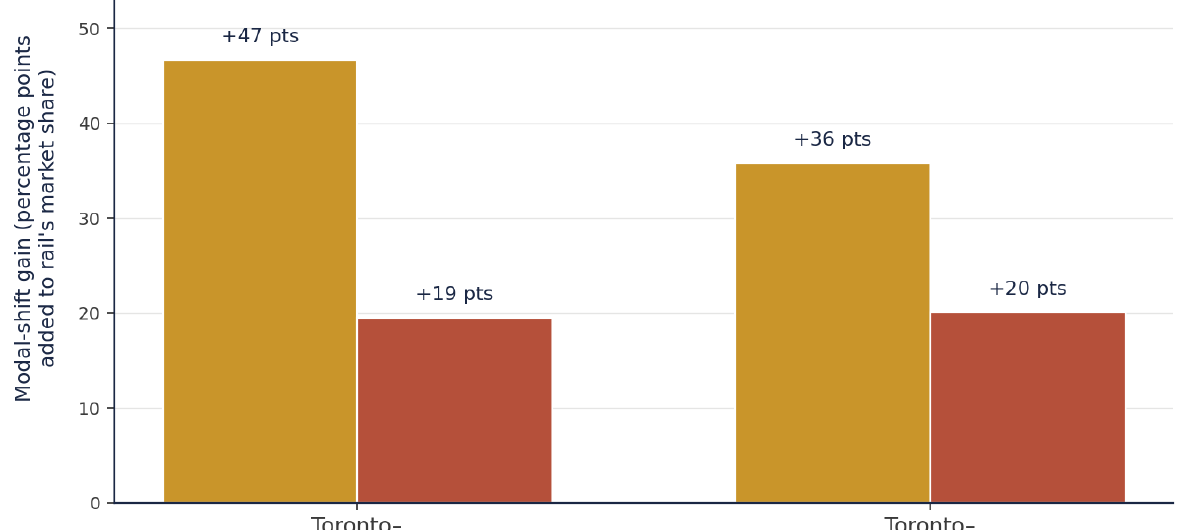
On Toronto–Ottawa, the VIA-to-HPR move captures an estimated 47 points of modal shift; the further HPR-to-ALTO move adds 19. On Toronto–Montréal, HPR captures 36 and ALTO adds 20. The HPR step delivers the majority of the achievable shift on both pairs (roughly 65 to 70 per cent of the total), but the residual ALTO increment is real at price parity.
The cost-effectiveness comparison sharpens this. ALTO’s $60–90 billion envelope is an incremental investment of $40–70 billion above the HPR option. Spread across the 11 to 13 incremental points ALTO captures over HPR under realistic pricing, that works out to roughly $3 billion to $6 billion per percentage point — several times worse than the HPR step that precedes it.
What this means for the corridor decision
Four conclusions follow from putting the international literature, segment-level travel times, and the price dimension alongside one another.
The opportunity is real and concentrated
The corridor’s modal-shift potential is well-supported by international evidence and concentrated in two pairs — Toronto–Ottawa and Toronto–Montréal. Modelling the corridor as a single 1,000 km market obscures this. The real question is segment-level time and price, not headline line-haul speed.
HPR does the larger part of the work
On time alone, HPR’s Express times place both principal pairs into the upper portion of the curve. ALTO captures a real 19–20-point incremental gain — but residual relative to the larger HPR step, and several times more expensive per point of shift purchased.
Price reduces ALTO’s advantage
Under canonical ratios, ALTO’s advantage narrows from 20 points at parity to 11 points on Toronto–Montréal and 13 on Toronto–Ottawa. If HPR ran at the current VIA ratio, the gap would close further still — to 3 and 7 points.
This is the HPR regime
This is precisely where the literature finds frequency, reliability, station-centrality and price to matter more than headline speed. Capturing the bulk of the opportunity does not require operating at the global frontier of high-speed technology.
The corridor is a textbook case of why high-speed-rail claims need to be unbundled. The modal-shift opportunity is genuine. The majority of it is captured by conventional high-performance speeds on a dedicated, electrified, reliable corridor priced competitively against air. ALTO’s additional 300+ km/h capability buys a real but reduced gain once realistic pricing is admitted — between 11 and 13 percentage points on the principal Toronto pairs, at an incremental capital cost of $40–70 billion. Whether the corridor decision turns on the right framework — segment-level, two-dimensional analysis of time and price — is what determines whether the public investment achieves the modal-shift outcome it is intended to produce.
Modelling approach
The S-curve is a standard logistic of the form S(t) = 1 / (1 + exp(k·(t − t₀))), where S(t) is rail’s share of the combined rail+air market as a function of station-to-station journey time t. The parameters are k = 1.3 and t₀ = 3.5 hours, calibrated by visual fit to the international comparator data. The family of curves adds a price-utility term: S(t, r) = 1 / (1 + exp(k·(t − t₀) + γ·ln r)), where r is the rail-to-air price ratio and γ = 1.0 the price coefficient.
This binary-logit specification is the simplest defensible form of the time–price modal-choice model used routinely in transport demand work. More elaborate discrete-choice models add regressors for frequency, station access, reliability and demographics, but tend to confirm the same S-shaped relationship and the same direction of the price effect. The parameters here should be treated as illustrative rather than predictive; sensitivity analysis at k between 1.0 and 1.6, t₀ between 3.0 and 4.0 hours, and γ between 0.6 and 1.4 produces the same qualitative conclusions about HPR’s performance and ALTO’s price-driven degradation of the time advantage.