Modal Shift Between Rail and Car on the ALTO Corridor
The car competes with rail at every distance, costs are weighed on fuel rather than full economics, and a full car of four tilts the comparison decisively toward driving. Why North American road–rail substitution is structurally harder — and how much of it ALTO’s speed actually buys.
This note applies the evidence on rail–car substitution to the two principal corridor pairs — Toronto–Ottawa and Toronto–Montréal — in the North American context, comparing current VIA Rail, a High Performance Rail (HPR) alternative at 200 km/h, and ALTO at 300+ km/h.
The road–rail comparison differs structurally from the rail–air analysis in Note 1: the car carries no fixed access penalty, perceived driving cost is dominated by fuel rather than full lifecycle cost, group travel decisively favours the car, and modal choice is more responsive to price than to time.
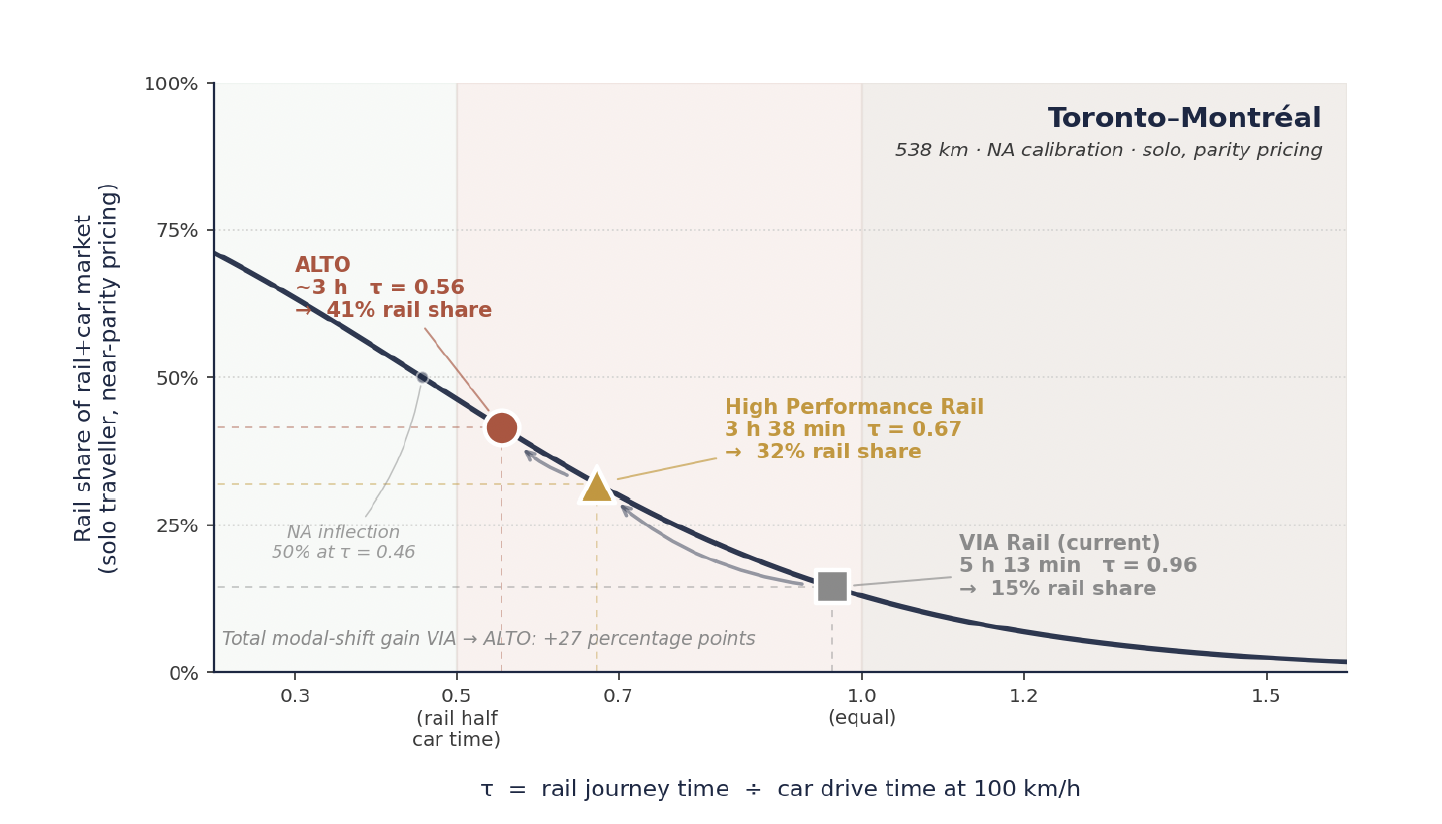
The right competitive variable is not absolute rail time but the ratio τ of rail time to car drive time: τ = 0.5 means rail takes half as long as driving, τ = 1.0 means equal time. Because car drive time scales with distance, the same τ implies the same competitive geometry on any route length.
The corridor’s road-substitutable demand is far larger than its air-substitutable demand — highway flow on the 401 between Toronto, Kingston, Ottawa and Montréal is several times the corridor’s annual air person-trips. Three structural features make North-American competition harder than European comparators: the 401/A20 is toll-free end-to-end, there is no congestion charging anywhere in Canada, and per-person car cost divides among occupants while rail charges per ticket. A family of four faces a per-person rail-to-car price ratio four times higher than a solo traveller.
Under canonical conditions — solo traveller, current Canadian gas prices, near-parity pricing — on a North-American–calibrated curve anchored on VIA’s ~13% rail share, the model predicts ALTO captures about 51% of the rail+car market on Toronto–Ottawa and 41% on Toronto–Montréal; HPR captures about 33% on both. European-equivalent upper bounds — readings that would apply only if North American transport policy shifted toward European fuel taxes, tolls and station-area land use — are 67% and 58% for ALTO and around 50% for HPR.
The competitive zone for road
The literature on rail–car substitution differs sharply from the rail–air literature. The car carries no fixed time penalty equivalent to airport access, security and downtown-airport transit; parked at origin and arriving at destination, it has near-zero access cost on both ends, and its line-haul time degrades only slightly across the 100–1,000 km range. The result is that car competes against rail at every distance — including short-haul corridors where rail would dominate the air comparison.
The right measure is therefore not absolute rail journey time but the ratio of rail time to car time. Defining τ = (rail time) ÷ (car drive time at 100 km/h) gives a distance-invariant measure of rail’s advantage: τ = 0.5 means rail takes half as long as driving; τ = 1.0 means equal time; τ > 1.0 means rail is slower. A 3-hour rail journey on a 540 km route (τ = 0.56) is competitively equivalent to a 1.5-hour journey on a 270 km route. This is the key structural difference from the rail-vs-air analysis, where rail’s fixed advantage at the access stage means absolute time is what matters.
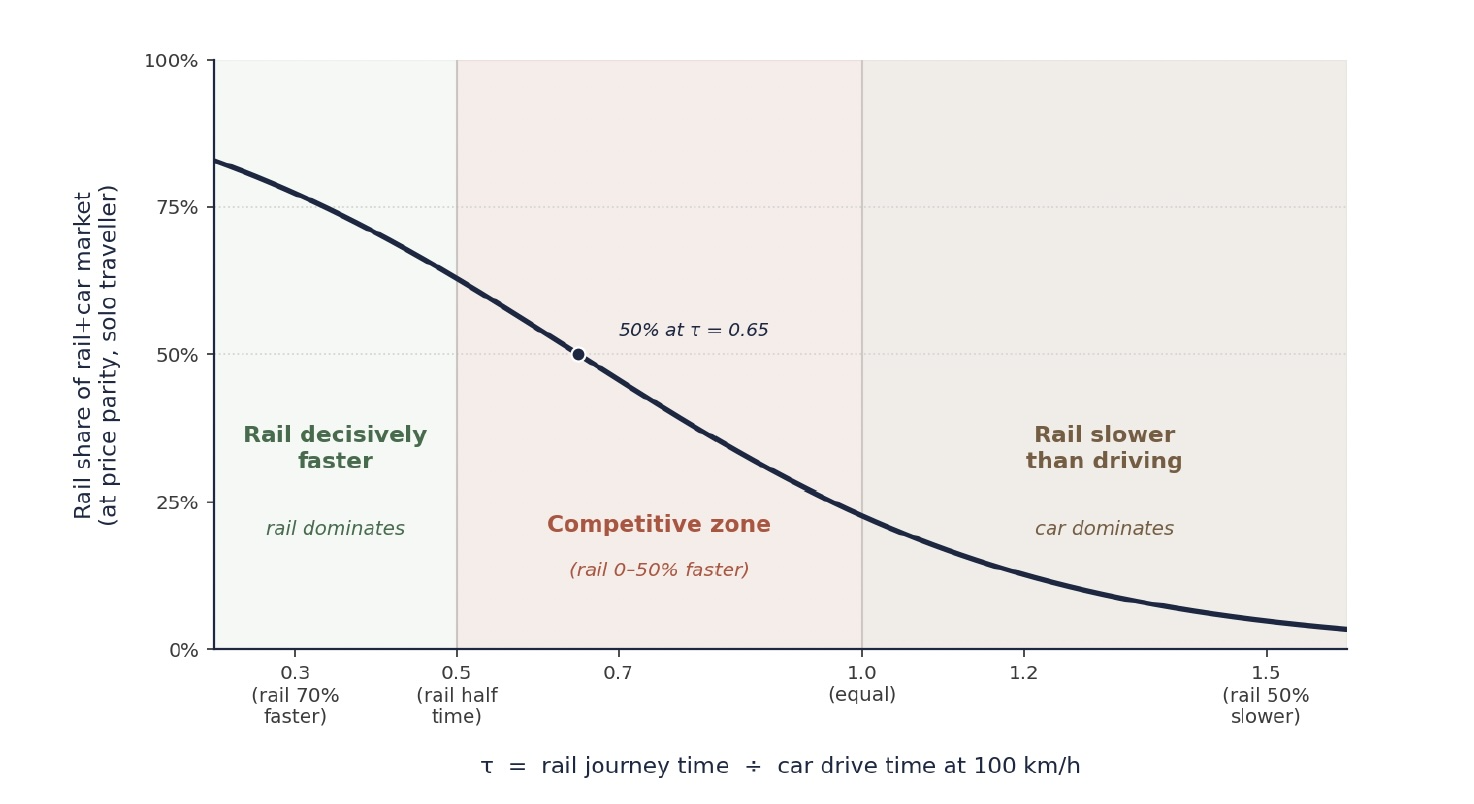
The European calibration in Figure 1 represents what rail can achieve under conditions that favour modal shift — high fuel taxes, congestion charging, dense feeder transit, central stations, and a cultural baseline of rail use. North American conditions are systematically less favourable, and the same τ produces lower rail shares.
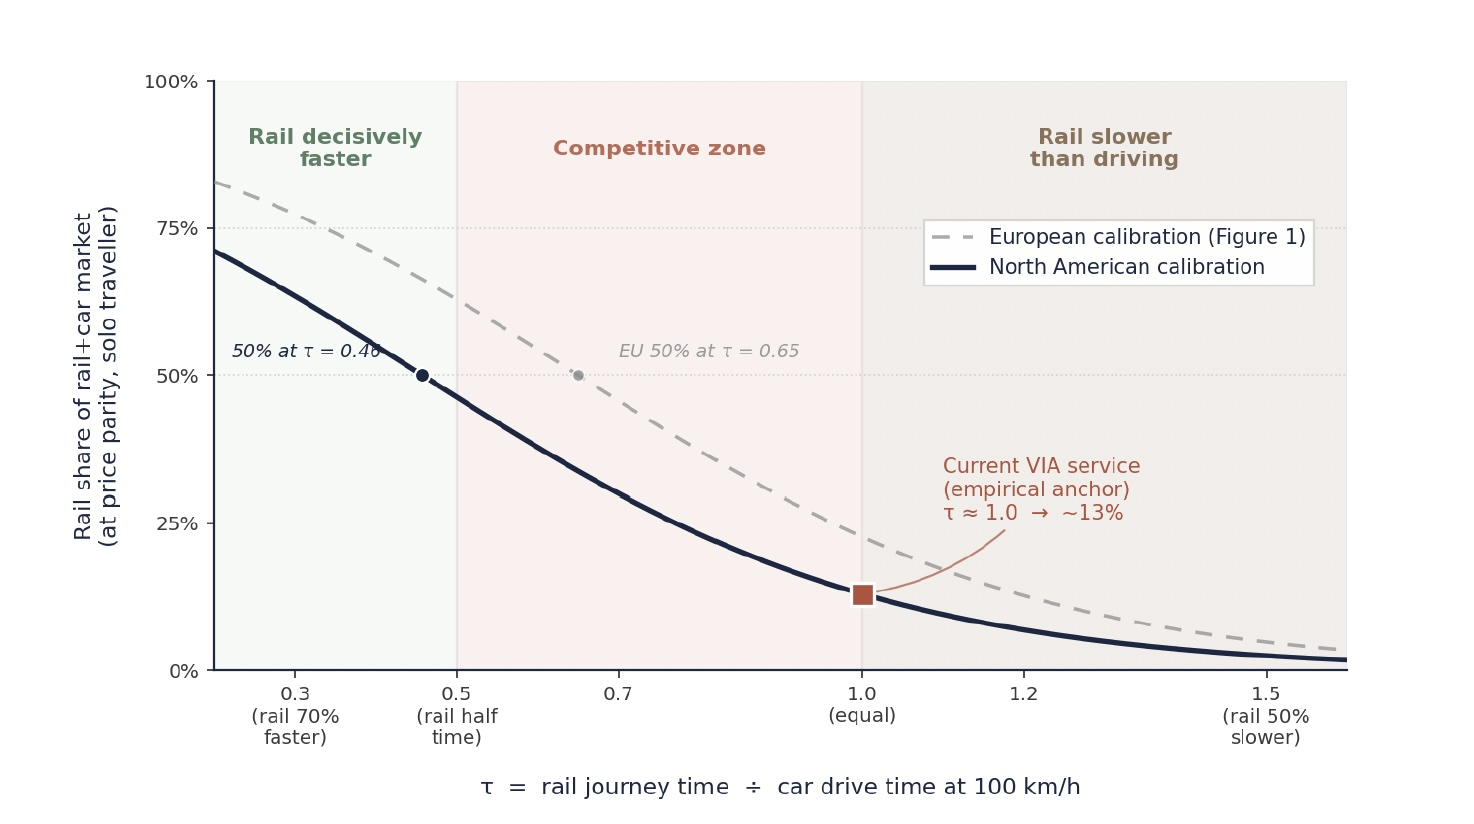
Read together, Figures 1 and 1b bracket the realistic range. The European curve represents what is achievable in principle if rail-favourable conditions were created; the NA curve gives what is achievable under prevailing structural conditions. The remainder of this note uses the NA calibration, with European-equivalent figures quoted alongside where the comparison is informative. The gap between them is policy-relevant: roughly 10 to 15 percentage points of modal share depend not on which infrastructure is built but on whether the broader transport-policy environment supports modal shift.
Empirical anchors and the North American context
The Paris–Lyon TGV cut journey time from ~4 hours to under 2 and lifted rail’s share against road from ~30% to ~67% — a 37-point shift. Madrid–Barcelona AVE and Tokyo–Osaka Shinkansen deliver comparable shares against parallel highways. But all operate under conditions the corridor does not share. North America carries none of these reinforcements: the 401/A20 is toll-free end-to-end, Canadian fuel taxes are roughly one-third of European levels, there is no congestion charging in any Canadian city, and land use at both ends is car-oriented. The cross-elasticity literature confirms rail and car barely substitute — a 10% rise in fuel prices produces only a 1 to 4% rise in transit ridership.
Elasticity, group size, and perceived cost
The road–rail price comparison differs from rail–air in three ways: the elasticity of substitution is higher, the per-person ratio depends decisively on group size, and the cost of driving travellers actually weigh is the perceived cost (mostly fuel), not the full economic cost. The same logit form applies, but with a larger price coefficient (γ = 1.5 against 1.0 for rail–air), reflecting own-price elasticities of −1.0 to −1.6 for leisure demand against −0.4 to −0.7 for business.
European price family
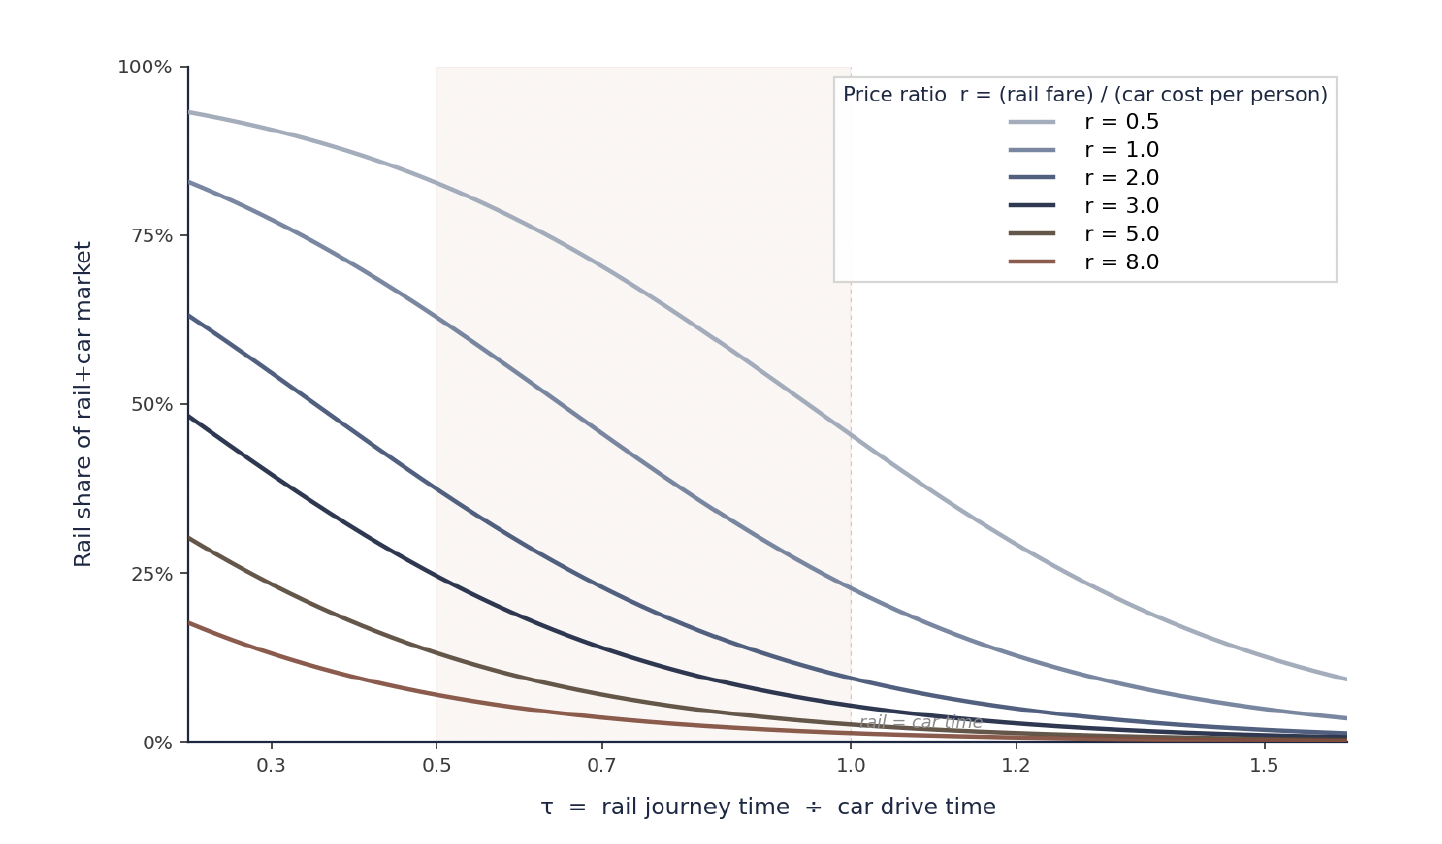
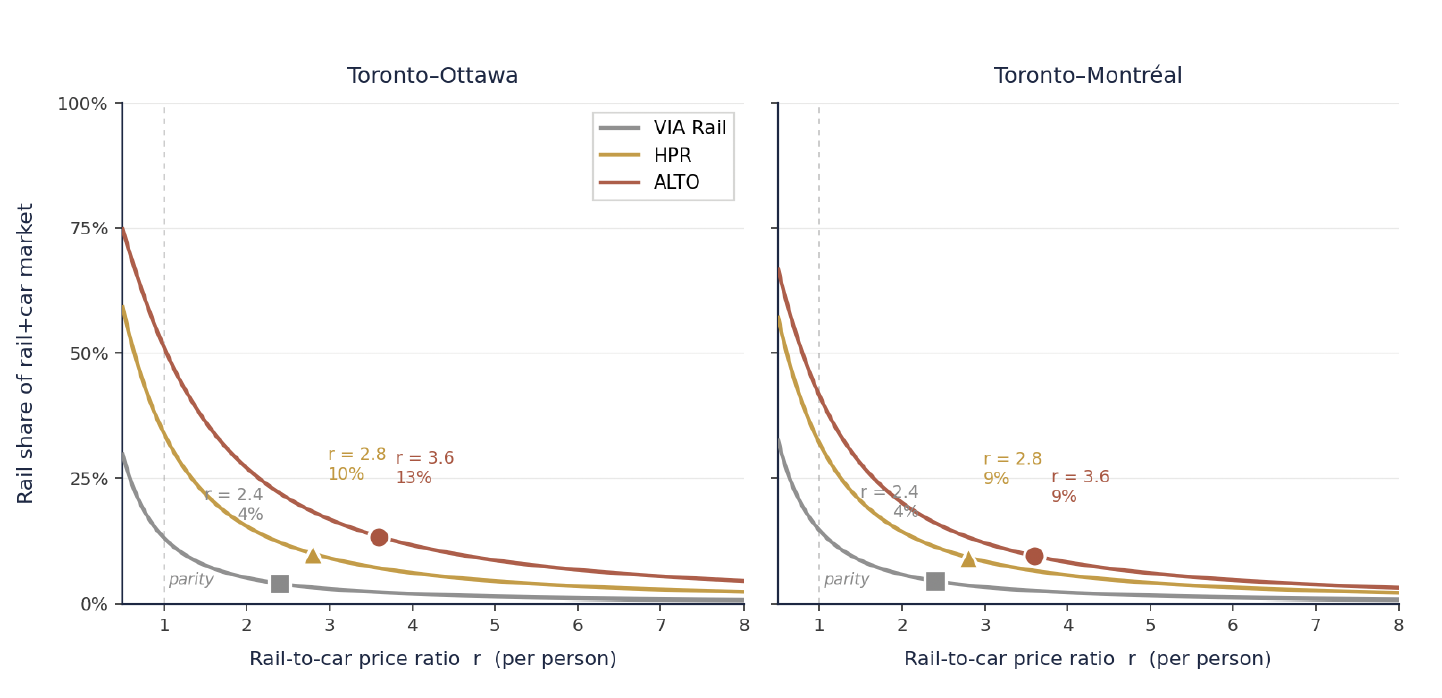
Figure 2a shows the curve family at six price ratios under the European calibration. The wide range (0.5 to 8.0) reflects that group travel can drive the per-person ratio well above 5 even at parity-pricing intentions, since car cost divides among occupants while rail fare does not.
North American price family
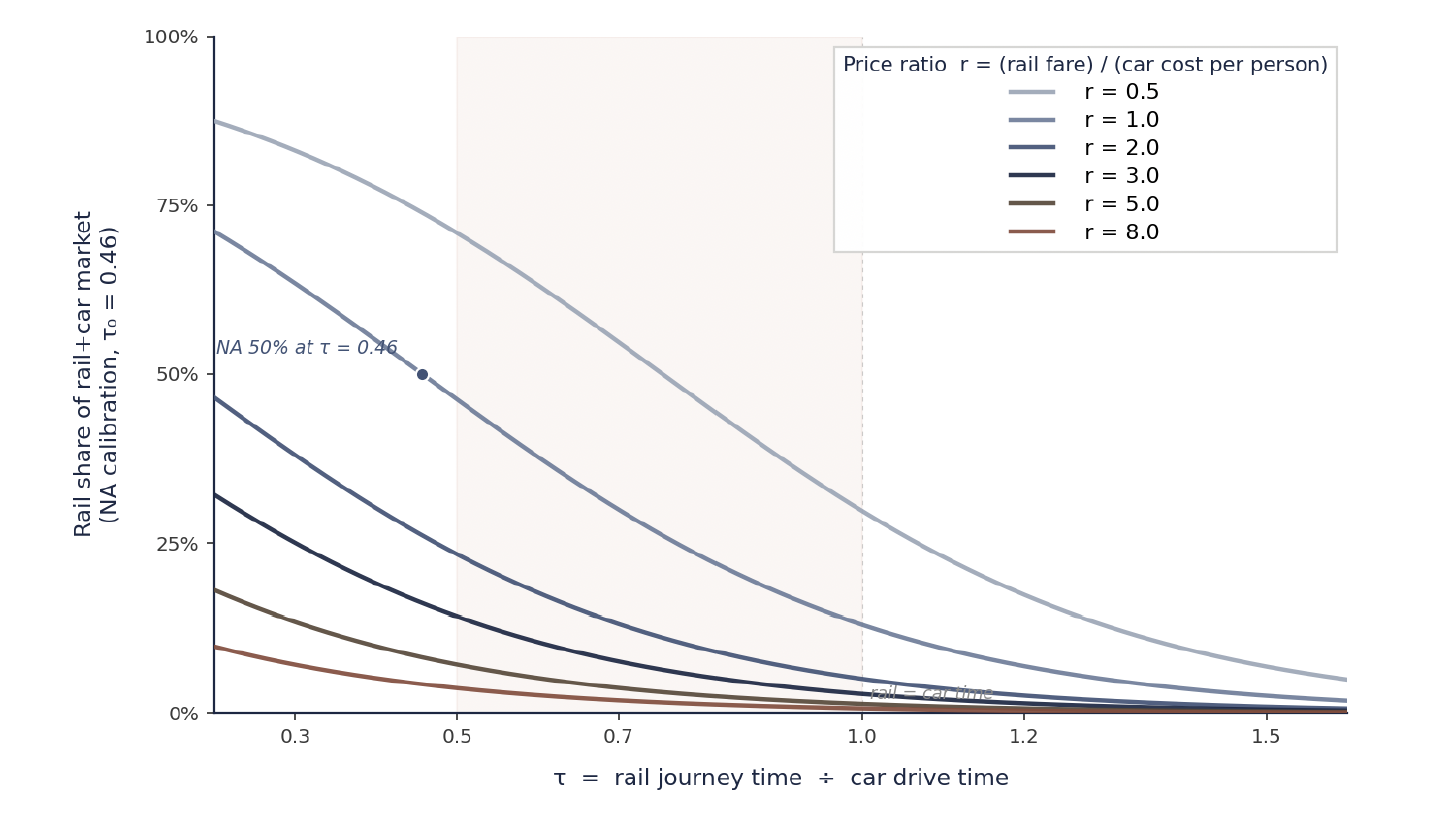
Figure 2b applies the same six ratios under the NA calibration (τ₀ = 0.46). Each curve sits 15 to 20 points below its European counterpart at every τ. This family drives the corridor predictions in the rest of the note.
Perceived versus full cost of driving
Drivers compare rail fare against the perceived cost of driving, not the full economic cost. On Toronto–Montréal, one-way fuel for a typical car (9.4 L/100 km at ~$1.65/L) is about $84; the full economic cost — depreciation, insurance, maintenance — is more than three times that, around $300. But fixed costs are not perceived at the moment of choice; the car is owned regardless. A VIA Economy fare of ~$80 against perceived car cost of $84 produces a price ratio near 1.0 for a solo traveller. Against full cost the same fare would imply a ratio of 0.27 — and would predict a far larger rail share than the corridor actually carries, the empirical tell that perceived cost is the right input.
The group-size effect
Cars carry one to four passengers at a single fuel cost; rail charges per ticket. The per-person rail-to-car ratio is therefore ~1.0 for a solo traveller, 1.9 for a couple, 2.9 for three, and 3.8 for a full car of four. Family travel and any leisure trip with two or more travellers structurally favours the car — a multiplier with no analogue in the rail–air comparison. At parity pricing, ALTO’s Toronto–Ottawa share drops from ~51% solo to ~12% for a family of four; on Toronto–Montréal from 41% to 8%.
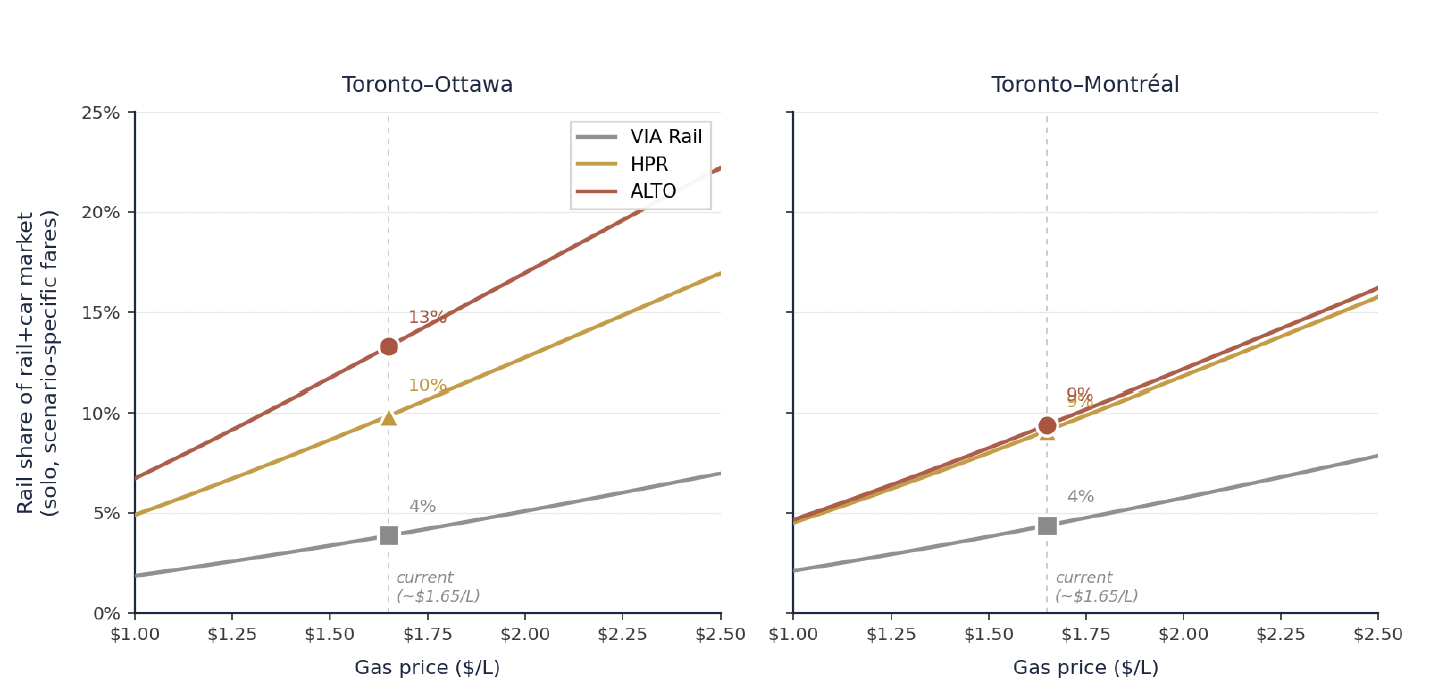
Gas price as a modal-shift lever
Because perceived car cost is dominated by fuel, the price ratio is sensitive to gas prices in a way the air comparison is not. A swing from $1.30 to $2.00/L — well within historic range — moves the solo Toronto–Montréal ratio from 1.21 to 0.79. Carbon pricing and fuel-tax policy are levers on rail modal share that operate as strongly as line-haul speed, at much lower capital cost.
Where the corridor sits on the curve
The same two principal pairs carry the bulk of rail-substitutable demand, but the absolute road flow is very large. The 401 between Toronto, Kingston, Ottawa and Montréal carries tens of millions of person-trips a year — several times the corridor’s air person-trips. Even a small percentage shift represents a meaningful absolute volume.
| City pair | Air | Rail (VIA) | Car | Rail share of rail+air | Rail share of rail+car |
|---|---|---|---|---|---|
| Toronto–Montréal | ~1.9 M | ~800 K | ~6 M | ~30% | ~13% |
| Toronto–Ottawa | ~0.9 M | ~800 K | ~4.5 M | ~47% | ~14% |
| Ottawa–Montréal | ~0.45 M | ~525 K | ~4 M | ~54% | ~12% |
Three observations follow. The road-substitutable market dwarfs the air-substitutable market on every pair — car volumes are three to ten times rail+air combined. Current rail-vs-air shares are already meaningful (~30% on Toronto–Montréal, ~half on the shorter pairs), but rail-vs-car shares sit in the 12 to 14% range across all three. And the structural similarity of road–rail shares despite very different distances confirms the τ-normalisation: current VIA service produces τ values close to 1.0 on every pair.
| City pair | Distance | Car (401) | VIA current | HPR (200 km/h) | ALTO (300+ km/h) |
|---|---|---|---|---|---|
| Toronto–Ottawa | ~450 km | ~4 h 30 min | ~4 h 30 min | ~2 h 55 min | ~2 h |
| Toronto–Montréal | ~540 km | ~5 h 30 min | 5 h 13 min* | ~3 h 38 min | ~3 h |
| Ottawa–Montréal | ~190 km | ~2 h | ~1 h 55 min | ~1 h 30 min | ~1 h |
| City pair | VIA current | HPR (200 km/h) | ALTO (300+ km/h) |
|---|---|---|---|
| Toronto–Ottawa | ~13% | ~34% | ~51% |
| Toronto–Montréal | ~15% | ~32% | ~41% |
These are the time-only readings under the most favourable price configuration. Real corridor traffic is a mix of solo, couple and family travel, with fares that may rise above current VIA levels if HPR or ALTO recover more capital from passengers. Section 4 produces a more realistic envelope.
Where the corridor sits on the price axis
Figure 3 plotted the scenarios at price parity — the most favourable assumption for rail. But HPR and ALTO carry higher capital and operating costs than VIA’s shared-track service, and any realistic operating model recovers part of that from passengers. International HSR and the Brightline comparator place premium fares 30 to 80% above conventional rail. This analysis takes a moderate set: HPR at ~20% premium (r = 1.2), ALTO at ~50% premium (r = 1.5).
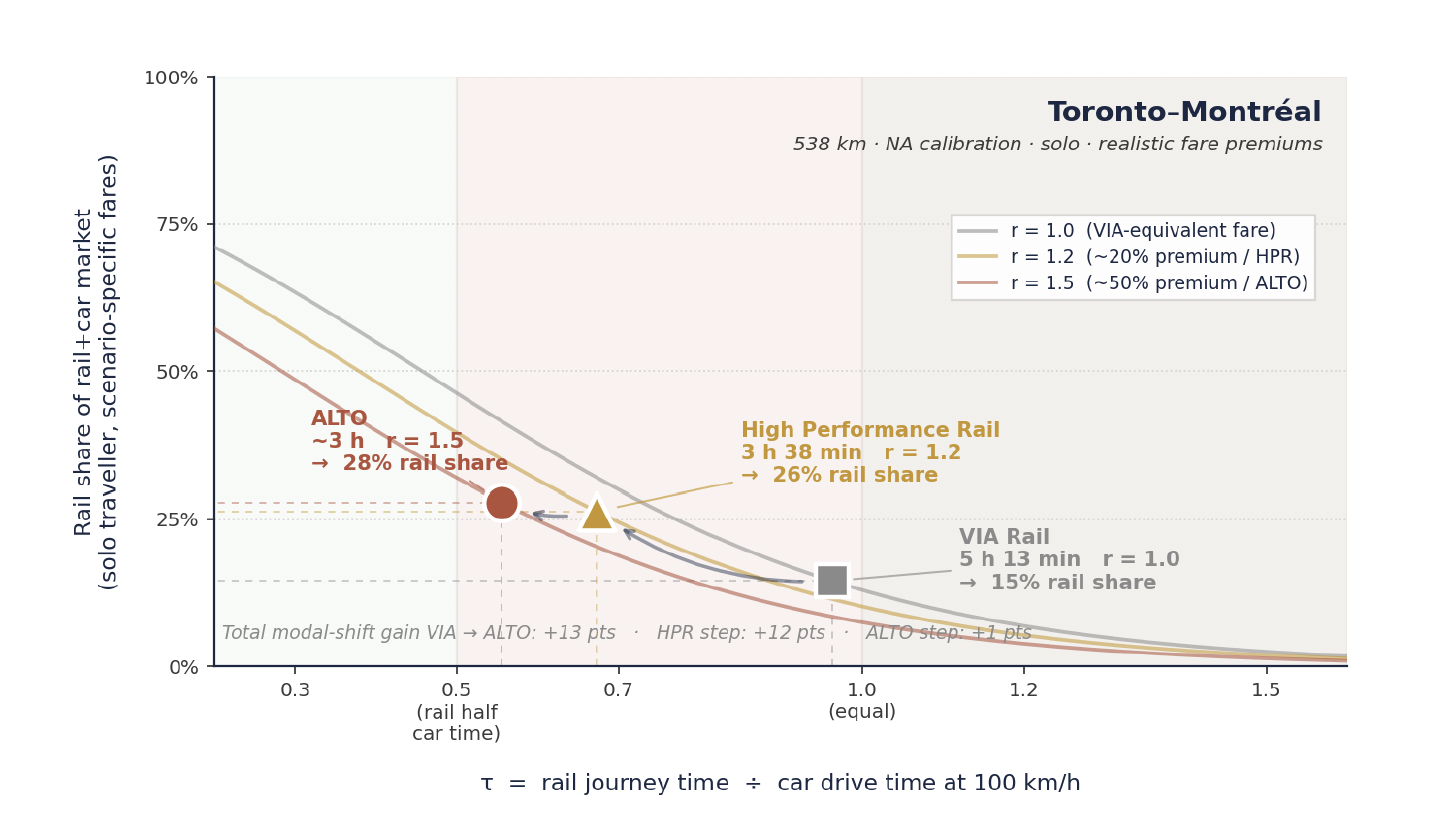
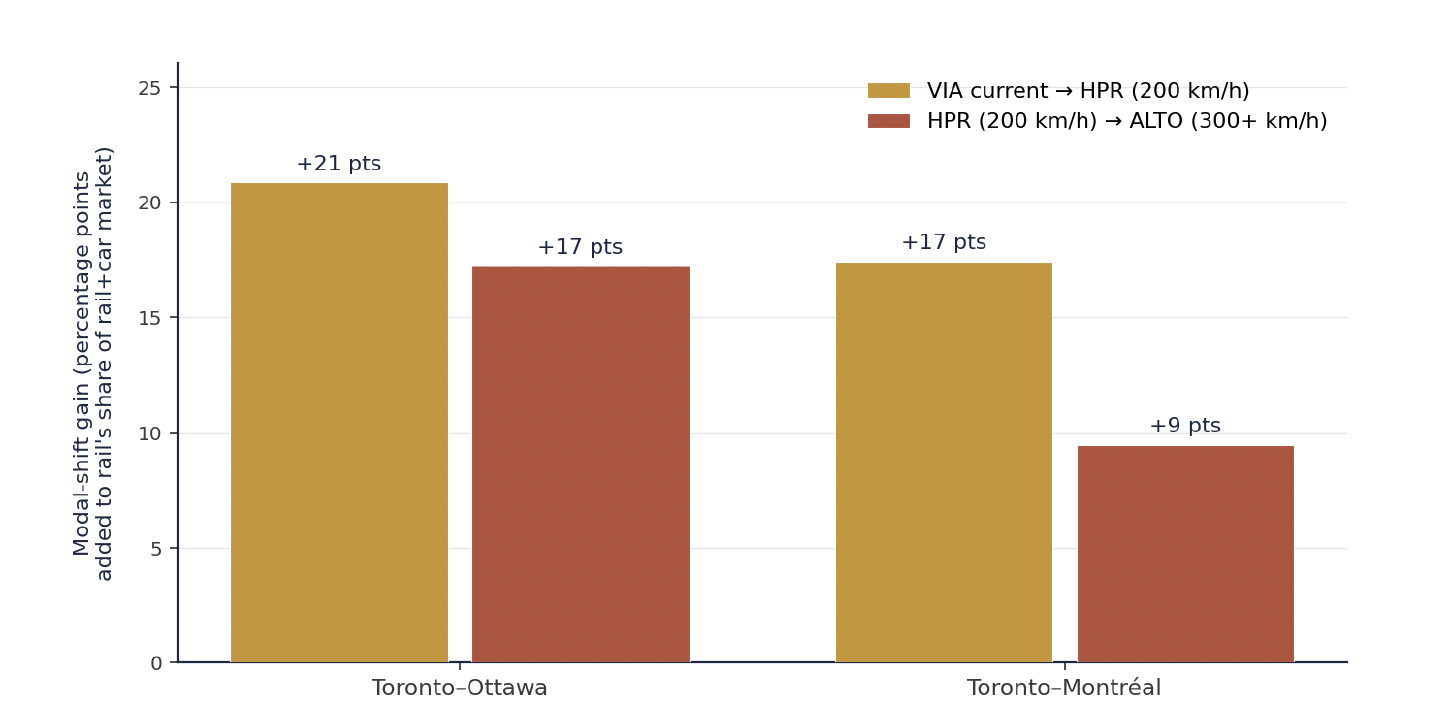
Three observations follow. First, ALTO’s modal-share advantage over HPR — already modest at parity (+9 points on Toronto–Montréal) — essentially disappears once realistic fare premiums are applied, the two converging to within a point of each other. Second, this is robust: sensitivity at ALTO premiums between 30 and 80% produces ALTO shares between 30 and 24%, all within a few points of the HPR 26% reading. Third, the HPR step from current VIA to a dedicated 200 km/h corridor at VIA-equivalent fares captures essentially all of the realistically achievable road–rail modal shift; ALTO’s 300+ km/h capability is real but largely cancelled by the fare premium needed to fund it.
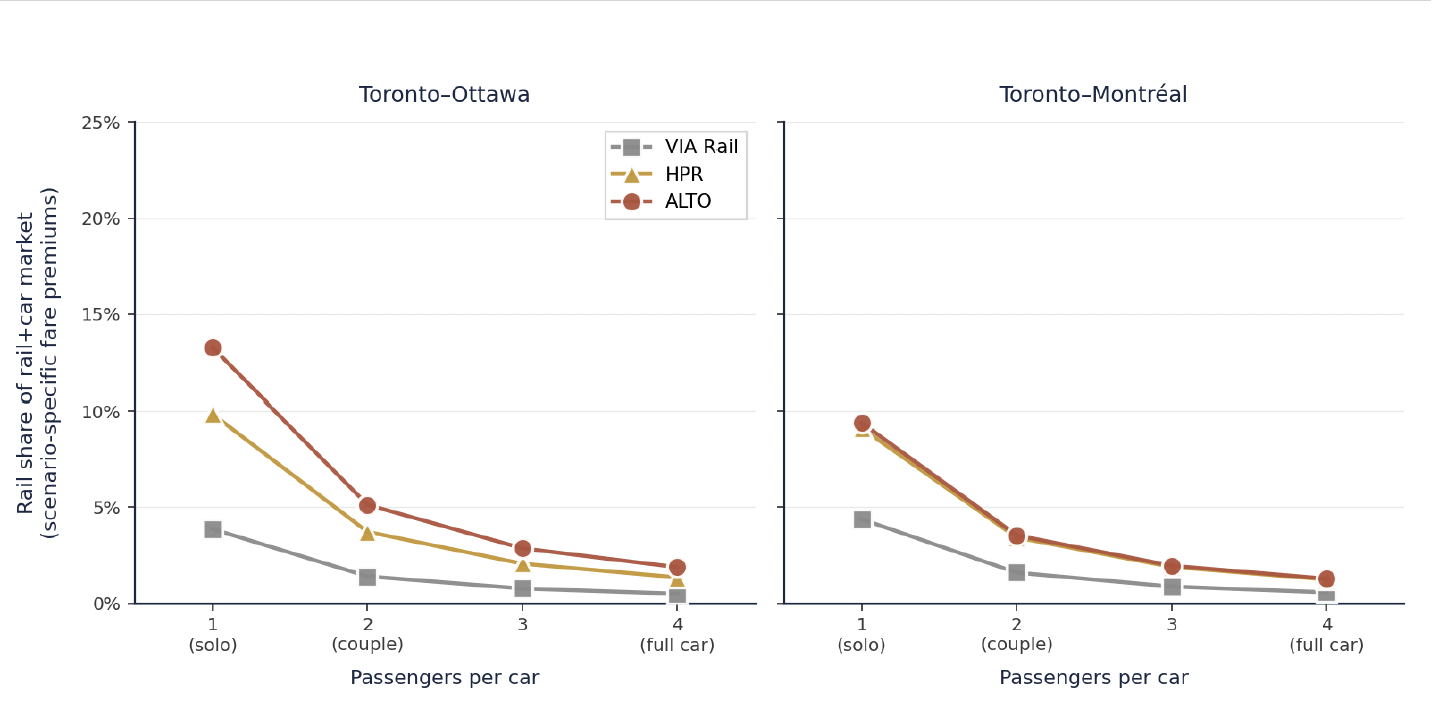
The rail-substitutable portion of corridor road traffic is concentrated on solo travellers paying single-person fares against per-person fuel costs. A second passenger halves rail share again; a car of three or four cannot be captured at any travel time or defensible fare. This narrows the realistic market to a small fraction of total road flow — predominantly business, single-traveller leisure, and downtown-to-downtown trips.
Two policy implications follow. The corridor’s modal-shift outcomes are not solely a function of which infrastructure is chosen — they also depend on fuel pricing, carbon pricing and the broader transport-policy environment. And the comparative performance of HPR and ALTO is roughly stable across the gas-price range, so the scenario comparison is robust to fuel-price assumptions even if the absolute levels are not.
On-time performance and reliability
Reliability operates as an effective time penalty whenever on-time performance (OTP) drops below a threshold travellers can rely on. Unreliable service makes travellers take an earlier departure than schedule alone requires, inflating their effective journey time by the buffer they carry. The model adds a utility term δ·(OTP_ref − OTP), with δ = 2.0 (the Wardman midpoint) and OTP_ref = 0.85 (VIA’s 2023 reported figure).
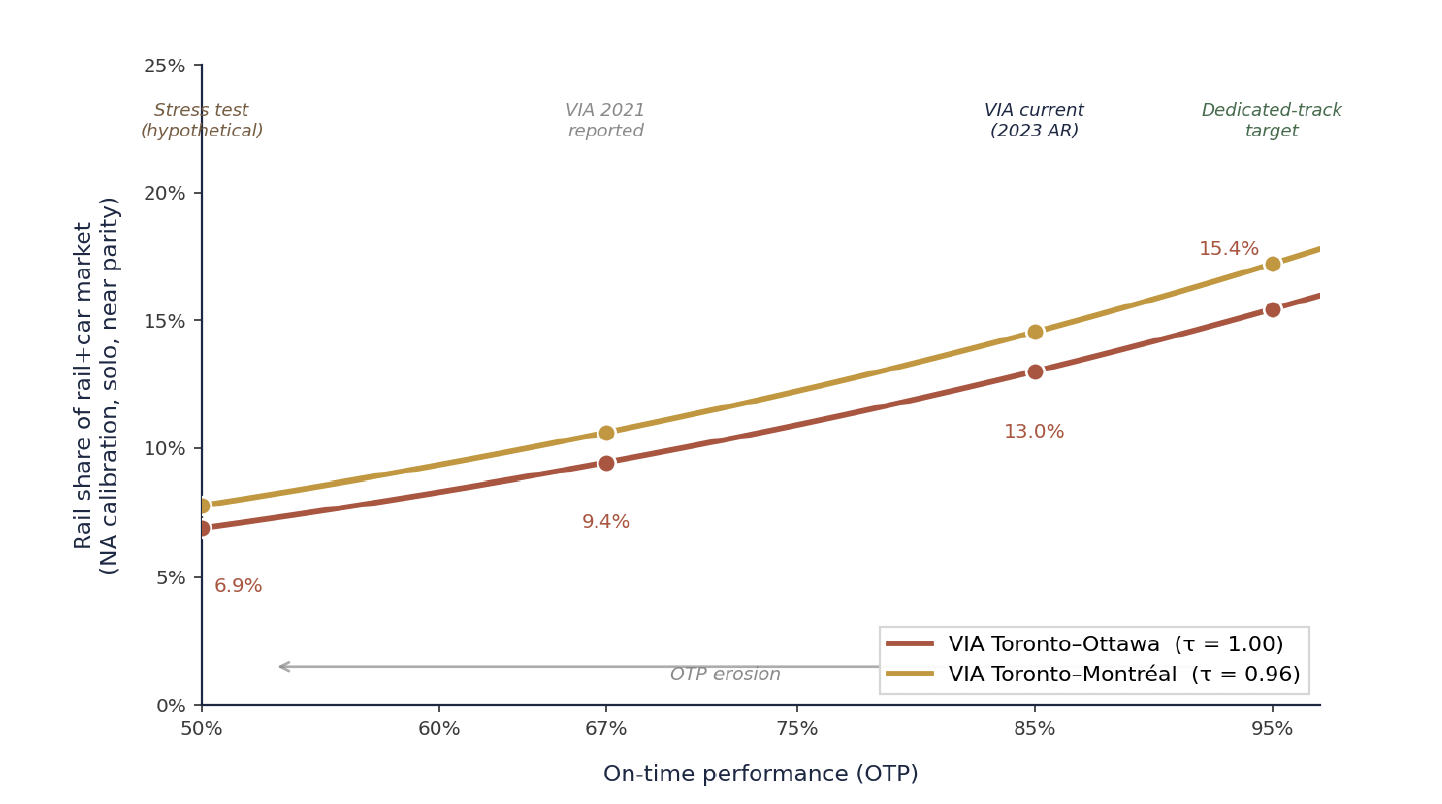
Three points follow. OTP is a meaningful but not dominant lever — its dynamic range across the observed band is about ±5 points, comparable to a $0.50/L fuel swing or a solo-to-couple shift. OTP and price are partial substitutes: a 10-point OTP improvement is worth roughly a 14% fare cut, which is why Brightline advertises 92% OTP precisely to support a fare premium. And crucially, the OTP gain inheres in the dedicated-track step, not the speed step — both HPR and ALTO eliminate the freight-train conflicts on shared CN track that cause VIA’s reliability problems, so OTP is not a differentiator between them.
Where the modal-shift returns sit on the curve
Because the curve is logistic, the value of additional time savings depends on where a route starts. On Toronto–Ottawa under the NA calibration, moving from VIA (τ = 1.00, ~13%) to HPR (τ = 0.65, ~34%) approaches the inflection and delivers the largest single increment; the move to ALTO (τ = 0.44, ~51%) adds another as the curve crosses its inflection. On Toronto–Montréal, the moves go from VIA at ~15% to HPR at ~32% to ALTO at ~41%.
The cost-effectiveness comparison is more challenging for ALTO than for HPR. ALTO’s $60–90 billion envelope is an incremental investment of $40–70 billion above the HPR option. Spread across the additional 9 to 17 points ALTO captures over HPR at canonical NA conditions, that works out to roughly $2.5 billion to $8 billion per percentage point — with the important caveat that road–rail shift, in absolute trip volumes, represents a much larger total person-trip diversion than the air–rail equivalent.
What this means for the corridor decision
Six conclusions follow from putting the road–rail evidence alongside the air–rail analysis.
Structurally different from rail-vs-air
The car competes at all distances; the competitive zone is narrower (1.5 to 3 hours); perceived cost is dominated by fuel; group travel tilts decisively toward driving; cross-elasticities are remarkably low; and structural North American conditions all suppress rail’s position relative to European comparators.
The road prize is bigger
Despite the headwinds, road-substitutable demand is far larger in absolute terms than air-substitutable demand. Even modest rail shares translate to large absolute diversions — between 1.4 and 3 million additional rail trips a year on the principal pairs. The road prize is bigger; it is just structurally harder to capture.
Policy levers rival infrastructure
Group size and fuel pricing are levers as substantial as the HPR/ALTO choice. Family travel suppresses rail share by ~75%; sustained higher fuel prices lift it by 15 to 30 points. Carbon pricing, fuel tax, congestion charging and parking pricing operate at much lower capital cost.
Reliability is a dedicated-track gain
OTP is substantial but bounded, and the gap between shared-track and dedicated service is captured by the move from VIA to either HPR or ALTO. The OTP step is inherent in the dedicated-track decision, not the speed decision.
Sixth, this is the regime in which the High Performance Rail framework is most defensible on modal-shift grounds. The HPR step from VIA’s shared-track service to a dedicated, electrified 200 km/h corridor at VIA-style fares captures the majority of the road–rail opportunity on both pairs — adding 21 points on Toronto–Ottawa and 17 on Toronto–Montréal. ALTO’s additional speed adds 9 to 17 points at solo, near-parity conditions, but those points cost $40–70 billion above HPR, and under realistic group-mix and price assumptions the incremental advantage shrinks further.
Taken together with the parallel rail–air analysis, the corridor decision turns on whether the right framework is being used. Modal-shift performance is multi-dimensional — time, price, group size, fuel cost, traveller type, structural context — and the headline time-only advantage that motivates ALTO’s case shrinks substantially once these dimensions are admitted. The High Performance Rail framework delivers the bulk of the corridor’s achievable modal-shift outcomes — on both the air market and the road market — at roughly a quarter of ALTO’s capital cost.
Modelling approach
The S-curve is a standard logistic of the form S(τ) = 1 / (1 + exp(K·(τ − τ₀))), where S(τ) is rail’s share of the combined rail+car market as a function of the time ratio τ = (rail time) ÷ (car drive time at 100 km/h). The τ-normalisation is a meaningful departure from the absolute-time framing of the rail–air analysis: because the car comparator scales with distance, τ gives a distance-invariant measure of rail’s competitive position. Parameters are K = 3.5 and τ₀ = 0.65 (European). The price family adds a utility term: S(τ, r) = 1 / (1 + exp(K·(τ − τ₀) + γ·ln r)), with γ = 1.5 — larger than the rail–air γ = 1.0, reflecting higher own-price elasticities for car-vs-rail substitution. For group travel, r_effective = r_solo × n.
Two calibrations are presented. The European calibration (τ₀ = 0.65) is fitted to the TGV Paris–Lyon pre/post comparison. The North American calibration (τ₀ = 0.46) is anchored on current VIA’s ~13% rail share at τ ≈ 1.0; the two differ only in τ₀, the shift equivalent to a constant penalty α ≈ 0.67. The parameters are illustrative rather than predictive; sensitivity at K between 2.5 and 4.5, τ₀ between 0.40 and 0.75, and γ between 1.2 and 1.8 produces the same qualitative conclusions. An important caveat: the binary-logit model captures time-and-price geometry but not the structural North American factors — free parking, dispersed land use, weak feeder transit, family-travel norms, cultural autonomy preference — that suppress rail share. Model predictions should be read as upper bounds; realised share is likely 30 to 50% below them. Brightline Miami–Orlando, the closest North American analogue, is in extended ramp-up with bond ratings downgraded to CCC+, indirect confirmation that achievable shares emerge slowly here.