Tag: uniqueness trap

  • Deconstructing the Megaproject Playbook

    ALTO HSR Citizen Research Initiative · The HPR Research Report · Chapter 1

    Deconstructing the Megaproject Playbook

    Why big rail projects almost always cost more and carry fewer riders than promised — and how to check a project’s numbers against the real-world record, not just its own promises.

    This chapter explains the method behind every number in this report. It’s based on the work of Bent Flyvbjerg, an Oxford researcher who has spent decades studying how big infrastructure projects around the world actually turn out, compared to what they promised. His findings have been confirmed again and again, across many countries and many kinds of projects. We use his method for every forecast in this report — and we’re explaining it here first, before any of our own results, so you can see the rules before you see the numbers.

    Source Note

    Some of what’s below — the difference between honest mistakes and deliberate spin, ALTO’s risk profile, and why calling a project “unique” doesn’t hold up — was covered in more depth in an earlier paper from the Initiative, The Anatomy of an Optimistic Forecast (June 2026). We’ve restated the key points here so this chapter stands on its own, but if you want the fuller case — including a look at ALTO’s own June 2026 benefit studies — that paper is the place to go.

    Download
    Chapter 1: Deconstructing the Megaproject Playbook (PDF)
    The full chapter, with footnotes and sourcing
    Download PDF
    Companion Paper
    The Anatomy of an Optimistic Forecast (PDF)
    The fuller, more detailed case against ALTO’s forecasts
    Download PDF
    1.1 · The Track Record

    The iron law of megaprojects

    Here’s an uncomfortable fact: big public infrastructure projects almost always cost more, take longer, and carry fewer passengers than promised. This isn’t bad luck on any one project — it’s been true again and again, everywhere records have been kept, for decades. Researcher Bent Flyvbjerg calls this the iron law of megaprojects: over budget, over time, under benefits — over and over again, regardless of country, project type, or how sophisticated the planning was.

    1.40×
    What rail projects actually cost, on average, vs. what was first promised
    0.66×
    The benefits rail projects actually deliver, on average, vs. what was promised
    52%
    Average budget overrun for high-speed rail specifically
    106%
    How much rail projects overestimate rider numbers, on average
    9/10
    Rail projects that predicted more riders than they actually got
    +45%
    How much longer construction takes than planned, on average

    Our own analysis of ALTO finds the same pattern. ALTO’s official benefit-cost ratio — a standard measure of whether a project’s benefits are worth its costs — is already below the threshold the federal government uses to reject projects. Correct ALTO’s cost and ridership numbers using the real-world track record, and that ratio falls further still. This doesn’t mean going over budget is inevitable. It means any assessment that ignores this well-documented pattern is starting from an unrealistic place — not by accident, but by leaving out the most relevant evidence available. ALTO’s risk profile isn’t an unlucky exception. It’s exactly what you’d expect from a project of this size, this type, and this level of political backing.

    1.2 · Two Reasons Forecasts Go Wrong

    Honest mistakes vs. deliberate spin

    There are two different reasons a project forecast can turn out to be wrong — and it matters which one is at play, because they call for very different fixes.

    Optimism bias — the honest mistake

    Planners genuinely believe their numbers. They aren’t lying — they’re not even aware they’re being too optimistic. This is a well-documented pattern in psychology: people naturally focus on the details of their own project and forget to check how similar projects have actually gone in the past. It’s a fixable process problem — the fix is forcing real-world comparisons into every estimate.

    Strategic misrepresentation — telling people what they want to hear

    Costs get underestimated and benefits get overestimated on purpose, to get a project approved and funded. Flyvbjerg, borrowing a word from ethics, just calls this what it is: lying. It’s an incentive problem — and it’s only fixed by changing what forecasters are rewarded and held accountable for.

    In real projects, both are usually present together, and the mix shifts with the stakes. For small, low-attention projects, honest mistakes tend to be the bigger factor. For large projects with strong political backing — the kind a minister or a Crown corporation needs approved — deliberate spin tends to dominate, with honest optimism layered on top rather than absent.

    The pattern, stated plainly

    Underestimate the cost, overestimate the benefit, and you get funded. This isn’t random. It points in exactly the direction that wins the competition for a limited pool of money.

    1.3 · Structural Profile

    Where ALTO sits on the scale

    Flyvbjerg’s research lets us predict, in general terms, which kind of error is more likely for a given project — without needing to know what’s in anyone’s head. For small projects that don’t attract much political attention, honest mistakes are usually the bigger factor. For large projects with major political weight behind them, deliberate spin usually is — with honest mistakes still layered on top.
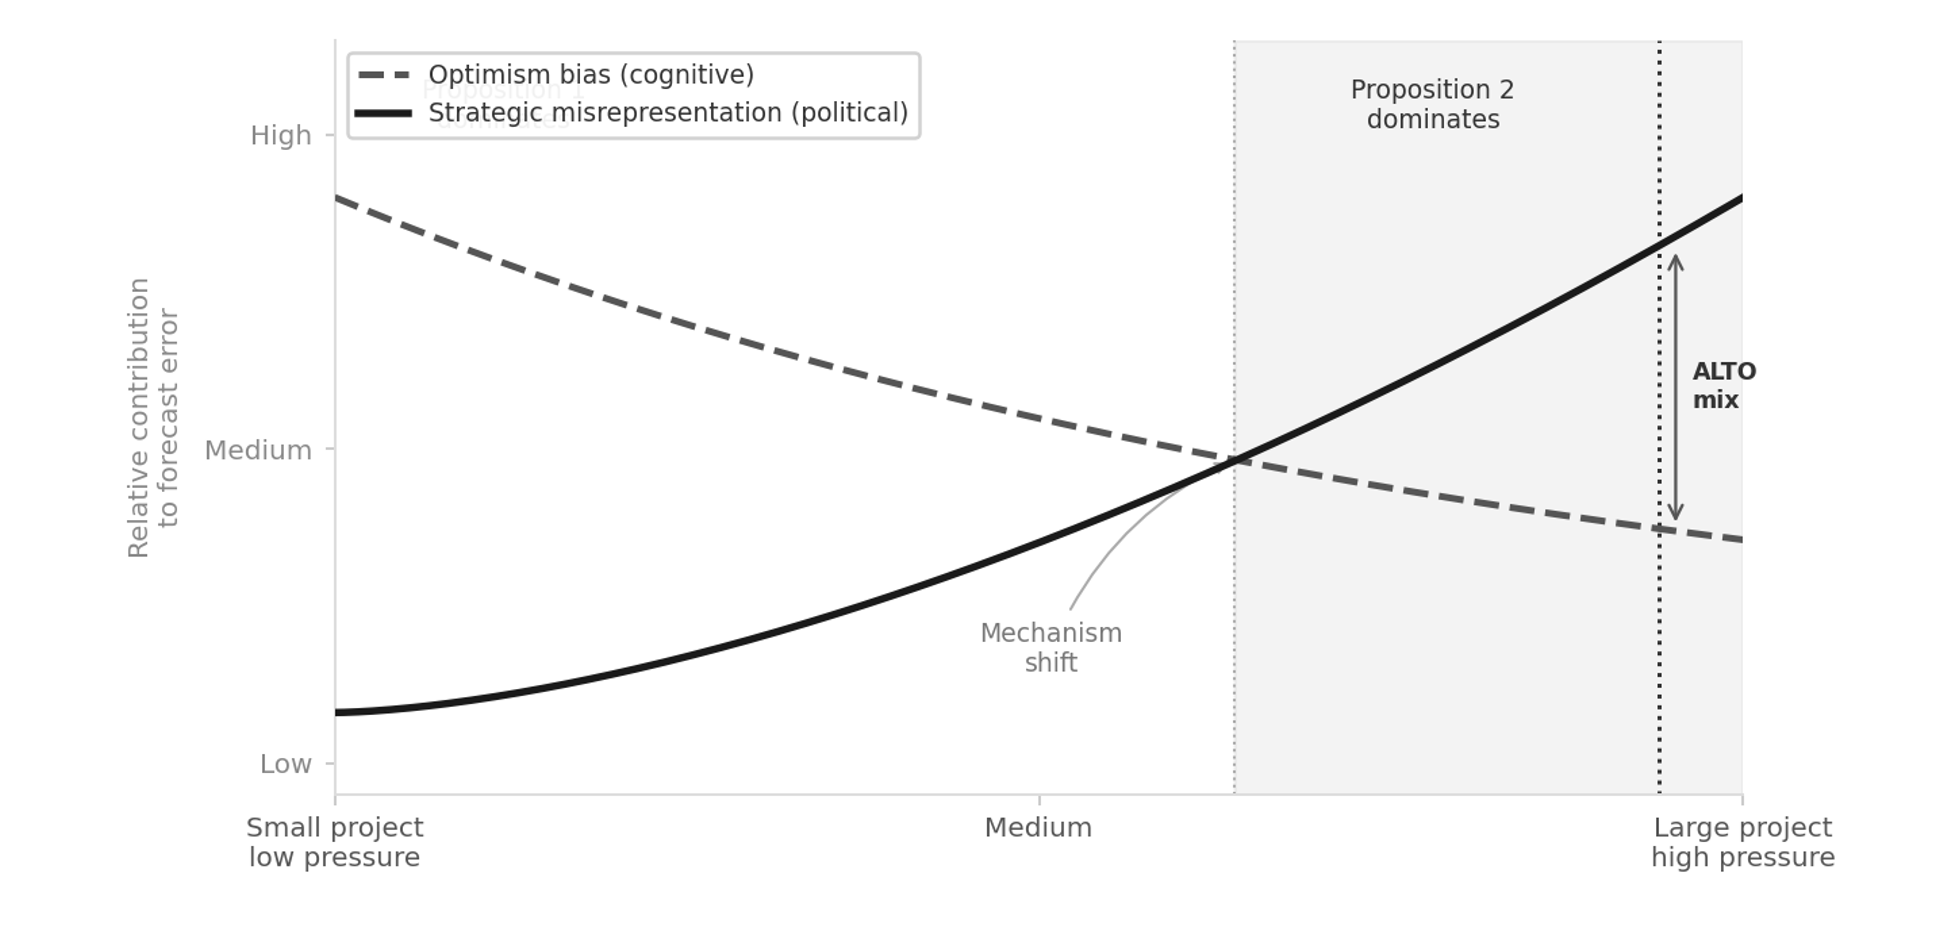
    Diagram showing how the mix of honest mistakes and deliberate spin shifts with project size and political pressure
    Figure 1.1. How the mix of honest mistakes and deliberate spin changes as a project gets bigger and more politically important. Honest mistakes (dashed line) matter more for small, low-pressure projects and fade — but never fully disappear — as projects grow. Deliberate spin (solid line) is close to zero for small projects but rises sharply and takes over for large, high-pressure ones. ALTO sits at the far right of this chart — exactly where the pattern predicts spin, not honest error, is the bigger factor.

    ALTO checks every box that predicts heavy political pressure. It’s run by a federal Crown corporation with a multi-billion-dollar budget. It has had public backing from successive governments. And it’s competing against every other federal priority for a limited pot of money. By this framework’s own logic, that’s exactly the situation where deliberate spin should be expected to be the bigger factor — not honest error. The pressure to look good is strongest exactly where the numbers matter most for getting funded.

    Flyvbjerg calls this the survival of the unfittest: it isn’t necessarily the best projects that get built — it’s the ones that look best on paper. The approval process quietly rewards optimistic numbers over honest ones: a proposal with realistic costs and realistic ridership loses the funding contest to one that doesn’t. Seen this way, the fact that ALTO has survived several rounds of budget approval isn’t proof its numbers are wrong — but it is a reason to look at them carefully rather than take them at face value.

    To be clear

    None of this requires anyone at ALTO to be lying. An honest mistake would produce errors that go in both directions about equally — some projects under budget, some over. What actually happens, again and again, is that the errors all point the same way: costs come in higher, benefits come in lower. That one-directional pattern is the tell. We’re not claiming anyone is dishonest — we’re describing what the pattern of errors implies, and leaving readers to draw their own conclusions.

    1.4 · The Uniqueness Trap

    Why “it’s different this time” doesn’t hold up

    One of the most common — and most costly — mistakes in big project planning is treating a project as one-of-a-kind, and therefore exempt from comparison with anything else. ALTO has been promoted as Canada’s first true high-speed railway, on uniquely Canadian geology, on an unprecedented corridor. That’s exactly the kind of claim researchers have found, again and again, opens the door to over-optimistic forecasting.
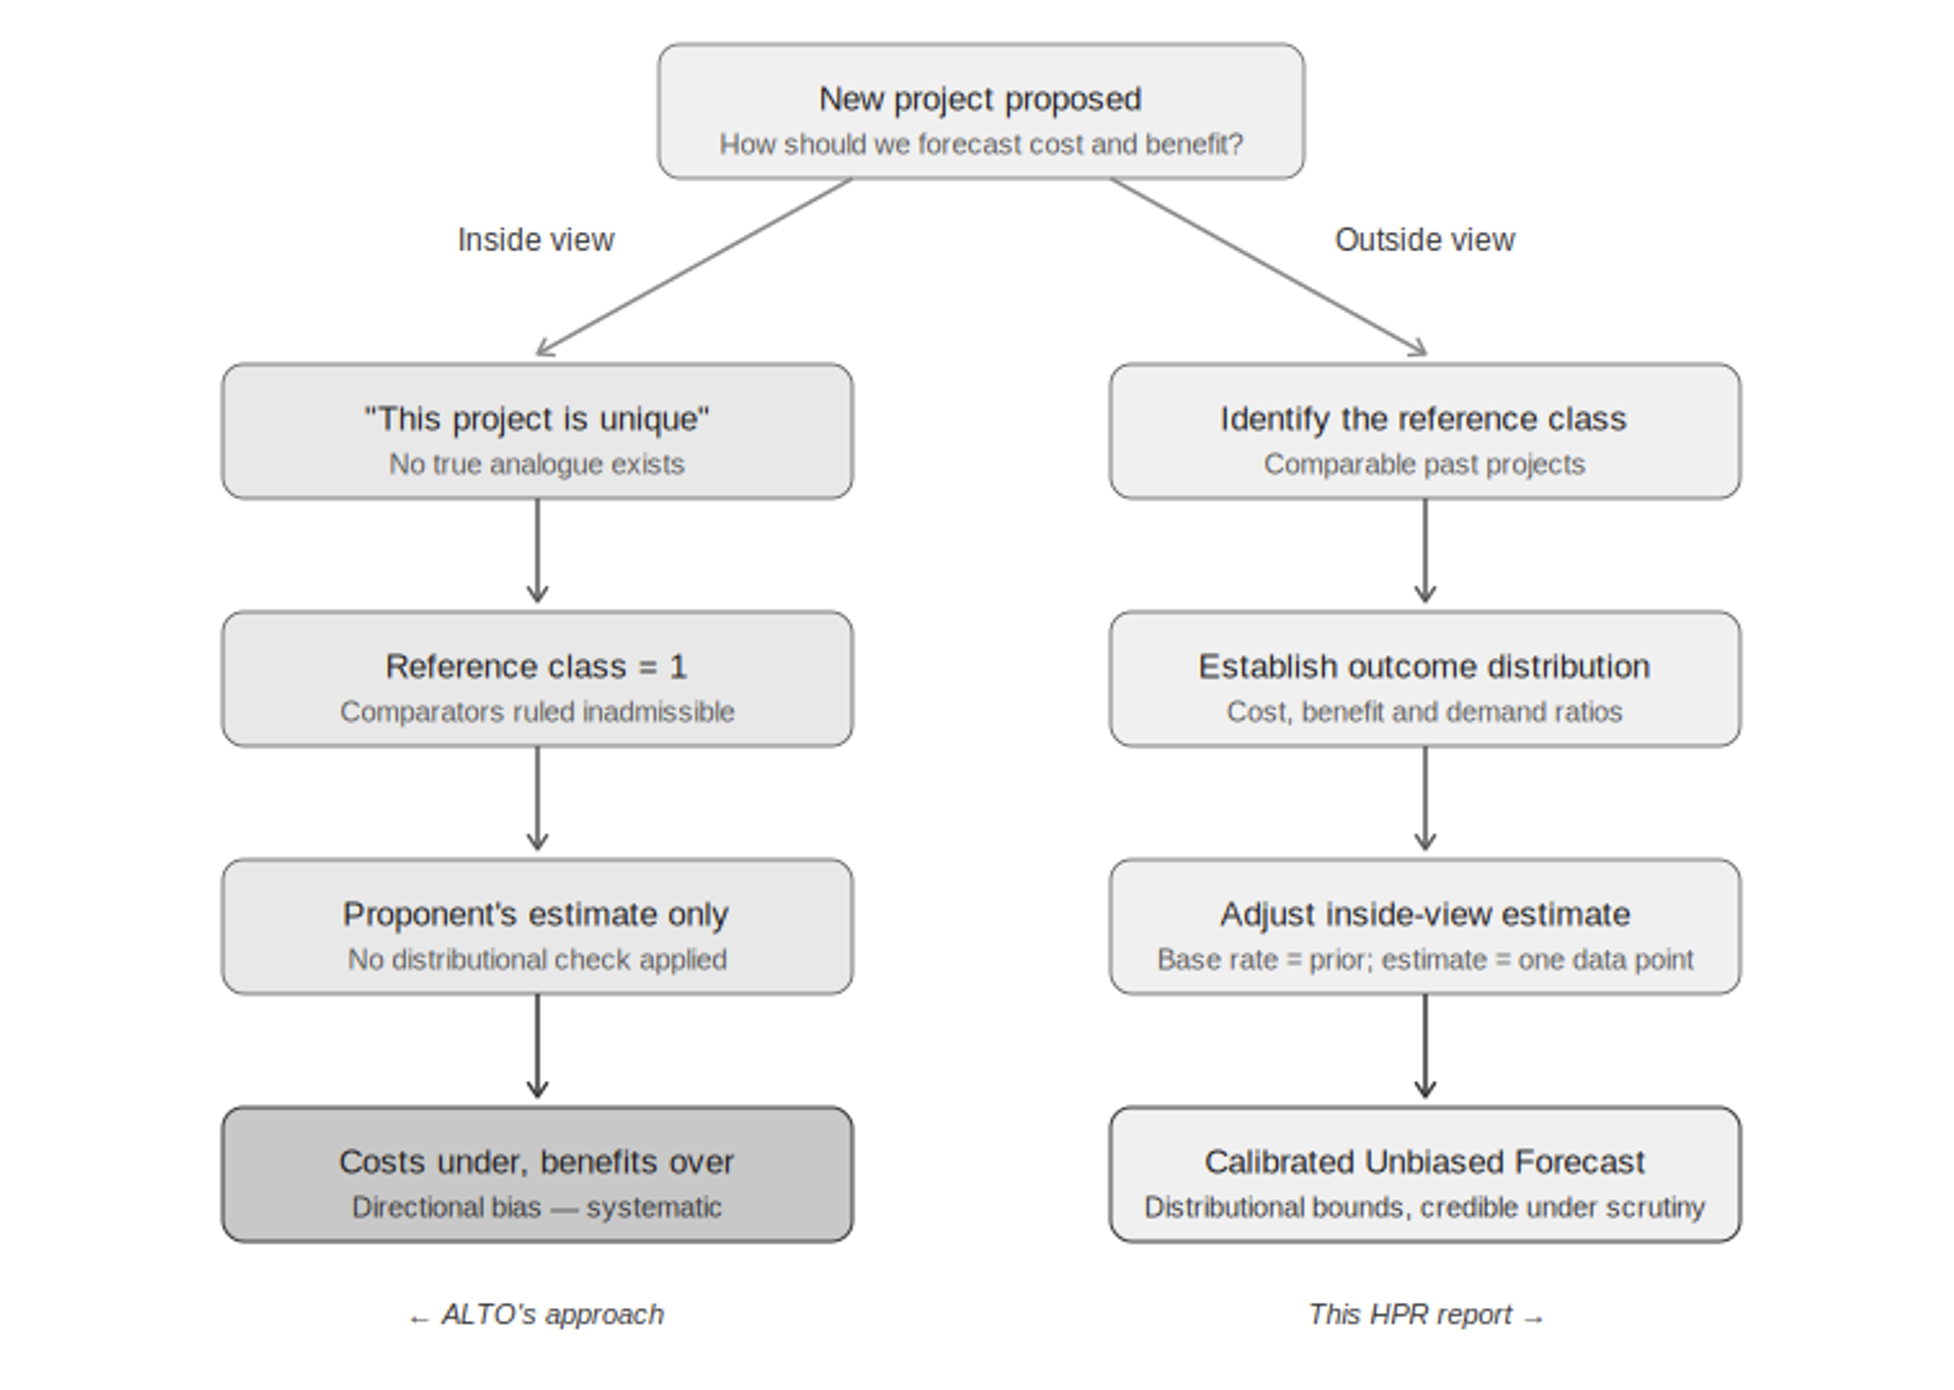
    Diagram contrasting a uniqueness claim, which leaves nothing to compare a project against, with the outside view, which checks the estimate against similar projects elsewhere
    Figure 1.2. The uniqueness trap. Claiming a project is unique (left) leaves nothing to compare it to, so all you can do is trust the project’s own estimate. Looking at similar projects elsewhere (right) means checking that estimate against real-world evidence instead. This report takes the second approach throughout.

    Here’s why the “unique” claim matters so much. If a project is truly one of a kind, there’s nothing to compare it to — which means the only evidence left is the very estimate you’re trying to check. Every comparable project, every real-world outcome from similar lines, gets waved away as not relevant. This report takes the opposite view: ALTO is one example of a well-studied category — high-speed and intercity rail megaprojects — and there’s plenty of real-world data on how that category actually performs. That data is the most relevant evidence available.

    What the disagreement is really about

    The disagreement between this report and ALTO’s own numbers isn’t really about any single figure. It’s about whether ALTO should be judged purely on its own terms, as a one-off case — or against how similar projects have actually turned out.

    1.5 · Risk of Bad Surprises

    Why standard contingency budgets fall short

    Standard project planning assumes cost risk is spread fairly evenly around a central estimate — like a bell curve — so a reasonable contingency budget can be calculated with simple statistics. The real-world data don’t support that assumption. Big infrastructure projects almost never come in significantly under budget, but they regularly come in massively over — by two or three times the original estimate in the worst cases. Statisticians call this a fat-tailed distribution: the chance of a very bad outcome is much higher than a normal bell curve would suggest.
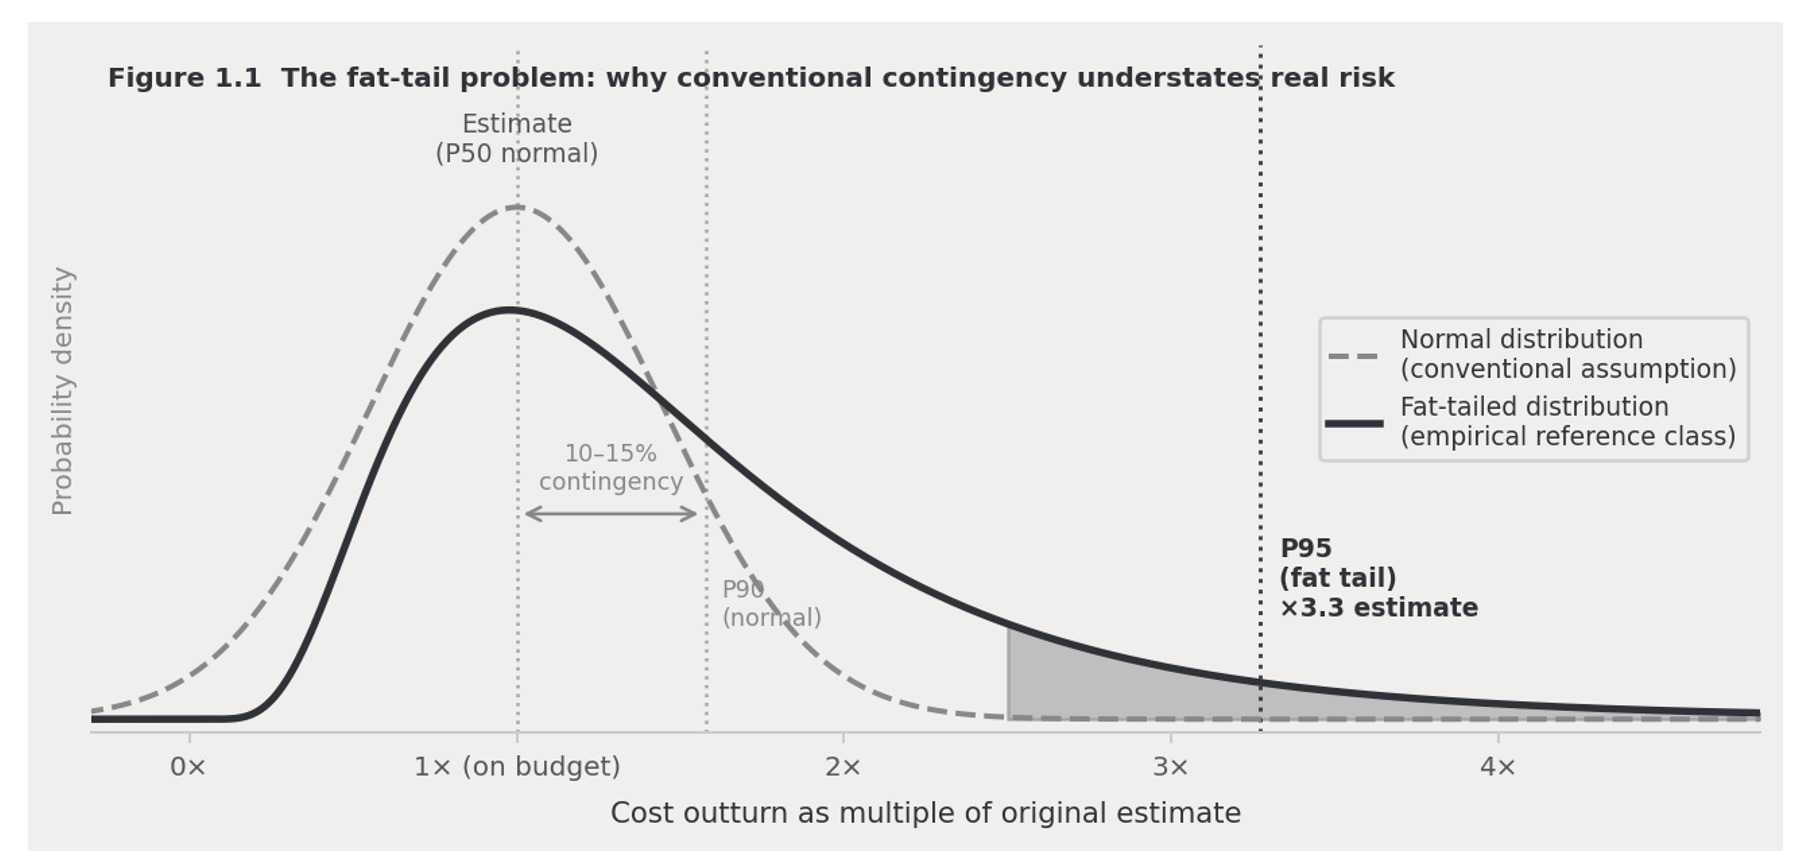
    Chart comparing the real-world pattern of rail megaproject cost overruns to a normal bell-curve distribution, showing a much higher chance of large overruns
    Figure 1.3. The real pattern of cost overruns on rail megaprojects (solid line) has a much bigger chance of large overruns than a normal bell curve (dashed line) would predict. A typical 10–15% contingency budget looks safe against a bell curve — but against the real-world pattern, it may only cover half of projects, or fewer. The shaded area shows the range of bad outcomes a standard contingency budget doesn’t account for.

    This matters directly for how much money a project should set aside for the unexpected. A standard 10–15% buffer looks adequate if you assume a bell curve — but against the real-world pattern, it may only protect against half of possible outcomes, or fewer. That’s why this report carries three cost figures all the way through its financial model — the number as originally specified, a corrected central estimate based on similar projects, and a worst-case scenario — instead of relying on one confident number that history suggests is likely to be wrong.

    1.6 · The Fix

    Checking the numbers against the real-world record

    The standard fix for both problems above is simple in principle: find a group of similar past projects; look at how their costs, benefits, and ridership actually turned out compared to what was promised; then use that real-world pattern to sanity-check the new project’s own estimate, rather than taking that estimate at face value. This flips the usual burden of proof — the real-world pattern becomes the starting assumption, and anyone predicting something better has to explain why.
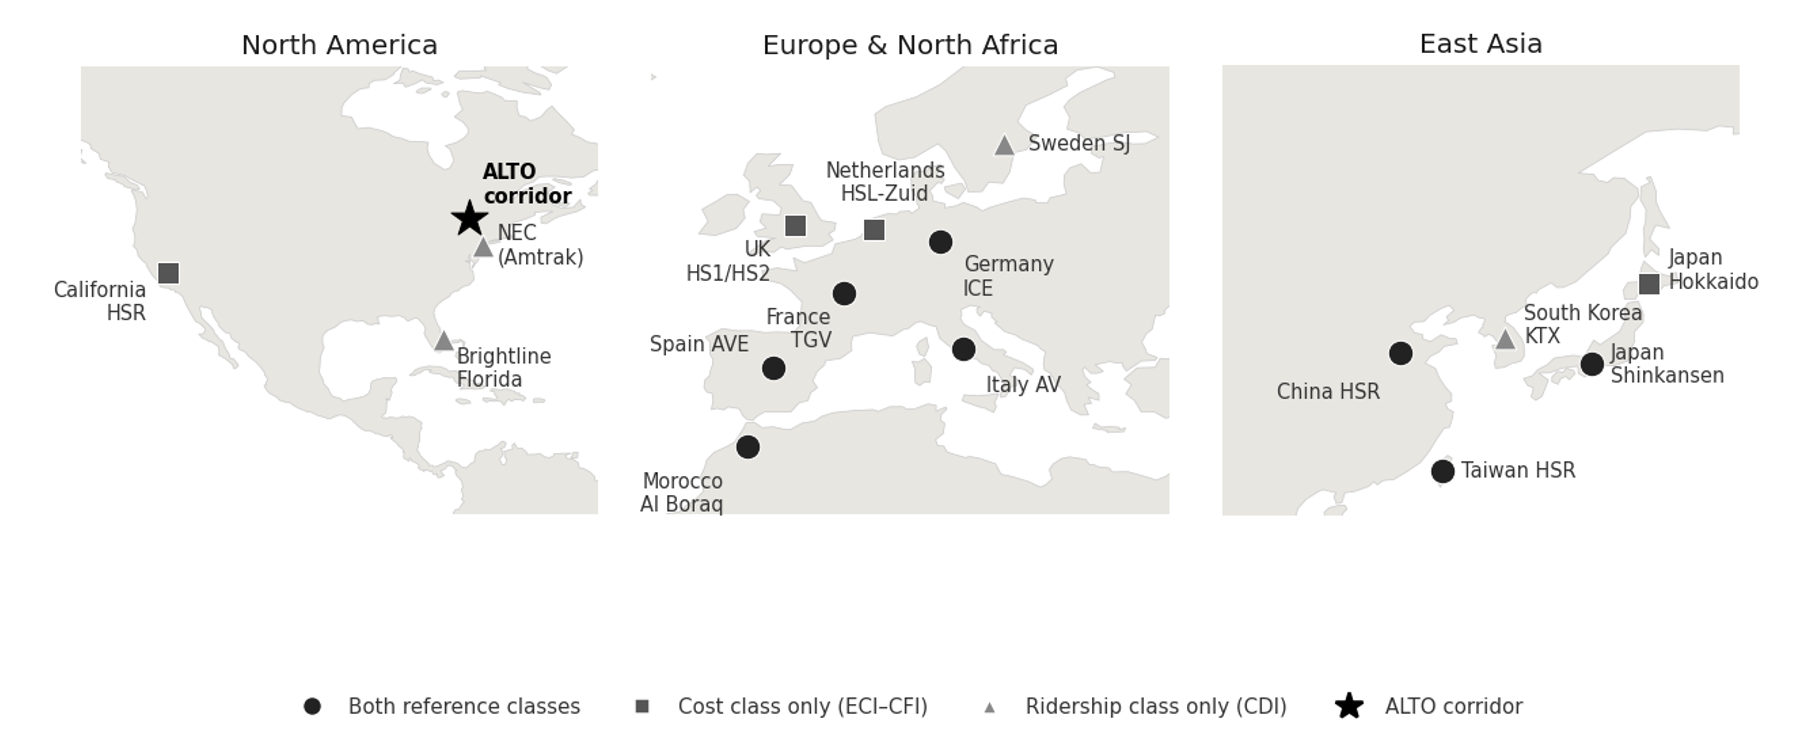
    World map showing the countries whose rail systems were used for comparison in this report's cost and ridership models, spanning Europe, East Asia, North Africa, and North America, with the ALTO corridor marked for reference
    Figure 1.4. Where the comparison projects are. They span Europe, East Asia, North Africa, and North America — different countries, different governments, different planning systems. That range matters: it shows the patterns we rely on aren’t specific to any one country’s way of doing things. ALTO’s corridor is shown for reference.

    What it costs

    We compared 16 real high-speed rail projects worldwideWe looked at what actually drove the final cost per kilometre on 16 comparable projects, and found two things matter most: how difficult the engineering is, and how much local resistance and land-use friction a project runs into.
    Local resistance matters more than engineering difficultyOf the two, local and political resistance turned out to be the bigger cost driver — roughly twice as important as raw engineering difficulty.
    What this means for ALTOBased on ALTO’s engineering difficulty and level of local resistance, this points to a realistic cost of around $142 million per kilometre, with a likely range of $76–264 million per kilometre.

    How many people would ride it

    We compared 12 real high-speed rail systems worldwideWe looked at how car-dependent a region is against how many people actually use rail there.
    No car-dependent region has high ridershipNot one of the 12 systems combines heavy car dependence with high rail ridership. ALTO’s corridor scores as heavily car-dependent.
    ALTO’s target vs. the realistic estimateALTO’s own target of 24 million riders a year by 2055 is far above what any comparable region has achieved. Three independent forecasts for this corridor instead cluster around 10 million riders a year.
    The standard this report holds itself to

    A forecast that looks better than the real-world pattern isn’t more accurate — it’s less accurate. This report’s numbers are, on purpose, less flattering than what a typical project pitch would produce for the same corridor. That’s the point: this report is built to hold up under tough scrutiny, which means accepting an honest, sometimes unwelcome, comparison to how these projects actually turn out.

    1.7 · Why Now

    Canada’s changed circumstances

    The case against ALTO isn’t only about method — it’s also about timing. ALTO was approved during a period of relative calm with the US, a stable trade agreement, extra federal money after the pandemic, low interest rates, and confident population-growth predictions that made ambitious ridership numbers easier to defend. Nearly all of those conditions have since changed. Today, Canada faces US tariff pressure, pressure to diversify trade away from the US, a tighter federal budget, and a public more focused on economic resilience than on amenity projects. A $100–200 billion passenger project has to clear a much higher bar today than it did when it was first approved.
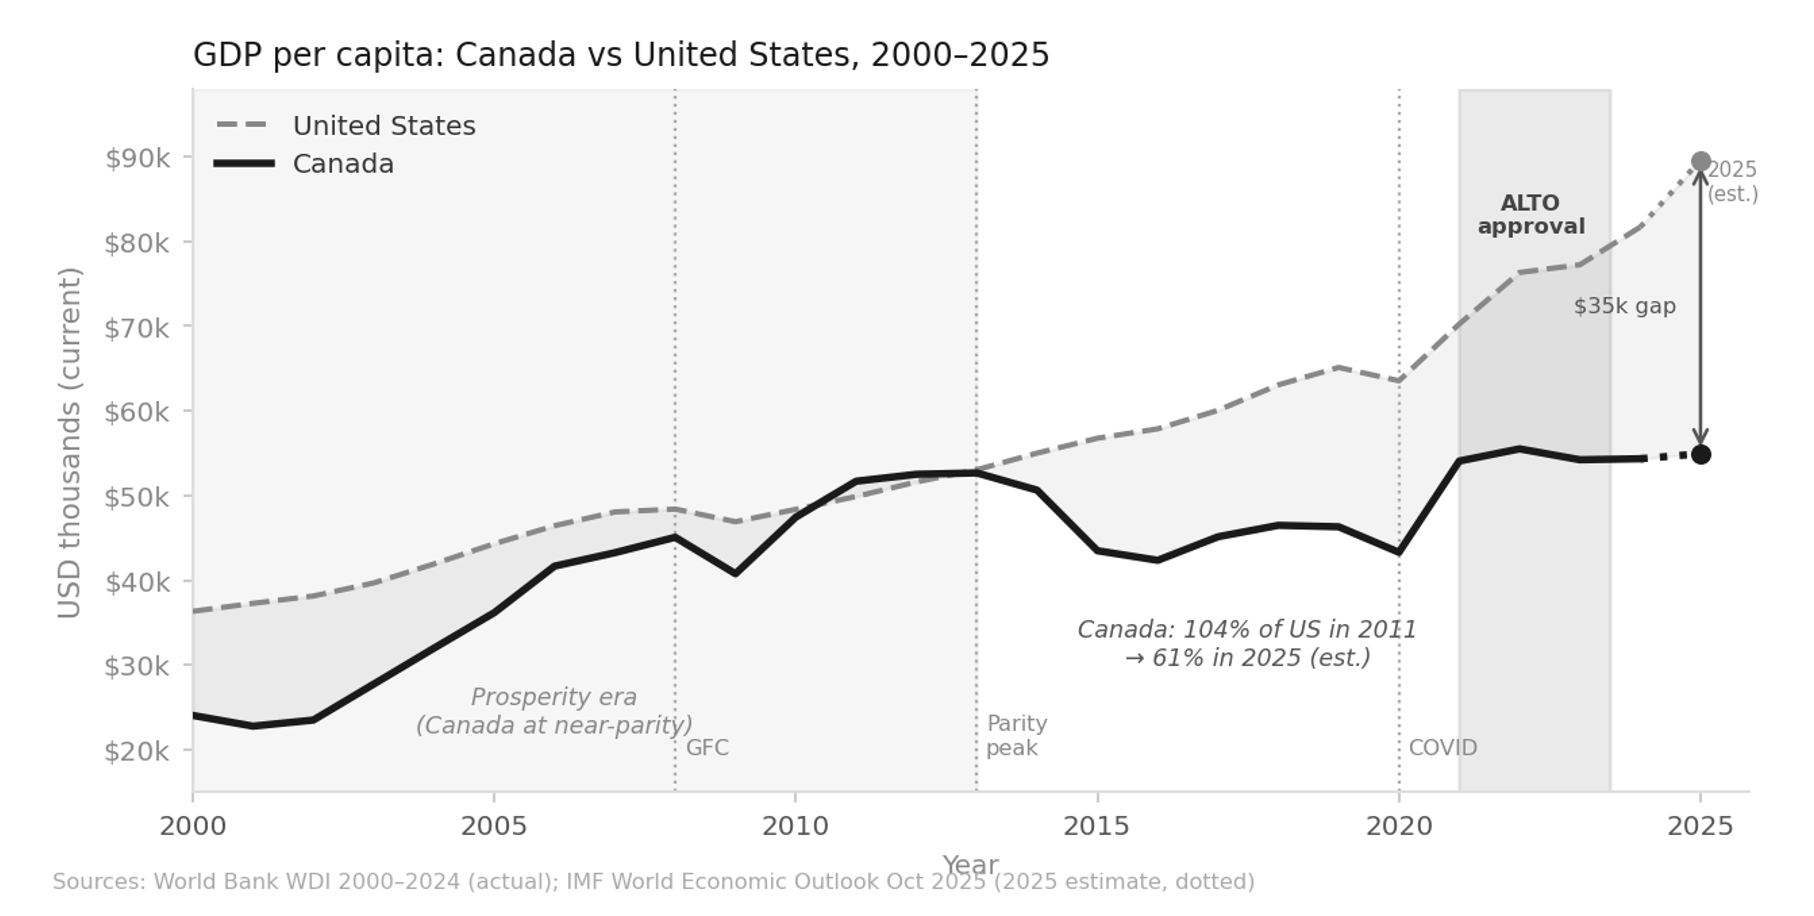
    Line chart of Canada and United States income per person from 2000 to 2025, showing Canada nearly matching the US during the 2011-2012 resource boom then falling to roughly 61 percent of US income per person by 2025
    Figure 1.5. Canada’s income per person compared to the US, 2000–2025. Canada came close to matching US income per person during the 2011–2012 resource boom, then fell steadily as oil prices dropped. By 2025, Canada’s income per person is roughly 61% of the US level — a gap of about $35,000. ALTO was approved near the peak of Canada’s post-pandemic economic rebound, in conditions that have since tightened considerably. Sources: World Bank World Development Indicators 2000–2024; IMF World Economic Outlook, October 2025.
    The question this raises

    ALTO is a project built for good economic times. The question for Canada in 2026 isn’t whether high-speed rail would be nice to have. It’s whether this corridor is worth the cost — and whether this design is the right answer to the problem.

    The high-speed rail systems that have actually succeeded — in Japan, France, Spain, Taiwan, South Korea — share things the Toronto–Ottawa–Montréal corridor doesn’t have: low car use, dense cities at both ends, strong local transit, and a rail culture that already existed before high-speed rail arrived. What’s left, globally, are second-tier projects on car-dependent corridors where the ridership case relies on optimistic in-house projections rather than real-world evidence. California’s high-speed rail project is the best-known example: years behind schedule, billions over budget, and in political trouble, for exactly these reasons. ALTO fits that second tier.

    What’s Next

    What’s in the rest of this report

    This chapter sets out the method. The chapters that follow apply it — to ALTO, and to the alternative this report proposes, HPR (High-Performance Rail).

    Ch. 2
    Why the current plan doesn’t add up. Checks the case for doing something about intercity travel on this corridor — which we don’t dispute — against whether ALTO’s specific design actually makes financial sense.
    Ch. 3
    The HPR alternative. How a passenger line built along the existing Highway 401 and rail corridor can free up freight capacity at the same time, instead of building an entirely new line elsewhere and leaving the freight problem untouched.
    Ch. 4
    Route and cost. Where the line would go and what it would cost, using the same cost model applied consistently to both ALTO and HPR.
    Ch. 5
    Environment and communities. How the two options compare on carbon emissions and disruption to the communities along the route.
    Ch. 6
    How many people would ride it. Ridership estimates built on the real-world pattern from this chapter, checked four different ways.
    Ch. 7
    Running costs. The ongoing yearly balance between what it costs to operate and maintain the railway, and what fares plus any subsidy bring in.
    Ch. 8
    Is it worth it. A full cost-benefit and financial analysis across a range of scenarios, including the value of the freed-up freight capacity.
    Ch. 9
    Getting it built. How to phase construction, manage the risk of cost overruns, and keep the project accountable to the numbers in this report.
  • The Anatomy of an Optimistic Forecast

    The Anatomy of an Optimistic Forecast — ALTO HSR Citizen Research Initiative

    The Anatomy of an Optimistic Forecast

    Behavioural bias in the ALTO project — a diagnostic reading of the Flyvbjerg framework.

    ● In Plain Language

    Arguments about ALTO tend to happen one number at a time: the project publishes a cost or a ridership figure, critics dispute it, and the debate moves on to the next number. This paper argues that this is the wrong argument to be having.

    Three decades of research by the Oxford scholar Bent Flyvbjerg, drawn from the largest database of major projects ever assembled, shows that the forecasts for big infrastructure projects are not wrong at random. They are wrong in the same direction almost every time: costs come in far higher than promised, and benefits such as ridership come in far lower. On average, rail projects cost about 1.4 times their estimate and carry about two-thirds of the riders forecast.

    That consistency is the clue. An honest mistake would scatter — sometimes too high, sometimes too low. Error that reliably points one way — the way that helps a project win funding — is the signature of something other than honest error.

    The paper is careful about what this does and does not show. It does not accuse anyone of lying. It says plainly that intent cannot be read from the outside, and that a non-partisan initiative should not pretend otherwise. What it asks is simpler: rather than trusting the project’s own bottom-up numbers, check them against what actually happened to comparable projects elsewhere. That check — taking the “outside view” — is the standard corrective the research recommends.

    Both halves of that pattern are already visible in ALTO’s own conduct. In June 2026 the project released two studies attaching large dollar figures to the line’s benefits — one putting the economic gain at around $24 billion a year, the other adding up to roughly $4 billion a year from tourism. Neither weighs those benefits against what the line would cost to build and run. They are the benefit half of the pattern above, arriving on schedule: impressive numbers with the price tag left off the page.

    At the same time, ALTO has — to its credit — done the very thing this paper recommends: it commissioned the outside check. That contract was awarded, without competition, to Oxford Global Projects, the firm founded by Bent Flyvbjerg, to measure the project against the record of thousands of comparable projects worldwide. The question that decides everything is whether ALTO’s published figures were changed to match what that check found, or whether the check was commissioned and then set aside. The single document that would answer it has been requested; ALTO has delayed releasing it until at least September 2026. Until it appears, we cannot know whether the project’s own outside check confirmed its numbers or contradicted them. The simplest way to settle that is for ALTO to publish the comparison in full, for everyone to see — the inside figures and the outside-view figures side by side, unredacted. The outside view was always meant to be seen, not filed away.

    Two things make this urgent for ALTO. It is exactly the kind of project — large, politically sponsored, competing for scarce public money — where the pressure to make the numbers look approvable is highest. And the window to apply the test is closing: once enough money is committed, a project becomes very hard to stop, whatever the evidence later shows. The paper’s single recommendation is to test ALTO’s numbers against the record of similar projects before that point of no return. What should be built instead is left to other work.

    Abstract

    Public debate about ALTO has so far been conducted largely in the currency of individual numbers — a cost estimate here, a ridership projection there — contested one at a time. This paper argues that the more revealing question is not whether any single figure is wrong, but whether ALTO’s figures are wrong in a patterned way, and what that pattern signifies.

    Drawing on Bent Flyvbjerg’s behavioural account of megaproject planning, it treats ALTO’s forecasts as a case to be diagnosed rather than merely audited. The central instrument is Flyvbjerg’s distinction between cognitive bias (innocent optimism) and political bias (deliberate strategic misrepresentation), together with his demonstration that the two are separable by the direction and consistency of forecasting error rather than by any claim about the inner states of forecasters. On that test, the paper sets out why ALTO’s profile places it where the theory predicts strategic distortion will dominate, and why the appropriate response is not the imputation of motive but the substitution of an outside view for the proponent’s inside one. The analysis is diagnostic only; the design of an alternative framework is reserved for other Initiative work.

    Download
    The Anatomy of an Optimistic Forecast — Full Working Paper (PDF)
    The complete diagnostic reading of the Flyvbjerg framework as applied to ALTO, with full citations
    Download PDF
    1 · The Frame

    The wrong argument to be having

    With the public consultation now closed, the contest over ALTO has settled into a familiar shape: the proponent advances a figure, critics advance a rival figure, and the exchange proceeds number by number. This is an argument the proponent is structurally well placed to win, because it concedes the most important point before the first number is spoken — the premise that each estimate is an independent technical product to be checked on its own terms.

    Bent Flyvbjerg’s body of work, accumulated over three decades and the largest project database of its kind, exists to deny exactly that premise. His finding is that the estimates are neither independent nor merely technical: across project types, eras, and continents, they err in the same direction, by large margins, with no improvement over time.

    That regularity changes the nature of the inquiry. If forecasting error were technical noise, it would be scattered — sometimes high, sometimes low — and the right response would be a better model. Because it is instead systematic and directional, the right response is to ask what produces a bias rather than an error. This paper pursues that question for ALTO. It asks what kind of distortion is in play, how an observer could tell one kind from another without reading minds, and what follows for how the project should be appraised. It is a diagnosis, not a verdict on any person, and it stops short of proposing what should be built instead.

    2 · The Distinction

    Two theories of a bad forecast

    Flyvbjerg’s decisive move is to refuse the assumption, common in behavioural economics, that all behavioural distortion reduces to cognition. Cognitive bias, he argues, is only half the story; political bias is the other half. The two halves correspond to two competing explanations of the same observed outcome — costs that come in high and benefits that come in low.

    Optimism bias — the cognitive accountStrategic misrepresentation — the political account
    What it is. A genuine cognitive failing, non-deliberate, in whose grip planners are unaware they are being optimistic. What it is. The deliberate distortion of information to secure a desired end — which, by the definitions Flyvbjerg borrows from the philosophical literature on deception, is plainly lying.
    The kind of defect. A defect of method. The kind of defect. A defect of incentive.
    The cure. Better technique — forcing distributional, outside-view information into the estimate. The cure. Changing what forecasters are rewarded and held accountable for.
    When it dominates. Where stakes and pressure are low — small projects with little top-management attention. When it dominates. Where a minister or chief executive must have a particular project. Optimism remains present, reinforcing rather than absent.

    The distinction is not academic. The two diagnoses share a symptom and an outcome but differ in everything that matters for response. Confuse the two and the prescribed remedy will miss. Flyvbjerg’s now-settled position, reached through a long exchange with Daniel Kahneman, is that real decisions involve both, with the mix shifting along a scale of political-organisational pressure.

    The mechanism he names is brutally simple, and worth stating in its bare form because it is the engine of everything that follows: underestimated costs plus overestimated benefits equals funding. A low cost estimate is more easily approved, and so produces overrun; a high benefit estimate is more easily approved, and so produces shortfall. The bias is therefore not random but functional — it points in the direction that wins the competition for scarce capital. Flyvbjerg has called the resulting practice design by deception, and it is the practice, not the individual, that the framework indicts.

    3 · The Placement

    Where ALTO sits on the scale

    If the balance between innocent optimism and deliberate misrepresentation depends on the degree of political-organisational pressure, then locating a project on that scale is the first analytical task. Flyvbjerg’s Proposition 1 holds that for small projects with low strategic import and little top-management attention, bias, if present, originates mainly in cognition. His Proposition 2 holds that for large projects with high strategic import and ample top-management attention, bias originates mainly in politics — in strategic misrepresentation — though cognitive bias remains present.

    ALTO sits at the upper extreme of every variable in that proposition. It is delivered through a Crown corporation carrying a multi-billion-dollar mandate; it enjoys explicit ministerial sponsorship; and it competes with every other federal priority for a finite pool of capital. By the framework’s own logic, this is precisely the configuration in which strategic misrepresentation should be expected to be the dominant bias, with optimism layered on top.

    This conclusion is worth stating carefully: it is not yet a finding that ALTO’s numbers are distorted. It is a prediction, derived from the project’s structural profile, about where to look and what kind of distortion to expect if distortion is present. The remaining sections test that prediction against the evidence the framework makes available.

    4 · The Unit of Analysis

    Uniqueness, the inside view, and the reference-class problem

    The deepest thread runs through three of Flyvbjerg’s biases that are really one problem under three names: uniqueness bias, the inside view, and base-rate neglect. A jurisdiction that has never built high-speed rail treats the undertaking as unique; uniqueness licenses the “inside view,” in which the estimate is built bottom-up from the specifics of this project; and the inside view licenses ignoring the base rate of comparable projects elsewhere. The promotional framing of ALTO — the first true high-speed rail in Canada, a singular corridor, distinctive Shield geology — is structurally identical to that pattern.

    What the appeal to uniqueness accomplishes is epistemological, and it is the crux of the whole dispute. To call a project unique is to set the size of its reference class to one, and a reference class of one renders the proponent’s bottom-up estimate the only admissible evidence. This is, at bottom, the reference-class problem from the philosophy of probability: any individual case belongs to indefinitely many classes, and the probability one assigns depends entirely on which class is chosen. The proponent wants the operative class to be “this project.” The Initiative’s instruments are, in this light, a single sustained argument that ALTO is a member of the class “high-speed and intercity rail megaprojects,” for which abundant outcome data exist. The disagreement is not, at root, about any one number. It is about the unit of analysis.

    That reframing matters because the outside view carries decisive quantitative content. On the largest dataset of its kind:

    1.40×
    what rail projects cost, on average, relative to estimate
    Flyvbjerg & Bester 2021
    ~⅔
    the share of forecast benefits that rail projects actually deliver (about 0.66)
    Flyvbjerg 2021, Table 2
    ~0.47×
    of the promised benefit–cost ratio that survives the generic rail correction — before any ALTO-specific factor
    0.66 ÷ 1.40

    Demand forecasts are worse still: for nine of ten rail projects passenger forecasts are overestimated, by an average of roughly 106 per cent, and for the high-speed subclass specifically the average cost escalation is higher than for rail as a whole. A single illustrative operation follows. Apply the generic rail correction to any proponent’s own benefit-cost ratio — multiply by roughly 0.66 divided by 1.40 — and the realised ratio falls to about 0.47 of what was promised, before a single ALTO-specific complication is added. Where the Initiative’s appraisal already places ALTO’s social benefit-cost ratio far below break-even on its own terms, the outside-view correction compounds on top of it. The philosophical point is that this correction imputes no motive whatsoever. It is simply what the base rate is.

    A live datum from the reference class · HS2, June 2026

    The abstraction acquires a face in Britain’s High Speed Two, the nearest contemporary member of the class. A National Audit Office report published on 29 June 2026 records that the cost of the London–Birmingham programme has roughly doubled since 2020 — an increase of some £36 billion excluding inflation — and that the full railway is now expected between three and thirteen years later than first planned. Most telling for the present argument is the fate of the project’s benefit–cost ratio. At the 2020 decision to proceed it stood at 1.2, or “low value for money.” Recomputed with the costs now known — had those costs been visible in 2020 — the auditor puts it at 0.3 to 0.4: “poor value for money.”

    The operation is not identical to the reference-class correction above; it substitutes the realised cost while holding benefits roughly fixed, rather than adjusting the two together. But its direction and magnitude corroborate the same claim, and do so from an independent auditor’s evidence rather than a critic’s model: the approval-stage ratio was an artefact of underestimation, and on realised costs the case for the project fell below viability from the outset.

    A qualification sharpens rather than softens the point. The proponent’s own benefit case does reach for the outside view — but only for the half of the ledger that flatters it. The two studies ALTO released in June 2026 build their benefit magnitudes almost entirely from the international high-speed-rail literature, the same European and Chinese reference class the Initiative invokes. What they import from that class is the size of the upside; what they decline to import is its base rate for realisation — that rail benefits arrive at about two-thirds of forecast and passenger numbers are overstated by roughly a hundred per cent. The class is admitted where it raises the estimate and excused where it would discipline it: base-rate neglect not as an oversight but as a selection rule.

    5 · The Evidence

    The evidential signature: deception versus error

    Here the analysis must be most disciplined, because here it is most tempting to overreach. Intent cannot be observed, and a non-partisan research initiative should not pretend otherwise. The framework, read carefully, does not ask it to. What it supplies instead is a distributional signature.

    Genuine technical error would scatter symmetrically around zero — a roughly normal distribution of overshoots and undershoots, centred near accuracy. What the data actually show is error that is consistently directional: costs under, benefits over, stable across decades and continents, with no improvement as techniques supposedly advance. That asymmetry is the tell. Innocent error is not supposed to know which way to point. When error reliably points in the funding-favourable direction across an entire population of projects, the hypothesis that cognition alone is responsible is the hypothesis that gets falsified.

    This is also how Flyvbjerg reads the verdict of Martin Wachs, who after decades studying transportation forecasting concluded that the persistent gaps between forecast and outcome amount not to a technical failing but to a collective failure of professional ethics. For ALTO, the methodologically honest claim is therefore not “the proponent is lying,” which cannot be established and which would forfeit the Initiative’s standing, but something more precise and more durable: that ALTO’s estimates exhibit the canonical directional signature — every adjustable assumption resolved in the direction that favours viability — and that this signature is, on the largest body of evidence in the field, the fingerprint of strategic distortion rather than honest error. The structure of the error carries the inference; the reader is left to draw the conclusion about agency. That is both the more rigorous posture and the more defensible one.

    A live datum from the proponent’s side · ALTO’s benefit case, June 2026

    If High Speed Two shows the cost half of the mechanism coming true after the fact, two studies ALTO released the same month — June 2026, two months after the consultation had closed — show the benefit half being assembled before it. A computable-general-equilibrium assessment of structural economic impacts reports a national real-GDP gain of about $24.4 billion a year; a corridor tourism study adds up to $3.9 billion in GDP and 43,000 jobs. Neither nets a cost. The macro study excludes construction and operating expenditure by design; the tourism study has no cost side to exclude. What both offer is a benefit total unaccompanied by the outlay required to obtain it.

    Their internal architecture is the directional signature in miniature. Each is built as a fan of scenarios — pessimistic to optimistic, low to high coordination — and in each the entire fan sits above zero. Every table of the macro study prints the same line, that welfare increases in every scenario; the tourism study’s weakest case is still $177 million and two thousand jobs. The scenario space has a floor at the baseline and no downside tail: the modelled question is only ever how large the gain is, never whether there is a loss. Even the reports’ own adverse mechanisms are kept from reaching the total — the tourism study concedes that faster trains shorten stays and turn overnight visits into day trips, and shows length of stay going negative in several cities, yet the aggregate is arranged to rise regardless.

    The sharpest tell is where the two documents contradict each other. The macro study omits domestic tourism on the ground that it is largely substitution from other household spending, with little net effect on national output; the tourism study builds most of its $33.7-billion base, and most of its headline uplift, from precisely that in-corridor domestic travel, counted through gross input–output multipliers that assume no such displacement. Where the promoter’s two reports disagree, each resolves the disagreement toward its own larger number. Both, to their credit, label their outputs illustrative, order-of-magnitude, and not forecasts, and make the largest figures conditional on tourism policy the railway itself does not deliver — but the numbers that leave the page are round and unconditional. The caveats stay in the prose; the figures travel. As with HS2, no claim about anyone’s honesty is required: it is enough that every adjustable assumption has resolved in the direction that favours the project.

    6 · The Selection Effect

    Survival of the unfittest

    The most consequential idea in the framework, for understanding how a project like ALTO comes to exist at all, is Flyvbjerg’s inverted Darwinism. It is not the best projects that get built, he argues, but the projects that look best on paper — and the projects that look best on paper are precisely those with the largest cost underestimates and benefit overestimates, which makes them, in reality, among the worst. The approval process thus operates as an adverse-selection mechanism, a Gresham’s law for infrastructure in which optimistic estimates drive out honest ones, because the candid project that books realistic costs and realistic ridership loses the funding contest to the one that does not.

    This reframes the central question. The issue is not merely whether ALTO is a sound project that may encounter difficulties. It is what it signifies that this project, rather than a more modest alternative, is the one that cleared the hurdles. On the selection logic, a project may clear those hurdles partly because it presented numbers a more candid competitor could not match and still survive. The very fact of approval, in an environment that rewards optimism, is therefore itself a piece of evidence — not proof of bad faith, but a structural reason to distrust the survivor’s own paperwork.

    7 · The Consultation

    Power, convexity, and the exclusion of the outside view

    Flyvbjerg’s claim that power amplifies cognitive bias — that powerful decision-makers are, in his phrase, convexity generators, more swayed by what comes readily to mind and more optimistic about risk — connects this framework to his earlier study of rationality and power. The mechanism that should most interest an observer of ALTO is institutional rather than psychological: he documents that those in power tend to exclude experts and deliberative scrutiny when the stakes are highest, precisely because deliberation threatens to disturb a decision already taken.

    A public consultation is, in principle, the institutional site at which the outside view ought to enter — the moment when base rates, comparator projects, and independent reference-class evidence acquire standing against the proponent’s inside view. The outside view is, after all, the established corrective: quality control by way of comparison with completed projects. The question a consultation poses, then, is whether it is genuinely structured to admit that evidence, or whether it functions to ratify a conclusion reached in advance. The Initiative’s critique of the consultation’s adequacy can be restated in exactly these terms: it is the claim that the outside view is being structurally excluded — which is what the theory predicts will happen at the high-pressure end of the scale, where ALTO sits. Exclusion, it should be said, is not always outright refusal; as the next section shows, the outside view can also be admitted so late that it can no longer change the answer, which is exclusion by another clock.

    One objection presents itself immediately, and it is worth meeting head-on. It might be said that ALTO did not exclude the outside view at all — that it went out and bought it. In 2024 the proponent issued an advance contract award notice, PAS240625-002-00, for reference-class forecasting, should-cost and should-schedule modelling, and a series of Challenge Boards, and named a single pre-identified supplier on the ground that only one firm was capable of the work. That firm is Oxford Global Projects, the consultancy founded by Bent Flyvbjerg and Alexander Budzier — the commercial vehicle of the very framework this paper applies, retained to take the outside view on ALTO’s own numbers. On its face this cuts against any claim of exclusion: the proponent engaged the outside view’s own author’s firm.

    But procuring the instrument is not the same as letting it bind, and that distinction is the whole of the matter. Reference-class forecasting debiases only when its outside-view figure is permitted to move the decision; a should-cost that is commissioned, filed, and left beside an unchanged inside-view estimate is not a corrective but a credential. The framework is explicit that the failure mode is not the absence of the outside view but its subordination — the number produced and then declined. The decisive record, accordingly, is not the existence of the forecast but the comparison: does ALTO’s published capital cost and benefit-cost ratio reflect its own reference-class should-cost, or diverge from it? That single document — the inside view and the outside view set side by side — would settle more than any figure the Initiative could model, because it would be the proponent’s own instrument speaking. This yields a falsifiable prediction rather than an accusation: if the commissioned reference-class numbers are more conservative than the figures ALTO has advanced in public, the outside view was procured and parked; if they match, the cost critique weakens accordingly. The test is available, and it is coming due.

    8 · The Timing

    Escalation, lock-in, and the manufactured point of no return

    Escalation of commitment enters this analysis chiefly as a prospective warning rather than a present diagnosis. Flyvbjerg ties it to preferential attachment: the projects that look best on paper attract the initial funding; initial funding creates lock-in; and once a point of no return is passed, further funds flow to close the gap between the original underestimate and the real cost — good money thrown after bad. Early disbursement is not incidental to this process. It is frequently the instrument by which the point of no return is engineered, so that cancellation comes to entail an irretrievable loss of money and of face.

    Read in this frame, the contract-commitment data emerging through the Initiative’s access-to-information work is significant less as a record of spending than as a measure of how far the lock-in mechanism has already advanced. The more that is committed before the numbers are independently tested, the harder it becomes for any future government to halt the project, whatever the evidence then shows. The implication is about timing, not motive: the window in which an outside view can still alter the decision is open now and closing — which is the strongest available argument for the urgency of independent appraisal before commitment hardens into inevitability.

    The same access-to-information channel now supplies a timing datum of its own. The Initiative’s request for the reference-class records described above — the workbook, the should-cost and should-schedule outputs, and above all any document setting the inside view beside the outside view — was met in June 2026 with a ninety-day extension carrying the response to 18 September 2026, and with a notice invoking third-party consultation under section 27. That combination foreshadows a commercial-confidence claim over precisely the should-cost and should-schedule figures that would make the comparison legible. The mechanism is the one this section describes, observed in real time: the record capable of disciplining the decision is scheduled to arrive, if at all, in redacted form and only after further commitment has hardened. Whether it plays out that way is, again, a matter the disclosure itself will settle — but the sequence is the point, and the sequence is the framework’s.

    High Speed Two shows the lock-in mechanism operating in plain sight, and in a form more counter-intuitive than the theory usually advertises. By 2026, with some £47 billion already spent, the National Audit Office found that the benefit–cost ratio for completing the programme had risen to a range of 1.5 to 6.4 even as the programme grew more expensive — because the estimated cost of cancelling it had more than quadrupled, to a figure comparable with the cost of finishing, and that avoided cost is subtracted from the remaining bill. This is escalation of commitment rendered as arithmetic: once enough is sunk, the books can show that continuing is “value for money” precisely because so much would be forfeit by stopping. The decision to proceed, the auditor records, rested on advice that the ratio merely exceeded 1.5 rather than on the full range. It is worth adding that the independent scrutiny the programme now receives — mega-project assurance panels, a central decision panel — was largely imported after that lock-in rather than before it. The outside view was not so much refused as deferred until it could no longer change the answer. For ALTO the lesson is about sequence: the cheapest moment to apply the test is now, before the commitment that will later make the same test read the other way.

    9 · The Alibi

    Bias as root cause, complexity as alibi

    The framework’s most important claim is that bias is the root cause of overrun, while scope changes, geology, weather, and complexity are merely proximate causes — the visible forms through which the underlying underestimation manifests. Behavioural science, in Flyvbjerg’s summary, tells the planner: your biggest risk is you. The Shield was always there to be reckoned with; the expropriation friction and the input-cost inflation were always foreseeable as a class. What is typically missing is not information about them but an honest reckoning with them at the planning stage.

    This pre-empts the alibi ALTO can be expected to offer when overruns arrive — that they were caused by unforeseeable geological, legal, or market conditions. On the framework’s account these are not exogenous shocks but the predicted shape of upstream underestimation: the causal chain runs from bias, to underestimation of scope during planning, to unaccounted-for scope changes during delivery, to overrun. This is also why two of the Initiative’s instruments are the most Flyvbjergian in its arsenal. An engineering-complexity scorecard and a community-friction index are attempts to quantify, in advance, the magnitude of precisely what the inside view suppresses — to put a number on the complexity and social resistance that will later be offered as an excuse, while that number can still discipline the decision. That is the de-biasing operation the framework prescribes.

    High Speed Two supplies an unusually candid illustration of the root-versus-proximate distinction — from the proponent’s own hand. Asked to account for the doubling of costs, the programme’s delivery body attributed the increase not principally to external shocks but to its own estimates: roughly a third to underestimation, a further quarter to inefficient delivery, and a further tenth to scope change, with inflation making up the balance. Its working definition of scope change is the decisive tell — “the addition of necessary works that were missed from the original scope.” That is not an exogenous event befalling the plan; it is the plan’s original incompleteness surfacing during delivery, which is exactly the causal order the framework asserts. When even the builder’s own decomposition places underestimation ahead of every other single non-inflationary factor, the alibi of unforeseeable complexity is hard to sustain.

    10 · The Discipline

    A caution, in the service of rigour

    One critical qualification protects the credibility of the entire exercise. The vocabulary of bias has a self-sealing tendency that the framework only half-acknowledges. Symmetric error can be relabelled noise; directional error, bias or lying; almost any outcome can be folded back into the scheme after the fact. Gerd Gigerenzer has pressed this point as a “bias bias,” and even sympathetic practitioners concede it is often impossible to identify which specific bias is operating or to exclude alternative explanations. Wielded loosely, the bias lexicon becomes unfalsifiable and reads as motive-imputation dressed up as analysis — which is the fastest route by which a non-partisan initiative is recast as a partisan one.

    ⚠ What keeps the analysis honest

    Rest the weight on the parts that are empirical and falsifiable — the reference-class comparison, the directional signature, the base-rate correction — and treat the attribution of deliberate deception as an inference the reader is invited to draw from structure, never as a claim asserted about named persons. That line is not merely ethical caution. It is, conveniently, the same line that separates an argument which survives hostile scrutiny from one that does not.

    11 · The Diagnosis

    Conclusion

    Read through Flyvbjerg, the scattered disputes over ALTO’s individual figures resolve into a single diagnosis.

    The structural profile

    ALTO’s profile — a Crown corporation, ministerial sponsorship, competition for scarce capital — places it where strategic distortion is predicted to dominate, with optimism layered on top.

    The directional signature

    Its forecasts display the one-directional error — costs under, benefits over — that distinguishes such distortion from innocent error, stable across decades and continents.

    Survival is a signal

    Its survival of the approval process is itself a mark of selection pressure that rewards optimism rather than a warrant of soundness.

    Complexity is not an alibi

    The geological and social difficulties it will later cite are the anticipated form of an underestimation already present in the plan — not exogenous shocks.

    None of this requires, or asserts, a claim about anyone’s honesty.

    What follows

    A relocation of the burden of proof

    What the framework asserts is a relocation of the burden of proof. The proponent’s inside-view estimates carry a known, measurable, directional bias; the outside view is the established corrective; and the appropriate demand is therefore that the decision be tested against the base rate before lock-in forecloses the test. That demand is the whole of this paper’s recommendation. What ought to be built instead, and on what evidence, is a separate question, reserved for other work of the Initiative.

    Works Cited

    Sources

    1.
    Flyvbjerg, Bent. “What You Should Know about Megaprojects and Why: An Overview.” Project Management Journal 45, no. 2 (2014): 6–19.
    2.
    Flyvbjerg, Bent. “Top-Ten Behavioral Biases in Project Management: An Overview.” Project Management Journal 52, no. 6 (2021): 531–546.
    3.
    Flyvbjerg, Bent, Mette K. Skamris Holm, and Søren L. Buhl. “Underestimating Costs in Public Works Projects: Error or Lie?” Journal of the American Planning Association 68, no. 3 (2002): 279–295.
    4.
    Flyvbjerg, Bent. “Design by Deception: The Politics of Megaproject Approval.” Harvard Design Magazine, no. 22 (2005): 50–59.
    5.
    Flyvbjerg, Bent, Mette K. Skamris Holm, and Søren L. Buhl. “How (In)accurate Are Demand Forecasts in Public Works Projects? The Case of Transportation.” Journal of the American Planning Association 71, no. 2 (2005): 131–146.
    6.
    Flyvbjerg, Bent, Nils Bruzelius, and Werner Rothengatter. Megaprojects and Risk: An Anatomy of Ambition. Cambridge: Cambridge University Press, 2003.
    7.
    Flyvbjerg, Bent, and Dirk W. Bester. “The Cost-Benefit Fallacy: Why Cost-Benefit Analysis Is Broken and How to Fix It.” Journal of Benefit-Cost Analysis 12, no. 3 (2021): 395–419.
    8.
    Flyvbjerg, Bent. “Survival of the Unfittest: Why the Worst Infrastructure Gets Built — and What We Can Do about It.” Oxford Review of Economic Policy 25, no. 3 (2009): 344–367.
    9.
    Flyvbjerg, Bent. Rationality and Power: Democracy in Practice. Chicago: University of Chicago Press, 1998.
    10.
    Flyvbjerg, Bent. “Quality Control and Due Diligence in Project Management: Getting Decisions Right by Taking the Outside View.” International Journal of Project Management 31, no. 5 (2013): 760–774.
    11.
    Flyvbjerg, Bent. “From Nobel Prize to Project Management: Getting Risks Right.” Project Management Journal 37, no. 3 (2006): 5–15.
    12.
    Kahneman, Daniel. Thinking, Fast and Slow. New York: Farrar, Straus and Giroux, 2011.
    13.
    Wachs, Martin. “The Past, Present, and Future of Professional Ethics in Planning.” In Policy, Planning, and People, edited by Naomi Carmon and Susan S. Fainstein, 101–119. Philadelphia: University of Pennsylvania Press, 2013.
    14.
    Gigerenzer, Gerd. “The Bias Bias in Behavioral Economics.” Review of Behavioral Economics 5 (2018): 303–336.
    15.
    National Audit Office. High Speed Two reset. Report by the Comptroller and Auditor General, Session 2026-27, HC 52. London: National Audit Office, June 2026.
    16.
    Aviseo Consulting. An Overview of the Structural Economic Impacts of Alto: Computable General Equilibrium Modelling Approach to Assessing High-Speed Rail in the Toronto–Québec City Corridor. Prepared for Alto. June 2026.
    17.
    CPCS, in association with HDR. Tourism in the Alto Corridor: Current Conditions and Potential Impacts. Prepared for Alto. June 2026.
    18.
    Alto (VIA HFR – VIA TGF Inc.). Advance Contract Award Notice PAS240625-002-00 (project management and control expertise; pre-identified supplier Oxford Global Projects UK Limited). 2024.
    19.
    Alto (VIA HFR – VIA TGF Inc.). Notice of extension, Access to Information request A-2026-0004. June 2026. On file with the Initiative.