Three Claims, One Fare
ALTO makes three promises about the high-speed railway. All three depend on one number it has never published — the price of a ticket.
ALTO promises three things at once: that 24 million people a year will ride the new railway; that they will save 9.3 billion hours of travel time, worth $49.5 billion; and that ticket sales will cover the cost of running and maintaining the line. Each promise sits in a different part of the report, backed by different evidence.
All three depend on one number the report never gives: the price of a ticket. Cheap tickets fill trains, which is what the first two promises need. Expensive tickets bring in the revenue the third promise needs. A fare cannot be cheap and expensive at the same time, so the three promises pull against one another.
Work out the single fare at which all three could hold, and it comes to about 19 cents per kilometre travelled — roughly $83 for a typical 428-kilometre journey. At that price the railway breaks even only if 24 million people ride it, and 24 million people ride it only if the corridor is generating about 74 million intercity trips a year, by all modes. On ALTO’s own population figures, the corridor will generate about 34 million.
So making all three promises at once means making a fourth one that is never stated: that by 2055 the corridor would have to be generating more than twice the intercity travel that ALTO’s own population figures produce. Nobody forecasts travel on that scale, and that is exactly the difficulty.
Fares here are given per kilometre travelled, because that is how railway revenue is calculated. A passenger-kilometre is simply one traveller going one kilometre, so a fare of $0.15 per kilometre means a passenger pays 15 cents for every kilometre of their journey. Multiply by 428 km — the average journey — for a rough ticket price: $0.15 is about $64, $0.22 about $94, $0.28 about $120, and the $0.193 break-even fare about $83.
Modal Shift Notes and O&M Notes, referred to throughout, are earlier papers in this series and are available at citizenresearch.ca.
Three claims that are only ever made separately
Where this comes from. ALTO is the company proposing the high-speed railway. In August 2026 it published a report, Canada’s Moment: The Economic Opportunity of High-Speed Rail, making the three claims set out below. This page is a plain-language version of an independent check of those claims against published population and travel data — in effect, a fact-check of ALTO’s report. Every step of the arithmetic is shown so that any part of it can be rejected.
Three numbers do the persuasive work in ALTO’s report Canada’s Moment. They appear in different chapters, rest on different evidence, and are never set side by side. Put side by side, they turn out to want opposite things from the price of a ticket.
| The Promise | What it needs the ticket price to do |
|---|---|
| 1. Ridership. 24 million passengers a year by 2055, rising after that. | Be low. The cheaper the ticket, the more people ride — and for a family of three or more, driving already costs almost nothing extra. |
| 2. Economic benefit. 9.3 billion hours of travel time saved, worth $49.5 billion. | Be low. Every benefit counted in the appraisal — time, car costs, safety, congestion, emissions — depends on how many people actually switch to the train. |
| 3. Paying its own way. “The railway pays for its own operations and maintenance.” | Be high. Most of the cost of running the railway stays the same whether the trains are full or empty, so covering it depends on how much each passenger pays. |
The first two promises pull the fare down. The third pulls it up. That is not a criticism of high-speed rail; every high-speed railway ever built faces the same squeeze. The criticism is that the report presents all three as true at the same time without ever showing the fare that would deliver them.
Everything runs through the ticket price
Picture a single dial: the price of a ticket. Turning that one dial moves all three of ALTO’s claims at the same time, because all three are calculated from it. Turn the price down and more people ride, which automatically raises the total hours saved, because total hours saved is just hours per person multiplied by the number of people. But turn the price down and each ticket brings in less money, so covering the railway’s costs gets harder. The three claims are not three separate discoveries. They are three readings taken off the same dial — and ALTO’s report never shows you the setting it used.
The fare is not a detail to be settled later, once the business case is agreed. It is the number the business case turns on. It enters the arithmetic twice, pulling in opposite directions, and everything else follows automatically.
1 — The fare sets how many people ride
The fare sets how expensive the train is next to driving or flying, which sets the share of trips that choose rail. Apply that share to the total number of intercity trips in the corridor and you have annual ridership.
2 — Ridership sets both the benefits and the revenue
Riders multiplied by the length of the average journey gives total passenger-kilometres. That single quantity drives the hours saved and the ticket revenue. There is no way to improve one without damaging the other.
3 — So the first two promises are the same promise
If the hours saved per passenger are held at ALTO’s own figure, the economic benefit is simply the number of riders multiplied by a fixed amount. The $49.5 billion is the 24 million riders, restated in dollars. That leaves two propositions, not three: one about demand, one about covering costs.
Three numbers agreeing is not three checks passing
If one team checked ridership, another checked time savings and a third checked whether fares cover costs — each using its own method — and all three agreed, that would mean something. That is not what happens here. All three start from the same unpublished ticket price, so of course they agree. They are three shadows cast by the same object. They will always line up, and their lining up is no evidence that the object is the right shape.
4 — And two propositions have one joint answer
Two equations with two unknowns — the fare and the number of riders — will usually have a solution. The claims are not inconsistent with one another. The question is what that solution demands of the corridor.
How much intercity travel there is to win
The corridor’s total travel market is its population multiplied by the number of intercity trips each resident makes on the routes the railway would serve. Modal Shift Note 3 puts the 2025 corridor population at about 14.9 million across the cities directly served, growing at 1.0 per cent a year, and puts intercity travel at about 1.68 trips per resident per year.
Seventy-one per cent of all intercity travel — car, air, bus and rail together — is a share no high-speed railway is known to have won. It is worth being precise about this, because the famous European figures look higher and are not the same measure. Roughly 75 per cent of Madrid–Barcelona travellers choose the train over the plane, and more than 80 per cent on Madrid–Seville; those are shares of the rail-and-air market, which excludes the car. Against a car that costs its driver almost nothing extra to fill, no comparable share of the whole market has been recorded. Nor is 71 per cent a forecast that fails at some fares and works at others. As the sections below show, no fare produces it.
Three realistic fare levels, and what each one buys
Modal Shift Note 3 sets out three combinations of fare and subsidy spanning the realistic range of policy, and reports the share of the market each one wins. The dollar figures are this note’s translation of those descriptions into a fare per kilometre; Note 3 publishes no dollar figures, so the translation is an inference. Every figure below uses the version most favourable to the project.
| The Fare Level | What it delivers |
|---|---|
| A — Heavy subsidy. $0.15 per km (about $64 a journey). Fares held at today’s VIA Rail levels, with $2.5–4.5 billion a year of public money covering construction costs. | 13.5 million riders a year — 38–42% of the market. $27.8 billion of benefit against the $49.5 billion claimed. Fares cover 54% of running costs. |
| All three promises:Not met | |
| B — Moderate subsidy. $0.22 per km (about $94 a journey). Fares matched to airfares, with $1.5–2.5 billion a year of public money covering construction costs. The arrangement the published business case appears to assume. | 10.1 million riders a year — 28–32% of the market. $20.9 billion of benefit. Fares cover 64% of running costs — the best result available at any price. |
| All three promises:Not met | |
| C — Minimal subsidy. $0.28 per km (about $120 a journey). Fares set by a private operator to maximise revenue, above airfare levels, with $0.5–1.5 billion a year of residual public support. Closest to a commercially structured P3; ALTO has published no payment mechanism. | 7.3 million riders a year — 20–23% of the market. $15.0 billion of benefit. Fares cover 63% of running costs. |
| All three promises:Not met | |
| ALTO as published. No fare stated anywhere in the report. | 24.0 million riders a year — 71% of the market. $49.5 billion of benefit. Fares cover 100% of running costs. |
| Fare required to produce this:Never published | |
Even on the most generous treatment — the heaviest subsidy, mature ridership rather than the slower build-up of the opening years, and ALTO’s own hours saved per passenger accepted exactly as published — the economic benefit is $27.8 billion, not $49.5 billion. That is a reduction of 44 per cent arising from the ridership side alone.
Why cheap tickets cannot fix the finances
Think of a gym. It pays rent whether 10 people turn up or 1,000 — that cost is fixed. It also buys more towels and cleaning supplies as more people come — that cost varies with use. A railway works the same way, and the split matters more than it might sound.
Running a railway costs money in two ways. Some costs stay the same however many people ride — track, structures, signalling, stations, head office, and buying the trains. Others grow with the number of trains you run. On ALTO’s own figures, spread over the life of the assets at its own 3.5 per cent rate, the fixed block is $1,130 million a year, and 61 per cent of the total cost does not move with ridership at all.
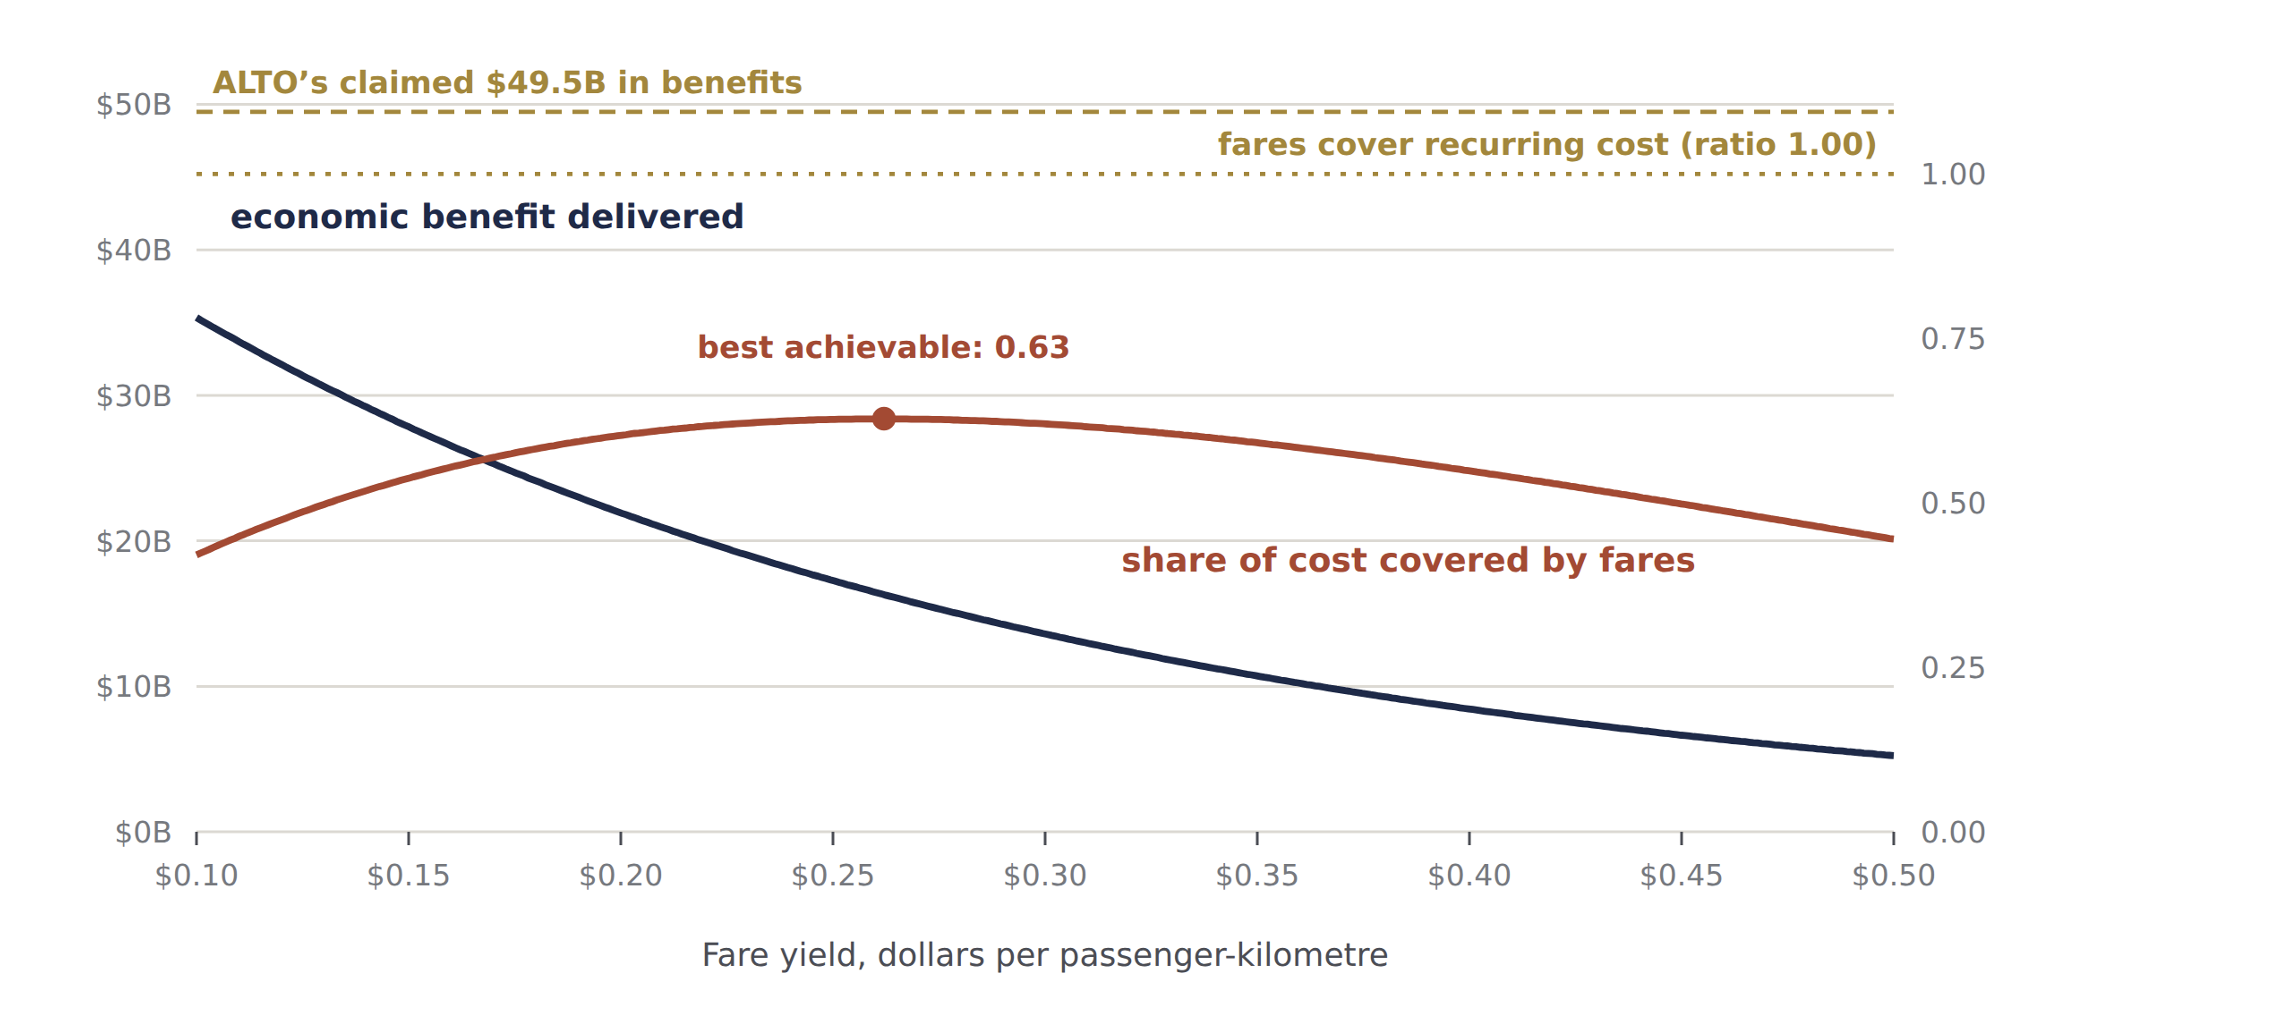
That is why cutting fares to fill the trains does not fix the finances. It helps a little at first — more passengers spread across the same fixed cost — and then makes matters worse, because each extra passenger is paying less. Cost recovery does not simply improve as fares rise. It improves, peaks, and then falls back.
The ceiling is about two-thirds
The turning point sits at a fare near $0.26 per kilometre, where fares cover about 63 per cent of running costs. The best of the three published levels reaches 64 per cent. At no price in the corridor as forecast do fares cover the cost of running the railway. Fares pay about 63 cents of every dollar; the remaining 37 cents comes from the public, every year, forever.
And the best fare for the finances is the worst for the benefits
The fare that comes closest to paying for the railway delivers roughly $16 billion of the claimed $49.5 billion in benefits. The fare that comes closest to one promise is nowhere near the fare that delivers the other.
Against the cost of building it, nothing reaches a dollar
Construction of roughly $75 billion, spread across 2027–2037 and discounted at 3.5 per cent, is worth about $57 billion in today’s dollars. Measured against that, every dollar returns 49 cents of benefit at fare level A, 36 cents at level B and 26 cents at level C. ALTO’s own published benefits return 86 cents — and that failure is ALTO’s own arithmetic, not this note’s. None of these figures counts the operating shortfall above, which the public would have to fund on top.
There is exactly one answer, and it is about the corridor
The obvious next step is to check the promises one at a time and report that none of them survives. That is true, and it is set out below. But it is the weaker exercise, because it invites the reply that the whole thing is merely a disagreement with three forecasts.
A short detour, because the next step depends on it. Suppose you are told two things about a bag of marbles: it holds 18 marbles, and there are twice as many red ones as blue. Neither fact on its own tells you how many are red. Put them together and there is exactly one answer — 12 red and 6 blue. Two facts, each loose on its own, can lock onto a single exact answer once you require both to be true at the same time.
The same move works on the railway. “24 million riders” is one fact. “Fares alone cover the running costs” is another. Neither tells you the ticket price by itself — plenty of low prices might draw 24 million riders, plenty of high ones might cover costs. Require both at the same price, and as with the marbles there is only one price where that is possible.
The stronger exercise is to solve the two propositions together and ask what corridor would satisfy them. Covering costs fixes a relationship between the fare and the number of riders; so does the ridership promise. Two equations, two unknowns, one answer.
The one fare, and the one market, that satisfy all three
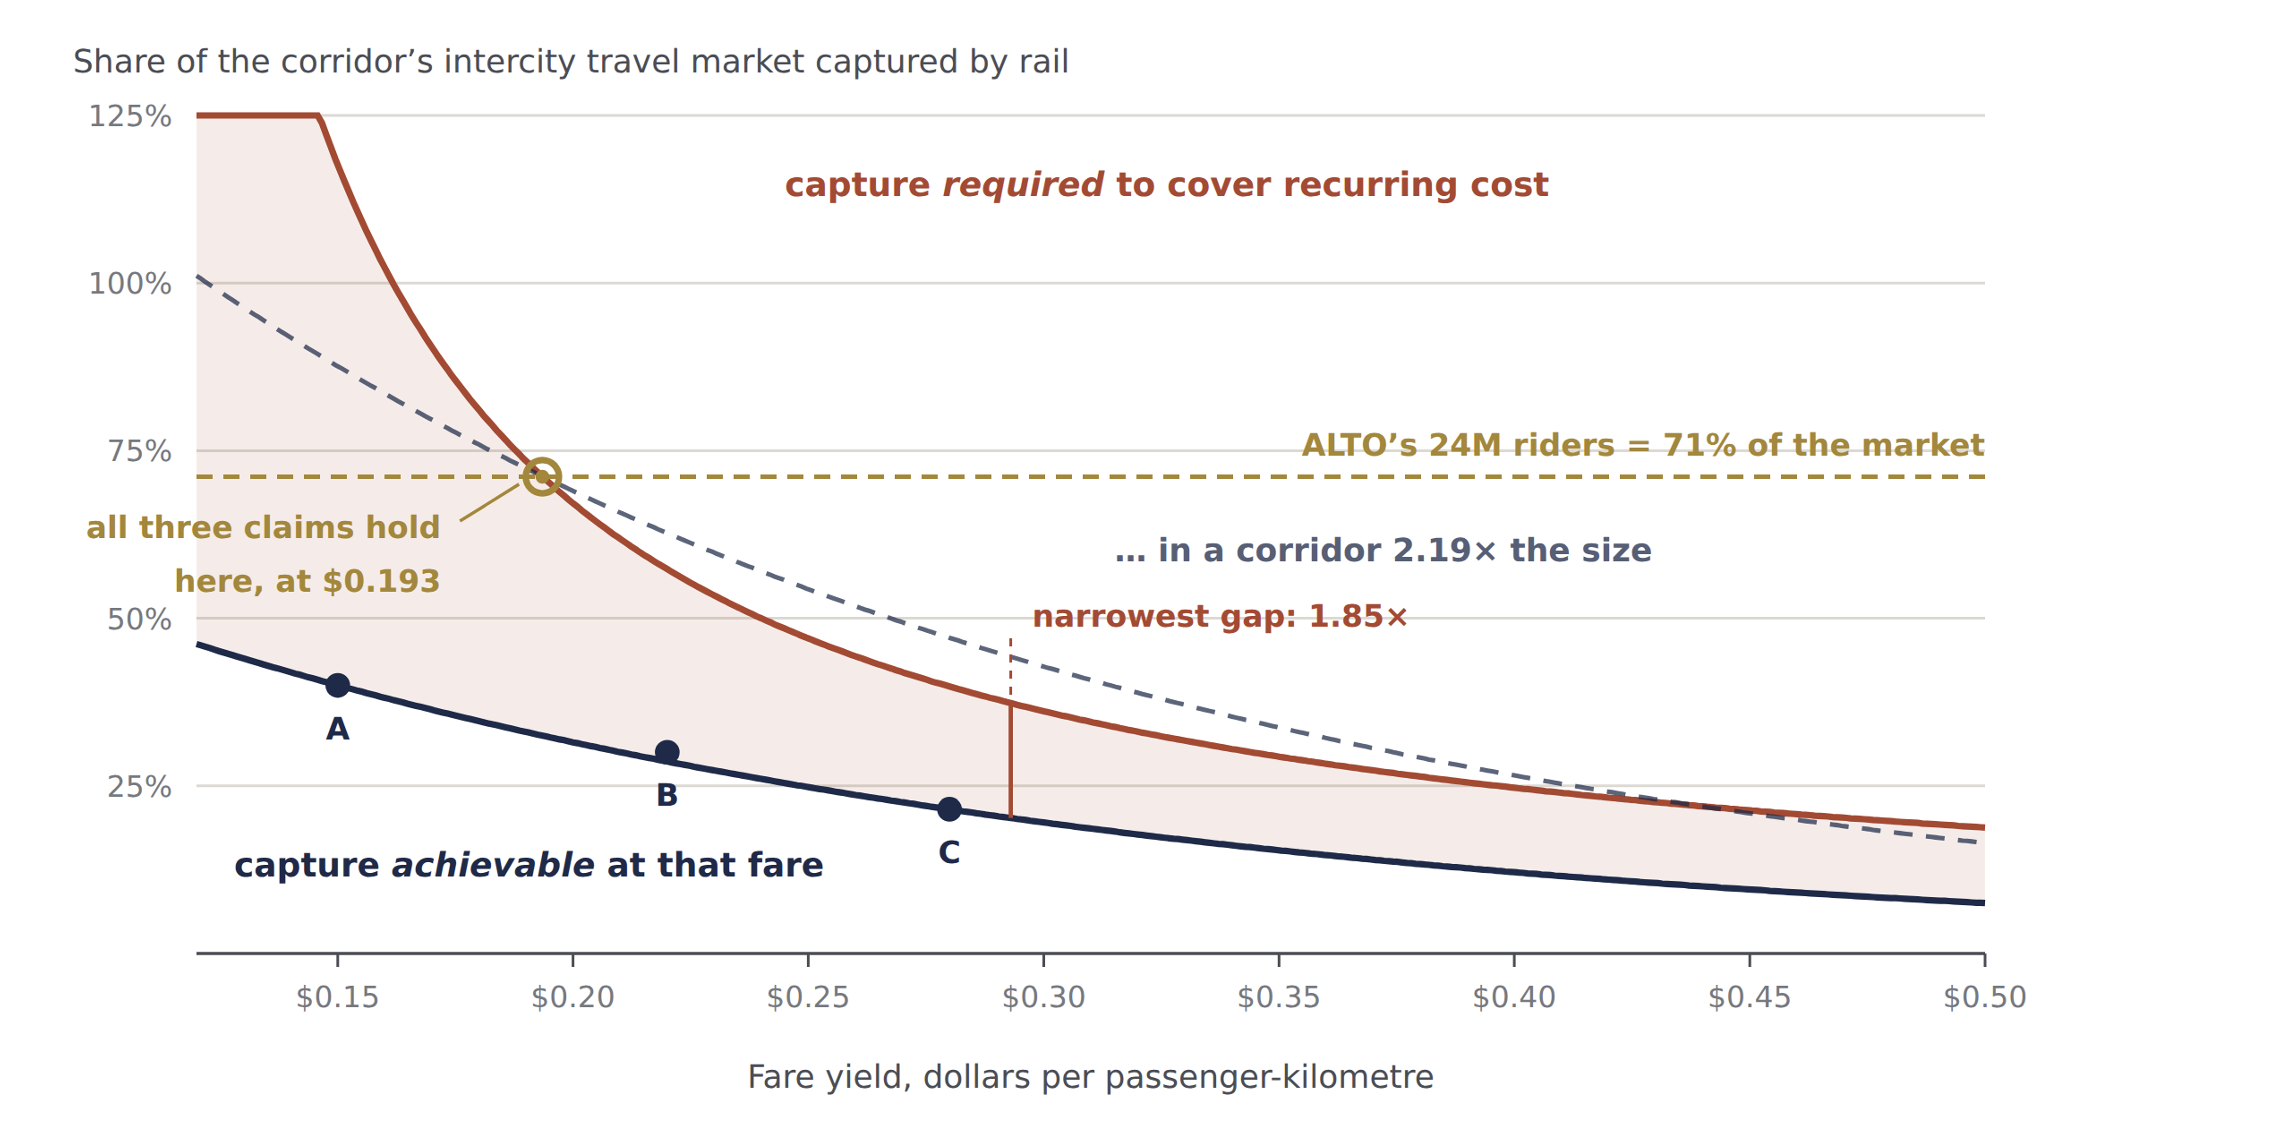
Covering 100 per cent of running costs at exactly 24 million riders requires a fare of $0.1935 per kilometre. At that fare the train wins 32.5 per cent of the market. For 32.5 per cent to equal 24 million riders, the corridor must be generating 73.9 million intercity trips a year. It is forecast to generate 33.7 million. The ratio is 2.19×.
There is only one such point, and it is worth being clear about why. Above $0.193 the railway covers its costs but carries fewer than 24 million people; below it, it carries more but cannot pay for them. Only at $0.193 do the two meet, and where they meet is fixed by the size of the market. The three promises do not contradict each other. They contradict the corridor.
That unstated assertion has a value, and it can be put in whichever units a reader finds easiest to judge:
| Expressed as | Required by the three promises, against the forecast |
|---|---|
| Intercity trips a year, all modes | 73.9 million required, against 33.7 million forecast — 2.19× |
| People living in the corridor in 2055 | 44.0 million required, against 20.1 million forecast — more people on the Toronto–Québec City axis alone than live in Canada today |
| Intercity trips per resident, per year | 3.68 required, against 1.68 — corridor residents travelling more than twice as often as the evidence supports, at a time when remote and hybrid working push the other way |
| Annual population growth, 2025–2055 | 3.7 per cent a year sustained for three decades, against a central forecast of 1.0 per cent and a high forecast of 1.6 |
Anyone wishing to defend all three promises therefore has exactly one thing to defend, and it is a claim about demand rather than about engineering or financing. Cheaper construction, faster trains and a different discount rate do not reach it. Only a larger travel market does.
No ticket price escapes the problem
Within the corridor as forecast, is there some fare — between the three levels above, or beyond them — that escapes the problem? There is not, and the reason is structural rather than a matter of forecasting.
Two things happen at once as the price goes up. The number of riders the railway needs in order to break even falls gently and steadily, like walking down a slope — each rider is worth more, so fewer are needed, but that effect fades out gradually. The number of riders available falls away sharply, because once the train costs about what driving costs, people stop switching to it very quickly. A gentle slope and a cliff do not meet.
Put more precisely: raising the fare lowers the number of riders needed to break even, because each remaining passenger contributes more. But raising the fare also lowers the number of riders available, and it does so faster. The first effect tails off gradually. The second accelerates, because once the train loses its price advantage over a car that costs almost nothing extra to fill, passengers fall away sharply. The second effect always wins.
| At this fare | Market share needed, against market share achievable |
|---|---|
| $0.15 per km — fare level A about $64 a journey |
Needs 117.7% of the entire intercity market. Can win 40%. The railway would have to carry more trips than exist in the corridor at all, across every mode, simply to cover its running costs. |
| $0.22 per km — fare level B about $94 a journey |
Needs 57.3%. Can win 30%. |
| $0.28 per km — fare level C about $120 a journey |
Needs 39.8%. Can win 21.5%. This is as close as the gap ever comes: 1.85×, at about $0.29. |
| $0.40 per km about $171 a journey |
Needs 24.7%. Can win 12.1%. The gap has started widening again as the ridership base collapses. |
Read the last figures as the size of the gap: at every fare, the railway needs between roughly twice and three times the market share it can actually win. There is no fare at which it closes.
Fixing one promise at a time
These are the terms a proponent is most likely to reply in. Three of the four turn out not to reach the joint answer at all.
A larger travel market — reaches all three
A corridor population of 34.0 million by 2055, or 2.85 trips per resident, brings 24 million riders within reach. Covering the running costs as well takes the 44.0 million of the joint answer. This is the only repair that reaches all three promises.
Longer journeys — does not move ridership
An average journey of 793–1,259 km, against the 428 km assumed — meaning essentially every passenger riding Toronto to Québec City end to end, and at fare level A a journey longer than the line itself. It would help cover costs. It puts nobody extra on a train.
Lower running costs — covers costs only
Running costs 37–46 per cent below the O&M Note estimates, with the fixed block down from $1,130 million to about $564 million. Again, nothing on the cost side puts passengers on trains.
A stronger switch to rail — the same claim in different units
The whole demand curve lifted by a factor of 2.19 at every fare. This is arithmetically identical to a bigger market, and equally a claim about demand.
This is the asymmetry the brief turns on. Repairs on the cost side rescue the cost-covering promise and leave the ridership promise exactly where it was, because nothing on the cost side puts passengers on trains. Only a larger travel market reaches all three, and both routes to one — more people, or a greater willingness to switch — are the same claim in different units.
Summary ledger
Taking the promises one at a time, in the corridor as forecast, at every fare examined:
The three promises are not logically inconsistent with one another, and this brief does not claim they are. There is a genuine joint answer. The difficulty is that the answer describes a corridor that does not exist — and that the fourth promise, the one about how much travel the corridor generates, is the only one ALTO has never had to defend, because it has never been stated.
That distinction is not a technicality. A single claim that says “this project needs more than twice the travel demand anyone forecasts” invites immediate scrutiny. Three separately sourced numbers that merely happen to agree do not. Splitting one unproven assumption across three chapters is what allowed it to travel through public debate unchallenged — and catching that before tens of billions of public dollars are committed is the whole point of a review like this one.
What this brief does not claim
The translation of the three fare levels into dollars is an inference
Modal Shift Note 3 defines the three levels by how much subsidy they need and how they compare with airfares, not in dollars per kilometre. The $0.15, $0.22 and $0.28 figures are this brief’s reading of what those descriptions imply. Anyone who rejects the reading should supply the fares the business case actually assumes — and the conclusion holds across the whole range of fares, not only at those three points.
The 428-kilometre average journey is an assumption
Carried over from revised O&M Note 3. It matters a great deal: revenue and hours saved both rise and fall with it.
The construction cost figure is not ALTO’s
The $75 billion is the midpoint of the $60–90 billion range used elsewhere in this series. ALTO publishes no comparable figure. The returns per dollar should be read as indicative, and they measure benefits against construction cost alone.
Nothing here depends on the 9.3-billion-hour figure being correct
It is held at ALTO’s own value throughout. If it is correct, the findings stand as stated. If it turns out to be overstated, the benefit column falls further still and every conclusion here becomes firmer, not weaker.
The model of the train service is coarse
A single 450-seat train type, uniformly 65 per cent full over a 1,000-kilometre corridor, is a simplification. A real railway would vary train length and frequency by section, which would cut the ridership-related costs somewhat when ridership is low. It would not touch the fixed costs, which is where the problem lies.