Tag: benefit-cost ratio

  • Tourism Study

    Benefits for Stations, Costs for the Corridor

    ALTO has published its own tourism study. It studies only the seven station cities — and counts none of the costs.

    ⚠ New Release: ALTO Commissions a Tourism Study

    In June 2026 ALTO released “Tourism in the Alto Corridor: Current Conditions and Potential Impacts,” prepared for ALTO by the consultancy CPCS in association with HDR. It is the first time the project has placed a tourism analysis on the public record. The report’s headline is that ALTO “could contribute an additional $1 billion to GDP annually, and support 11,500 more jobs under a medium coordination scenario.”

    The report carries the standard commissioned-work disclaimer — the opinions “are those of the authors and do not necessarily reflect the views of Alto” — and is dated June 2026, after the April 24 consultation deadline had already closed. It is a gross-benefit study of the seven station cities. It does not measure a single cost.

    Critical Finding

    ALTO’s own consultant has now confirmed, in writing, the distinction this initiative has argued from the start: tourism benefits accrue to stations, not to the tracks between them. The report studies only the six Census Metropolitan Areas that contain the seven proposed stations — Toronto, Peterborough, Ottawa-Gatineau, Montreal, Trois-Rivières, and Québec City. The rural landscapes the corridor would traverse without stopping — Frontenac, Leeds & Grenville, the entire RTO 9 region — are outside the study’s frame entirely.

    The report is a benefits-only document. It contains no construction-phase impacts, no tourism losses, and no accounting for visitors who shift away from non-station regions toward station hubs — even though the report itself concedes that smaller places that fail to differentiate “will limit gains — or even risk losing activity to larger centres.” The study answers one question: how much tourism might the seven stops gain? It never asks the second: what does the corridor cost the regions it passes through?

    The much-quoted “$1 billion / 11,500 jobs” is the medium scenario, not the central case. The low scenario is +$177 million and roughly 2,000 jobs. Even the medium figure is contingent on dedicated tourism policy, last-mile connections, and destination readiness across the corridor — none of which ALTO controls or funds. The report concedes the foundational caveat in its own words: “HSR alone is rarely sufficient to generate sustained tourism development.”

    Download
    Benefits for Stations, Costs for the Corridor — Full Brief (PDF)
    A point-by-point reading of ALTO’s tourism study against the cost side it omits, with the evidence from this initiative’s earlier tourism research
    Download PDF
    What the Study Is

    A commissioned, benefits-only study of the seven stops

    “Tourism in the Alto Corridor” combines three things: a baseline profile of tourism in the six station CMAs; a review of international case studies on high-speed rail and tourism; and three illustrative scenarios that vary the level of tourism-policy coordination from low to high. Its baseline finding is that tourism in those CMAs already generates over $31 billion in visitor spending, contributes about $33.7 billion to GDP, and supports more than 377,000 jobs, with Toronto and Montreal accounting for the largest shares.

    The forward-looking finding — the one ALTO’s communications will lead with — is that additional tourism spending under the project could add to GDP and jobs. But the three scenarios produce very different numbers, and the report is explicit that they are “illustrative and should not be interpreted as forecasts.”

    +$177M
    added GDP / ~2,000 jobs — low coordination scenario
    CPCS for ALTO, p.23
    +$1.0B
    added GDP / 11,500 jobs — medium coordination scenario (the headline)
    CPCS for ALTO, p.23
    +$3.9B
    added GDP / 43,000 jobs — high coordination scenario
    CPCS for ALTO, p.23

    The single most important sentence in the document appears on page 7: the destinations “most likely to be affected by a high-speed rail service are the urban areas where stations are located.” That premise defines the study’s entire scope. Everything that follows is built on the six station CMAs. The communities between them — the ones with no station — are not modelled, not measured, and not mentioned in the results.

    What ALTO’s Consultant Concedes

    The report admits the bypass risk in its own words

    This initiative has argued throughout the consultation that high-speed rail creates a station/no-station divide: stations create tourism, tracks do not. ALTO’s commissioned study does not contradict that argument. In several places, it states it.

    What the report saysWhat it means for the corridor regions
    “The travel and tourism destinations most likely to be affected by a high-speed rail service are the urban areas where stations are located.” (p.7) The study is then built only on the six station CMAs.The regions the southern corridor would cross without a station — Frontenac, Leeds & Grenville, Lennox & Addington, the RTO 9 region — are outside the analytical frame. The study cannot show a benefit for them because it never looks at them.
    Smaller municipalities that fail to differentiate and coordinate “will limit gains — or even risk losing activity to larger centres.” (p.18)This is the bypass / agglomeration effect, conceded. The report frames it as a risk that supportive policy might manage. For a region with tracks and no station, it is the predictable default, not a managed exception.
    “HSR alone is rarely sufficient to generate sustained tourism development; realized impacts depend on coordinated local strategies.” (p.18)Even the modelled gains require destination marketing, event programming, accommodation, and last-mile connections that ALTO neither funds nor controls. Absent that coordination, the report’s own logic points to the low scenario or below.
    International tourist numbers see “limited to no change” (p.22 note); nearly all modelled gains are in-corridor domestic visitors making shorter trips.The projected uplift is largely Ontario and Quebec residents travelling more within their own provinces — a reshuffling of where Canadians already spend, not clearly net-new national tourism. The report never tests whether this is displacement.

    Read together, these are not stray caveats. They are the analytical spine of the report. ALTO’s consultant has confirmed the station/no-station distinction, conceded that non-station places can lose activity, and acknowledged that the benefits depend on conditions outside ALTO’s gift.

    Update · July 2026

    A second commissioned study, and what it says about the first

    This brief was published in June 2026, days after ALTO released the CPCS tourism study. On July 13, 2026 ALTO published a second commissioned economic study — An Overview of the Structural Economic Impacts of Alto, prepared by Aviseo Consulting — alongside a blog post summarising it. That study answers a question this brief left open, and it answers it against ALTO’s own tourism claim.

    The displacement question, answered by ALTO’s other consultant

    This brief noted that the modelled tourism gains are largely in-corridor domestic visitors, that international numbers show limited to no change, and that the CPCS report never tests whether this is displacement rather than net-new national tourism.

    The Aviseo study does test it, and reaches the opposite conclusion. It counts international tourism only, on the stated ground that increased domestic tourism would at least partly reflect substitution from existing household expenditure, with limited net effect at the macroeconomic level. In its own words, the driver of national GDP is the net inflow of foreign spending.

    The category that produces the CPCS headline is therefore the category ALTO’s other consultant sets aside as largely a reshuffling of money Canadians would have spent anyway.

    Aviseo — $0.8 billionCPCS — $1.0 billion
    International visitors only. Domestic tourism excluded as substitution with limited national effect. Estimated using a general equilibrium model, which nets out activity displaced from elsewhere in the economy.Medium scenario driven predominantly by in-corridor domestic travel. Estimated using Statistics Canada input-output multipliers including induced effects, which aggregate gross activity without netting displacement.
    Result:Two figures that cannot be combined

    A third figure circulates alongside them. ALTO’s FAQ page advertises $800 million a year in tourism revenue. That corresponds to Aviseo’s contribution-to-GDP figure, which is a value-added measure rather than revenue, and matches no revenue figure in either report.

    In the base case, two station cities receive nothing

    This brief established that the rural corridor regions are outside the study’s frame. The per-city results, at Tables 13 and 15 of the CPCS report, show that the scope problem does not stop at the regions left out. It reaches two of the station cities that were included.

    CityAdditional annual tourism spending
    Toronto$37M under low coordination; up to $1,500M under high
    Québec City$50M under low coordination; up to $500M under high
    Montréal (incl. Laval)$44M under low coordination; up to $900M under high
    Ottawa-Gatineau$21M under low coordination; up to $560M under high
    Trois-Rivières$0 under low coordination; up to $25M under high
    Peterborough$0 under low coordination; up to $35M under high
    Low coordination:Nothing for the two smallest station cities

    The GDP table records the same outcome: under low coordination Peterborough remains unchanged at $475 million and Trois-Rivières unchanged at $318 million. Even under full corridor-wide policy coordination, Peterborough reaches up to $35 million against Toronto’s $1.5 billion — a ratio of roughly 43 to 1.

    The blog post with which ALTO announced this study is titled “How High-Speed Rail Will Boost Tourism from Big Cities to Small Towns.”

    The summary reverses the report’s own caution

    This brief quoted the report’s statement that its scenarios are illustrative and should not be interpreted as forecasts. ALTO’s June 8 blog post describes the same scenarios as forecasts, says the report contains tangible projections, and states that ALTO engaged CPCS to provide real-world, objective results. It reports the medium scenario figures and does not mention the low scenario at all.

    An unreported finding: faster trains can reduce hotel revenue

    Under low coordination, business tourism spending falls in Montréal, Ottawa-Gatineau and Québec City, as high-speed rail converts overnight business trips into same-day return trips. The report cites the Paris–Lyon case, where average stays fell from 2.3 nights to 1.7 once same-day return became practical. This appears in no public summary of the study.

    The Initiative examines the second study, the treatment of both in ALTO’s public materials, and the arithmetic of the 1.1 per cent GDP claim in a companion economics brief. Two Point Two Trillion

    The Cost Side

    Everything the study does not count

    A tourism impact assessment that names a benefit but no cost is a half-ledger. The report’s title promises “potential impacts”; what it delivers is potential gains at the seven stops. The costs documented in this initiative’s earlier research — and in submissions from affected regions — appear nowhere in it.

    Cost the corridor imposesHow ALTO’s tourism study treats it
    Construction-phase disruption. Eight to ten years of blasting, dust, night lighting, truck traffic, road closures, and trail severance through tourism-dependent rural areas — documented in this initiative’s RTO 9 submission and the snowmobile-trail brief.Absent. The scenarios model an operating railway “if Alto were in service today.” The decade of construction that precedes any operating benefit is not in the analysis at all.
    Treatment:Not counted
    Trail and active-tourism loss. The Cataraqui Trail (a 104 km segment of the Trans-Canada Trail) and the organized snowmobile network of OFSC Districts 1, 2 and 6 — an estimated $220–270 million in direct expenditure and $450–540 million in total annual activity — run through the corridor.Absent. The study’s tourism universe is the six metropolitan CMAs. Rural rail-trail and winter-tourism economies are not in its scope, so their potential loss does not register against the modelled urban gains.
    Treatment:Not counted
    The at-risk regional economy. RTO 9 recorded $1.8 billion in tourism spending in the first nine months of 2024; the Rideau Heritage Route sustains roughly $695 million in GDP and 8,744 jobs. Both sit in the southern corridor’s path.Absent. Neither figure appears. The regions that generate them are not among the six CMAs studied, so the report’s GDP and jobs gains are not netted against any of this exposure.
    Treatment:Not counted
    VIA Rail displacement — regional and national. MP Scott Reid has confirmed in writing that either corridor option is likely to reduce VIA ridership and trigger service cuts through Kingston, Brockville, and other southeastern Ontario towns — the low-carbon access mode visitors use to reach these destinations without a car. The risk is also national: then–NDP transport critic Taylor Bachrach (Skeena–Bulkley Valley) warned that VIA earns more than 80% of its revenue and carries more than 90% of its passengers on the Quebec City–Windsor corridor, and that handing that corridor to a private operator would leave VIA with “a fraction of the revenue” it uses to cross-subsidize long-distance rural routes across the Prairies, the West, and the Maritimes.Absent. The report does not consider the loss of existing rail access to non-station communities, even as it counts new rail access as a benefit to station communities. Nor does it weigh the wider risk to the national VIA network that the corridor’s revenue currently helps sustain.
    Treatment:Not counted
    Visitors drawn away from non-station regions. The bypass effect the report concedes on page 18 — activity migrating to larger centres with stations.Conceded but not quantified. The report names the risk and then models only the upside at the stations that would gain. The corresponding loss elsewhere is acknowledged in prose and excluded from the numbers.
    Treatment:Acknowledged, not measured
    How Robust Are the Numbers?

    Assumption-driven scenarios, not forecasts

    Even taken on its own terms, the report’s headline number is softer than it will sound in a press release. Five features of the method are worth keeping in view.

    The headline is the middle scenario, not a central estimate

    The “$1 billion / 11,500 jobs” figure is the medium coordination scenario. It requires dedicated tourism policy in every city, improved last-mile connections, and rising convention and event activity. The report’s own framing makes clear these are conditions to be met, not outcomes of the railway itself.

    The gains are scenario assumptions, not a Canadian model

    The arrival, length-of-stay, and spending percentages in Appendix B are judgmental selections from the international literature, applied to Canadian baseline data. They are not derived from a Canadian demand model or validated against Canadian outturns. The outputs are functions of the chosen inputs.

    No reference-class or outturn discipline

    The tourism uplift is bracketed by three policy scenarios chosen to span a positive range. There is no reference-class comparison to what comparable HSR projects actually delivered — the same optimism-friendly structure this initiative has critiqued in ALTO’s ridership and cost work.

    Shorter stays can reduce spending even as arrivals rise

    The report concedes that average length of stay falls in some cities even in the medium scenario, as shorter-staying in-corridor visitors displace longer-staying international ones, and that accommodation spending can drop even when arrival counts go up.

    The report’s own “structural differences” section undercuts transfer

    Page 19 lists the reasons the European evidence may not transfer to Canada: dispersed attractions, lower base tourism, car-dominant travel (85–98% of corridor visitors drive today; train is about 6% to Toronto and ~2% elsewhere), and an immature rail network. It concludes “early impacts may take longer to be realized.”

    Where Things Stand · June 2026

    Summary ledger

    Measuring ALTO’s tourism study against what an honest tourism assessment of the corridor would have to show:

    Confirmed
    Benefits accrue to stations, not tracks. ALTO’s consultant builds the entire study on the six station CMAs and states that station cities are the destinations most likely to be affected (p.7).
    Confirmed
    Non-station places can lose activity. The report concedes the bypass / agglomeration risk in its own words (p.18).
    Confirmed
    HSR alone is not sufficient. Benefits depend on policy coordination, last-mile connections, and destination readiness that ALTO does not fund (p.18).
    Confirmed
    The scope problem reaches inside the study. Under low coordination, Peterborough and Trois-Rivières — two of the six CMAs the report does cover — receive $0 additional tourism spending and $0 additional GDP (Tables 13 and 15).
    Soft
    The headline figure is the medium scenario, not a central estimate; the low scenario is roughly one-sixth of it. The numbers are scenario assumptions, explicitly “not forecasts.”
    Soft
    Gains are largely in-corridor domestic, with international numbers showing little change — raising an unanswered displacement question.
    Omitted
    Construction-phase disruption (8–10 years): not in the analysis.
    Omitted
    Trail and winter-tourism loss (Cataraqui Trail; OFSC Districts 1/2/6, $450–540M total activity): not in scope.
    Omitted
    At-risk regional economy (RTO 9 $1.8B; Rideau Heritage Route $695M GDP / 8,744 jobs): not netted against modelled gains.
    Omitted
    VIA Rail displacement: loss of existing rail access to non-station communities not considered — nor the national risk to VIA, which earns 80%+ of its revenue on this corridor.
    Omitted
    Bypass losses: conceded in prose (p.18) but excluded from the numbers.
    Contradicted
    ALTO’s two consultants disagree on the headline category. The Aviseo study (July 2026) counts international tourism only, treating domestic tourism as substitution with limited net national effect — the category that drives the CPCS figure. The two estimates use methods that cannot be combined.
    Reversed
    “Should not be interpreted as forecasts.” ALTO’s own June 8 blog post describes the same scenarios as forecasts and tangible projections giving real-world, objective results, and reports the medium scenario alone.

    ALTO has now produced its own tourism study, and it confirms three things this initiative has argued throughout. Tourism benefits accrue to stations, not to tracks. The rural corridor regions are not in the study. And the report contains no cost side at all. ALTO’s consultant has, in effect, validated the station/no-station distinction while declining to measure the half of the ledger that falls on Eastern Ontario. A benefits-only study of the seven stops is not a tourism impact assessment of the corridor.

    Download Full Brief
    Benefits for Stations, Costs for the Corridor (PDF)
    Complete reading of ALTO’s tourism study for decision-makers, RTO 9, MTCG, MPs, and constituents tracking the tourism file
    Download PDF
    Sources

    Primary documents

    1.
    CPCS, in association with HDR, for ALTO. Tourism in the Alto Corridor: Current Conditions and Potential Impacts. June 2026. (Scenario results, pp.21–24; policy-coordination conclusions, p.18; study scope, p.7; structural differences, p.19; baseline, p.5.)
    2.
    ALTO HSR Citizen Research Initiative. The Tourism Economy at Risk. citizenresearch.ca/tourism-economy
    3.
    ALTO HSR Citizen Research Initiative. Snowmobile Trails and High-Speed Rail. citizenresearch.ca/snowmobile-trails
    4.
    Submission to RTO 9 — ALTO High-Speed Rail Southern Corridor: Tourism & Economic Impacts for Southeastern Ontario. February 2026. (RTO 9 regional tourism spending, Jan–Sep 2024.)
    5.
    OFSC 2022–2023 Economic Impact Study (Harry Cummings & Associates, using the Ontario Ministry of Tourism TREIM model); district-level apportionment for Districts 1, 2 and 6.
    6.
    MP Scott Reid, correspondence to constituents (2026), re: VIA Rail displacement risk from HSR corridor selection.
    7.
    CBC News, “NDP warns privatizing high-speed rail from Toronto to Quebec could kill passenger trains in rest of Canada,” February 19, 2025 — carries MP Taylor Bachrach’s warning and VIA’s corridor revenue and passenger shares. cbc.ca
    8.
    ALTO, “Embark on a culinary adventure from Toronto to Quebec City” — Facebook advertisement, February 2026 (alto-hsr.ca).
  • 30 Pieces

    Community Advocacy

    The Thirty Pieces Problem

    Why communities must not accept ALTO’s conditional concessions.

    How to read this page

    This is a direct address to communities in the ALTO corridor. Everything cited here is on the public record — drawn from ALTO’s own published Community Partnerships Policy (altotrain.ca), from verified council meeting transcripts, from public sponsorship listings, and from stakeholder reports. Read the documents. Then decide what you think is being offered — and why.

    A Current Example · June 2026

    It begins with a logo at a festival

    The clearest illustration of what this page is about appeared in June 2026 — not in a council chamber in the southern corridor, and not as a trail or a conservation grant, but as a sponsorship logo at a celebration of Franco-Ontarian culture.

    ALTO is listed as an Official Sponsor of the 2026 Festival Franco-Ontarien, the flagship annual celebration of Franco-Ontarian culture held in Ottawa. The festival serves precisely the francophone communities along the Ottawa–Montreal segment of the corridor — among the communities most directly affected by that section of the proposed route. The sponsorship places ALTO’s name, logo, and presence at the centre of a major cultural gathering in the very community the project would run through.

    Verified — Festival Franco-Ontarien partners page (ffo.ca), June 2026

    Visibility and “activation,” made visible

    ALTO’s logo appears among the festival’s Official Sponsors, alongside major institutional and corporate backers. To announce the partnership, the festival published a message welcoming ALTO’s support and describing a shared ambition to bring communities closer together and to make it easier to gather and share francophone culture, traditions, and pride. ffo.ca/partenaires

    That welcome message was met with public criticism from members of the affected corridor community, who objected that a francophone institution was lending its name and credibility to a project they regard as a threat to the very communities it represents. The festival subsequently removed the post. ALTO, however, remained listed as an Official Sponsor on the festival’s website — the visible partnership intact, the public celebration of it quietly withdrawn.

    As the rest of this page documents, ALTO’s own community-funding policy explicitly lists “visibility for the Corporation” and “the opportunity to engage directly with the community” among the things it values in the projects it supports. The festival sponsorship is that aim realized: favourable association with a trusted community institution, in a community the project would directly affect. The vehicle is a sponsorship rather than a grant, but the function is identical.

    None of this implies wrongdoing by the festival. Cultural organizations depend on sponsorship, and accepting it is neither unusual nor improper. But the public is entitled to see who funds the institutions that anchor francophone cultural life — particularly when the funder has a direct and material stake in a project that runs through the communities those institutions represent. The reaction the announcement drew, and the quiet removal of the post that followed, are exactly the kind of signal this page asks communities to notice and name rather than smooth over.

    The festival is not an exception. It is the most public, most recent instance of a pattern that has a name, a budget, and a published policy behind it. The rest of this page sets out how that pattern works — and why every community and institution in this corridor should understand it.

    The Pattern

    A familiar playbook

    Major infrastructure projects have long known that the most effective way to manage dissent is not to silence it, but to purchase it — selectively, quietly, and just expensively enough to matter.

    The mechanism is well-understood in the literature on large infrastructure governance. Targeted concessions are offered to communities or organizations most likely to generate organized opposition. The concessions need not be large; they need only be large enough to fracture solidarity, create a sense of obligation, and introduce ambiguity where principled opposition once stood clear.

    This is not a hidden strategy. It is documented in the histories of pipeline negotiations, highway expansions, and stadium developments across North America. In those cases, communities that accepted small concessions found, after approval, that the concessions evaporated while the harms did not. What distinguishes the ALTO case is that the mechanism has been formalized, named, given a budget, and posted on ALTO’s own website. It is called the Community Partnerships Policy. You can read it yourself — and you should.

    ALTO’s Published Programme

    The Community Partnerships Policy: what it actually says

    ALTO’s Community Partnerships Policy is a formal, six-page document governing how the Corporation will distribute grants to organizations along the Quebec City–Toronto corridor. It covers eligible organizations, project types, assessment criteria, budget ranges, and reporting requirements. It was published on ALTO’s website and is presented as a transparency measure.

    Read on its own terms, the document is unremarkable. Community investment programmes are standard features of large infrastructure projects. But several provisions, taken together, reveal the strategic logic underlying the programme — and communities should understand that logic before they apply.

    Source Document

    ALTO Community Partnerships Policy (Published)

    The policy covers registered charities, non-profit organizations, schools, municipal services, First Nations organizations, and community associations. Grants range from under $10,000 to a maximum of $50,000 per project, with no multi-year commitments. Applications are assessed by an internal committee and approved by ALTO’s Chief Officers Committee.

    ALTO has also published a companion page on Indigenous partnerships and a separate Indigenous Peoples Participation Funding programme.

    Community Partnerships Policy   Indigenous Partnerships Vision   Indigenous Peoples Participation Funding

    The policy’s stated objectives are economic vitality, environmental vitality, and social vitality — language familiar from any corporate social responsibility framework. What deserves closer attention are the assessment criteria by which applications are evaluated, because ALTO included two criteria that are, for a programme operating in actively contested communities, remarkable.

    ALTO’s published assessment criteria — Step 2AWhat it means in practice
    ① Adherence to one or more areas in section 4.1Standard eligibility check.
    ② Benefits for the communities targeted by the projectStandard community benefit criterion.
    ③ Alignment with the Corporation’s valuesOrganizations whose work or public positions conflict with ALTO’s objectives are less likely to score well here. The criterion is undefined, unappealable, and determined internally by ALTO.
    ④–⑥ Eligible territory; geographic scope; quality of planningAdministrative criteria.
    ⑦ Visibility for the CorporationALTO’s own language. Applications that generate positive public exposure for ALTO score better. Applications from organizations known for opposing the project do not.
    ⑧ Opportunity to engage directly with the community (activation)Again, ALTO’s own language. The programme explicitly values the opportunity to place ALTO representatives in direct community contact — in precisely the communities where the project is contested.
    ⑨–⑩ DE&I principles; alignment with sustainable developmentStandard programme criteria.

    Criteria ③, ⑦, and ⑧ are not neutral administrative measures. Read together, they describe a funding programme designed to reward community alignment with ALTO, generate favourable public visibility for the Corporation, and create structured opportunities for ALTO staff to establish presence in affected communities. This is not a community benefits programme. It is a community relations programme with a grant attached.

    “A concession that does not address the harm is not a remedy. It is a price tag attached to your silence.”

    ALTO HSR Citizen Research Initiative
    Section 4.3 of the Policy

    The prohibition on advocacy

    The Community Partnerships Policy contains one further provision that deserves to be read by every organization considering an application. Under section 4.3, the following project types are explicitly listed as ineligible:

    Ineligible — ALTO policy text

    Lobbying campaigns

    Defined as ineligible in ALTO’s own policy text. Grants may not be used for advocacy activities — including, it must be inferred, advocacy concerning ALTO itself.

    Ineligible — ALTO policy text

    Projects of a controversial nature… or raising issues of social acceptability

    A corridor community’s opposition to ALTO could plausibly be described as raising “issues of social acceptability.” This criterion is defined by ALTO’s internal committee, not by an independent standard.

    The implication is direct: an organization that accepts ALTO funding cannot use that funding for advocacy, including advocacy about the project that is funding it. In practice, this creates a chilling effect that extends beyond the funded project itself. An organization that has accepted ALTO money — for a community festival, a wetland restoration project, an education programme — will reasonably hesitate before publicly opposing the project that funded it. The transaction does not require silence. It tends to produce it anyway.

    This is not speculation about ALTO’s intentions. It is a predictable consequence of any funder-recipient relationship in a context of active controversy. It is why transparent conflict-of-interest disclosure by funded organizations — including in any public position they take on the project — is essential.

    The Offers

    What has been reported in the corridor

    Beyond the formal programme, the same logic can play out through informal channels — some of it already visible in municipal proceedings, some of it foreseeable but, by design, leaving little or no record. None of these carry legal weight or any accountability mechanism. When the project receives approval — if it does — none of them are enforceable. They will simply be forgotten, differently, by everyone who heard them.

    Documented — Napanee Town Council, April 14, 2026 (transcript verified)

    A trail alongside the tracks

    The Mayor of Greater Napanee referenced correspondence headed to County Council suggesting “some form of a trail associated to it on the outside of the fence.” His own framing: “if we’re not gonna have a whole lot of choice on this then we’re gonna get out of it.” The trail was not offered by ALTO — it arose from community correspondence. That makes it a more significant example, not less: the rationalization was entirely spontaneous.

    Foreseeable — likely a formal mitigation measure

    Other avenues: conservation land and offsets

    Cash grants are not the only currency available to a project of this scale. A railway acquires and controls large amounts of land, and some of it is likely to be transferred to conservation organizations as part of ALTO’s environmental mitigation and offsetting. Such transfers would be formal, documented, and binding — but that does not make them neutral. A transfer that benefits a conservation organization can still soften the scrutiny of a body that might otherwise be among the project’s most credible critics, and a parcel of offset habitat does not replace a fragmented biosphere. The thing to watch is whether mitigation land is presented as a community benefit rather than as what it is: compensation for harm the project concedes it will cause.

    Formal programme — ALTO website

    Community partnership grants

    ALTO’s published Community Partnerships Policy makes grants of up to $50,000 available to eligible corridor organizations for environmental, economic, and social projects. Selection criteria explicitly include “Visibility for the Corporation” and “Opportunity to engage directly with the community.” No multi-year funding is available.

    Public statement — ALTO Chief Executive

    The future Kingston station

    ALTO’s Chief Executive indicated that Kingston might receive a station “in the future.” This is a commitment unbacked by any timeline, funding envelope, or legal obligation — and offered during a period of active public opposition from the Kingston region.

    Verified — ffo.ca partners page, June 2026

    A festival sponsorship in the francophone corridor

    ALTO is listed as an Official Sponsor of the 2026 Festival Franco-Ontarien — Ottawa’s flagship francophone cultural celebration, serving the communities along the Ottawa–Montreal segment of the corridor. A festival post welcoming ALTO’s support was later removed following public criticism; the sponsorship listing on the festival’s website remained in place.

    Taken together — the documented trail, the public statement about a future station, the formal grants programme, the festival sponsorship, and the conservation-land transfers a landholding project can always reach for — these describe a coherent strategy that works on more than one level at once: formal, procedurally legitimate measures (grants, sponsorships, and mitigation transfers) that generate visibility, goodwill, and community presence, and a layer of informal undertakings made in meetings and remembered differently by different parties.

    Documented Evidence — Greater Napanee Council, April 14, 2026

    The rationalization on the record

    The April 14, 2026 ordinary session of Greater Napanee Town Council provides the clearest documented example of the dynamic this page describes — and it came not from ALTO, but from within the community itself.

    The Mayor referenced correspondence heading to Lennox & Addington County Council that suggested a trail might be built alongside the rail corridor. His precise words: “if this rail line is going to be produced or built one way or the other, there’s a suggestion that there’d be an option to put some form of a trail associated to it on the outside of the fence… if we’re not gonna have a whole lot of choice on this then we’re gonna get out of it that will benefit the municipalities.”

    The trail did not come from ALTO. It came from a community member’s correspondence. ALTO had not offered it. What the meeting recorded — in public, on transcript — was the moment a community forum began, unprompted, to shift from “should this happen” to “what can we get.” The same meeting heard its CAO report that ALTO’s process was explicitly framed as asking “how, not if” — confirming that ALTO itself had no mandate to decide whether to build, only how. That framing, delivered to a credible civic officer in a formal stakeholder meeting, is precisely what creates the psychological conditions in which trails begin to seem worth discussing.

    Notably, that same council session saw near-unanimous opposition from every councillor present, including one who explicitly said he would sign a joint letter opposing ALTO in its entirety. Opposition and rationalization were occurring simultaneously, in the same room. That is the dynamic communities need to understand and name.

    The Psychology

    The rationalization trap

    There is a moment — and it happens in every community that faces a project like this — when people who know something is wrong begin to construct reasons why accepting it is, in fact, reasonable. The harm is real, but perhaps unavoidable. The payment is small, but it is something. And if it is happening regardless, shouldn’t we at least secure what we can?

    You may have already heard this reasoning in your own council chamber, at your kitchen table, or in a conversation after a community meeting. It is not dishonest. It is genuinely human. But it is also exactly what it feels like when a community begins to accept the unacceptable — not with enthusiasm, but through the slow substitution of negotiated scraps for principled resistance.

    The insight at the heart of the Judas archetype — explored with uncomfortable precision in the dramatic tradition — is that the act of rationalizing a betrayal does not change what the betrayal is. Reframing a transaction as something other than what it is does not alter its moral weight. A community that accepts a trail, a land access agreement, and a conservation grant while staying quiet about road severance, watershed contamination, karst subsidence risk, and permanent agricultural land loss has made a transaction. The only question is whether it understood the exchange rate going in.

    The Exchange

    The asymmetry of the exchange

    The offers being made to corridor communities deserve to be evaluated against what is actually at stake. The following comparison is necessarily incomplete — the full scope of ALTO’s impacts remains undisclosed — but even a partial accounting reveals the starkness of the exchange being proposed.

    What is being offeredWhat is at stake
    A recreational trail adjacent to the corridor (informal, unreported)Severance of road access to farms, properties, and communities; permanent fragmentation of the rural landscape
    Conservation land or habitat offsets transferred to environmental organizations as project mitigationPermanent loss of agricultural land; destruction and fragmentation of the Frontenac Arch Biosphere Reserve; elimination of habitat for SARA-listed species
    Community partnership grants up to $50,000 — one year only, no renewalContamination risk to rural water infrastructure; karst and aquifer vulnerability; de-icing chemical runoff into the Napanee and Salmon River watersheds; 2,196 km of OFSC snowmobile trails at risk of severance
    A future Kingston station — perhaps, eventuallyA benefit-cost ratio of approximately 0.4 against an HM Treasury minimum of 1.5; a project that cannot be financially self-sustaining and will require perpetual public subsidy across generations
    ALTO’s “corporate engagement” and “activation” in corridor communitiesExpropriation powers under Bill C-15 that override normal property rights protections; an engagement process that was run to a prescribed deadline regardless of the objections it recorded
    The Stakes

    Why tacit acceptance is dangerous — for everyone

    To be clear: this is not an accusation. If your organization has engaged with ALTO thoughtfully, or if your council has tried to extract whatever benefit it can from a project it cannot stop, that is not bad faith. That is people doing their jobs under difficult circumstances.

    But there is a real and important difference between fighting the project while negotiating its impacts and going quiet because of a small offer. One protects your community. The other protects ALTO. And ALTO’s own policy documents make clear that producing exactly that outcome — your silence in exchange for its “activation” in your community — is precisely what the programme is designed to achieve.

    Five things that happen when communities accept small offers

    It fractures community solidarity. When some organizations receive funding and others do not — a consequence built into ALTO’s own competitive assessment process — communities are divided. Those who have accepted something feel awkward opposing a project that has “done something” for them. Those who have not feel isolated. Opposition becomes fragmented and less effective.

    It manufactures consent that was never given. ALTO will report publicly that it engaged with communities. Organizations that received grants or attended “activation” events will appear in that record as participants. Whether they actually supported the project, were paid to show up, or simply had no good alternative will not appear. Your community’s name becomes evidence of buy-in that does not exist.

    It creates obligations that don’t legally exist. Informal undertakings — a trail alongside the tracks, a future station, a promise made across a meeting table — have no enforceable legal status. Even the formal partnership grants specify no multi-year commitment. Once a project achieves regulatory approval, the inducements offered during the engagement phase carry no binding force. They are not conditions of approval. They are not contractual commitments to corridor communities. They are remembered differently by different parties — and ALTO holds all the institutional memory.

    It normalizes the project in public discourse. When community organizations — councils, conservation groups, sporting and cultural associations — are seen to be engaged in “partnership” and “benefit discussions” rather than opposition, the public perception shifts. The project begins to seem inevitable. Resistance that was once principled begins to look like haggling.

    The published policy itself creates ongoing leverage. ALTO retains “the discretion to award less than the requested sum” and reserves the right to distribute funds in multiple installments. An organization that has accepted partial funding and is dependent on the remainder is not in a neutral position relative to the project it has benefited from.

    What To Do

    What communities can do

    Engagement is not the problem — silence is. There are principled, effective ways to participate in this process without letting a grant or a promise shift where you stand.

    01Oppose the project and engage with the process — both at once

    Participating in the process does not mean accepting the project. Your community can engage fully — attending meetings, asking hard questions, making demands — while making it absolutely clear, in public and on the record, that engagement is not consent. Say it out loud. Say it in writing. Say it every time.

    02If you have accepted ALTO funding, say so publicly

    There is no shame in having applied for or received a community grant. But your neighbours, your council, and the public deserve to know about it when you speak about this project. Transparency is the only thing that preserves your credibility — and it is the one thing ALTO’s programme is not designed to encourage.

    03Get every promise in writing — or treat it as no promise at all

    Trails. Land access. Future stations. If ALTO or its representatives cannot commit to it in a signed, dated document with a delivery timeline and an accountability mechanism, it does not exist. Verbal assurances made in stakeholder meetings have no legal force after project approval. None. Treat them accordingly.

    04Do the full accounting before you assess any offer

    A $30,000 conservation grant looks different alongside a benefit-cost ratio of 0.4, $60–90 billion in projected public costs, permanent agricultural land loss, and aquifer risk that no impact assessment has yet resolved. You are entitled to that full picture. Demand it. Do not evaluate small offers in isolation from large harms.

    05Know that there is a better option

    The choice is not between ALTO and nothing. High Performance Rail on the existing CN Kingston Subdivision — combined with a new freight displacement corridor along Highway 401 — delivers comparable journey times at a fraction of the cost, with dramatically lower community and environmental disruption. That alternative deserves a real assessment. Demand one.

    06Stand with other corridor communities

    The inducement strategy only works if communities act alone. Your grant, your trail, your land access promise — each one is calibrated to make your situation feel unique and your interests separable from your neighbours’. They are not. A divided corridor is ALTO’s best asset. A united one is its biggest problem.

    The Ask

    What we are asking you to do

    If your organization has been offered ALTO community partnership funding, land access, trail commitments, or any other concession — formal or informal — document it. Write down the date, the name of the person who made the offer, and exactly what was said. Then tell people about it.

    Not because you did anything wrong. Because the public deserves to know what ALTO is offering corridor communities, and why, and when. Because the difference between a project that received genuine community support and one that managed dissent with targeted grants should be visible — to your neighbours, to your elected representatives, and to anyone who asks whether eastern Ontario communities were truly consulted or simply handled.

    A trail alongside the tracks is not evidence that ALTO has taken your community seriously. A one-year grant awarded partly for “corporate visibility” is not evidence of environmental commitment. The only thing that cannot be managed, bought, or quietly withdrawn after approval is a community that spoke clearly, stayed together, and refused to let small offers substitute for large answers.

    In Closing

    What lasts is the record

    The festival sponsorship is a reminder of how quickly a partnership can be celebrated in public and then, when it draws scrutiny, quietly removed from view. What endures is not the announcement or its deletion — it is the documented record of what was offered, by whom, and when. That record is the most durable contribution any community can make.

    The ALTO HSR Citizen Research Initiative maintains a full suite of research briefs, technical analyses, and community resources at citizenresearch.ca. If your organization or institution has been offered ALTO support — a grant, a sponsorship, land access, a future station — the most useful thing you can do is document it and make it visible: to your neighbours, your council, and the public.

  • High cost, low benefit claim

    High Cost, Low Benefit — For Whom?

    An ALTO Vice-President says the rail alternative would cost about as much as high-speed rail without the benefits. The government’s own record — and ALTO’s own document — say otherwise.

    In short

    In a recent public video, an ALTO Vice-President argues that high-frequency rail would still need dedicated track, would therefore cost about as much as high-speed rail, and would deliver less — a “high cost, low benefit” option. The claim runs against the public record. The government’s own reports costed a dedicated-track high-frequency railway far below high-speed rail, and judged it buildable in a fraction of the time. What shifted that cost to “similar” has never been made public.

    On the benefit side, ALTO’s case rests on ridership the international reference class does not support. Tested against ALTO’s own document and the Initiative’s financial analysis, the high-cost option turns out to be the one being built.

    Download
    High Cost, Low Benefit — For Whom?
    The full research brief, with sources (PDF)
    Download PDF
    The Argument

    What the video claims

    The argument is a single chain. High-frequency rail, the video says, is often presented as the cheaper alternative — but it would still require new dedicated track, so its cost would rise to roughly that of high-speed rail, while delivering lower travel-time, ridership, and economic benefits. The conclusion offered to viewers is that high-frequency rail is a “high cost, low benefit” option, while high-speed rail delivers both speed and frequency.

    It is a clean story. Two problems sit beneath it before any single figure is examined.

    It claims a cost convergence the record contradicts

    The video is right that high-frequency rail needs dedicated track — it does not claim trains would share track with freight. Its claim is that building that dedicated track pushes the cost up to roughly high-speed rail’s. The government’s own reports say otherwise, on both cost and time. A dedicated-track, electrified high-frequency railway was costed at $27.7 billion in the December 2021 Business Case — and roughly $4–6 billion in its original 2016 form — and judged buildable in about four years. High-speed rail is now costed at $60–90 billion, on a build horizon stretching into the 2040s. What evidence moved high-frequency rail’s cost and schedule up to “similar” has never been explained, and no side-by-side comparison has been made public.

    It never engages the alternative the Initiative proposes

    The video treats high-frequency rail as the only alternative to high-speed rail. The Initiative’s proposal is different again: High Performance Rail (HPR) builds dedicated passenger track along existing transportation corridors — such as the CN right-of-way and the Highway 401 — and frees the Kingston Subdivision for freight. It is neither the government’s old high-frequency plan nor ALTO’s high-speed one, and ALTO has never assessed it.

    Tested Against the Record

    Three claims, three answers

    $27.7B
    what a dedicated-track high-frequency railway was costed at — against $60–90B for high-speed rail
    2021 JPO Business Case
    the cost-per-kilometre gap between ALTO and High Performance Rail in the Initiative’s model
    $142M vs $28M per km
    0.11
    ALTO’s central benefit-cost ratio — well below the 1.0 that marks a project that pays its way
    Initiative methodology paper

    The video makes three factual claims — on cost, on speed, and on benefit. Each can be checked against ALTO’s own published document and the Initiative’s analysis.

    The claim in the videoWhat the record shows
    “It would cost on a similar scale to high-speed rail.” Contradicted by the public record. The government’s own 2021 Business Case put a dedicated-track high-frequency railway at $27.7 billion, against ALTO’s $60–90 billion. Even ALTO’s own Annex B places its “conventional rail” comparator 20–30% below high-speed rail. The Initiative’s reference-class model — a regression across more than forty international projects — puts ALTO at $142M/km and HPR at $28M/km, a five-fold gap. “Similar scale” holds on none of these.
    “Without significantly faster travel times.” Conventional speed already captures most of the benefit. A 177 km/h dedicated-track service was set to cut Toronto–Ottawa from over four hours to about two hours fifty. By ALTO’s own travel-time table, going to 300 km/h saves only a further 17 minutes on Toronto–Ottawa, 19 on Ottawa–Montréal, and 25 on Montréal–Québec. Most of the time saving comes from leaving freight-priority track — not from the extra speed.
    “Lower ridership and reduced economic benefits.” The benefit case rests on ridership the reference class does not support. ALTO’s 24-million-trip target sits outside the achievable modal-shift frontier of 5–12 million annual riders. No operating posture is subsidy-free; each requires roughly $1–3.5 billion per year. The central benefit-cost ratio is about 0.11. The “high benefit” half of the slogan is the half that does not survive checking.
    A Note on the Travel Times

    Estimated, not simulated

    There is a further problem with the speed claim, separate from how small the gain is. The faster journey times were never modelled for this corridor at all. A government record released under the Access to Information Act (file A-2025-00333) shows that the project office produced a detailed RailSys simulation only for the 177 km/h base case. Every faster journey time was a spreadsheet estimate, benchmarked to average speeds on intercity railways in other countries — described in the project’s own memorandum as “for information and comparison purposes” and left to be refined later.

    In other words, the under-three-hour trips that make high-speed rail attractive have no corridor-specific engineering behind them in the released record. The one number anyone actually drove through a model of the real line is the slow one.

    Read the full record

    The Initiative examines this in detail — the two methods, the journey-time tables, and how the speed ceiling was set as a policy target — in a companion research note, Estimated, Not Simulated, based on the same Access to Information release.

    The Carbon Case

    A carbon debt, not a carbon saving

    The video folds environmental benefit into ALTO’s column, on the assumption that faster, higher-ridership rail is the greener choice. The Initiative’s 50-year lifecycle analysis finds the opposite once construction and a decarbonising vehicle fleet are counted. ALTO’s build is a large one-time carbon debt before a single passenger boards — about 14.7 Mt CO₂e in the central construction estimate — and with fifty years of operations the lifecycle total lands at roughly 24 to 27 Mt CO₂e on Ontario’s current grid, and as much as 34 Mt if the grid leans more on gas.

    That debt only counts as a saving if the trips it captures would otherwise have been higher-carbon — and the payback math is unforgiving. At the ridership the corridor is most likely to see in its early years, around 4 million passengers a year, no scenario repays the construction debt within a credible horizon. Even at mature ridership, payback runs from a few decades to more than five hundred years, depending on how clean the grid is.

    The comparison only worsens with time. By the 2040s, when ALTO might open, much of the car fleet will be electric — and an electric car carrying 1.2 people already emits about 10 g CO₂e per passenger-kilometre, below ALTO’s all-in emissions at every ridership level on today’s grid. Diverting existing VIA Rail passengers, at roughly 25 g/pkm, saves nothing at all. ALTO’s carbon case rests on displacing gasoline cars and short-haul flights — not the fleet that will actually be on the road when it opens.

    Most of that debt is greenfield construction. An approach that runs on existing corridors — as High Performance Rail does — avoids the bulk of it, and the single largest carbon lever, shifting freight off congested track, is available whatever the trains’ speed or traction.

    Why the Gap Is Real

    The cost difference is structural, not arithmetic

    The five-fold difference in the Initiative’s model is not an accounting artefact. A 300 km/h design forces a new dedicated greenfield alignment — grade separation, gentle curves, continuous fencing, and large-scale land acquisition — through terrain that scores high on both engineering complexity and community friction. Both the government’s high-frequency plan and the Initiative’s HPR instead run on or alongside existing corridors, which is why each comes in well below the high-speed option. In the Initiative’s model, the gap between high-speed rail and HPR splits roughly evenly between physical engineering and community friction — the cost of the land, the disruption, and the opposition that a new high-speed right-of-way creates.

    The Bottom Line

    High cost, low benefit — for whom?

    The video’s thesis — that high-frequency rail is high cost and low benefit while high-speed rail delivers both — is contradicted by the government’s own record. High-frequency rail was a fully studied, dedicated-track plan, priced at $27.7 billion in 2021 and a fraction of that in its original form, and due to be carrying passengers now. The decision to replace it with a 300 km/h, $60–90-billion project was taken without a published comparison; the video supplies the missing conclusion after the fact.

    On the evidence available, the high-cost option is the one that was chosen. The lower-cost alternatives — the government’s own, and the Initiative’s — were set aside without being weighed in public. That is the question the slogan invites, turned back on itself: high cost, low benefit, for whom?

    Sources

    Primary documents

    1.
    ALTO, Fast Forward: Shaping Canada’s Future with a High-Speed Rail Network (March 2025) — cost ranges, travel times, and ridership targets, main text and Annex B. altotrain.ca
    2.
    Joint Project Office High Frequency Rail Project, Business Case Update, V.002 (December 10, 2021) — dedicated-track design, $27.7 billion costing, and four-year construction estimate.
    3.
    The Globe and Mail, “Transport Canada reviewing studies on Via Rail expansion” (July 2017) — the original 2016 high-frequency concept at roughly $4–6 billion. theglobeandmail.com
    4.
    “VIA HFR-TGF Journey Times” memorandum and accompanying email chain (August–September 2023), released under the Access to Information Act as file A-2025-00333 — simulated base case versus estimated higher-speed times.
    5.
    ALTO HSR Citizen Research Initiative, ALTO Financial Analysis (methodology paper and supporting research notes) — cost-per-kilometre model, ridership frontier, subsidy spectrum, benefit-cost ratio, and lifecycle carbon. ALTO-Financial-Analysis.pdf
    6.
    ALTO HSR Citizen Research Initiative, 50-Year Lifecycle CO₂ Budget — Parametric Analysis (March 2026) — construction, operational, payback, and modal-comparison figures, drawing on HS2, UIC, and international HSR lifecycle studies.
    7.
    Statements examined: public video by an ALTO Vice-President (June 2026).
  • NPV

    Citizen Research Initiative · Financial Analysis · NPV Note 1

    NPV and BCR Projections for ALTO

    A deterministic net-present-value analysis over 2029–2080 across three capital-cost scenarios, three operating regimes, and four discount rates — thirty-six combinations, every one of them strongly negative.

    ⚠ Headline Finding

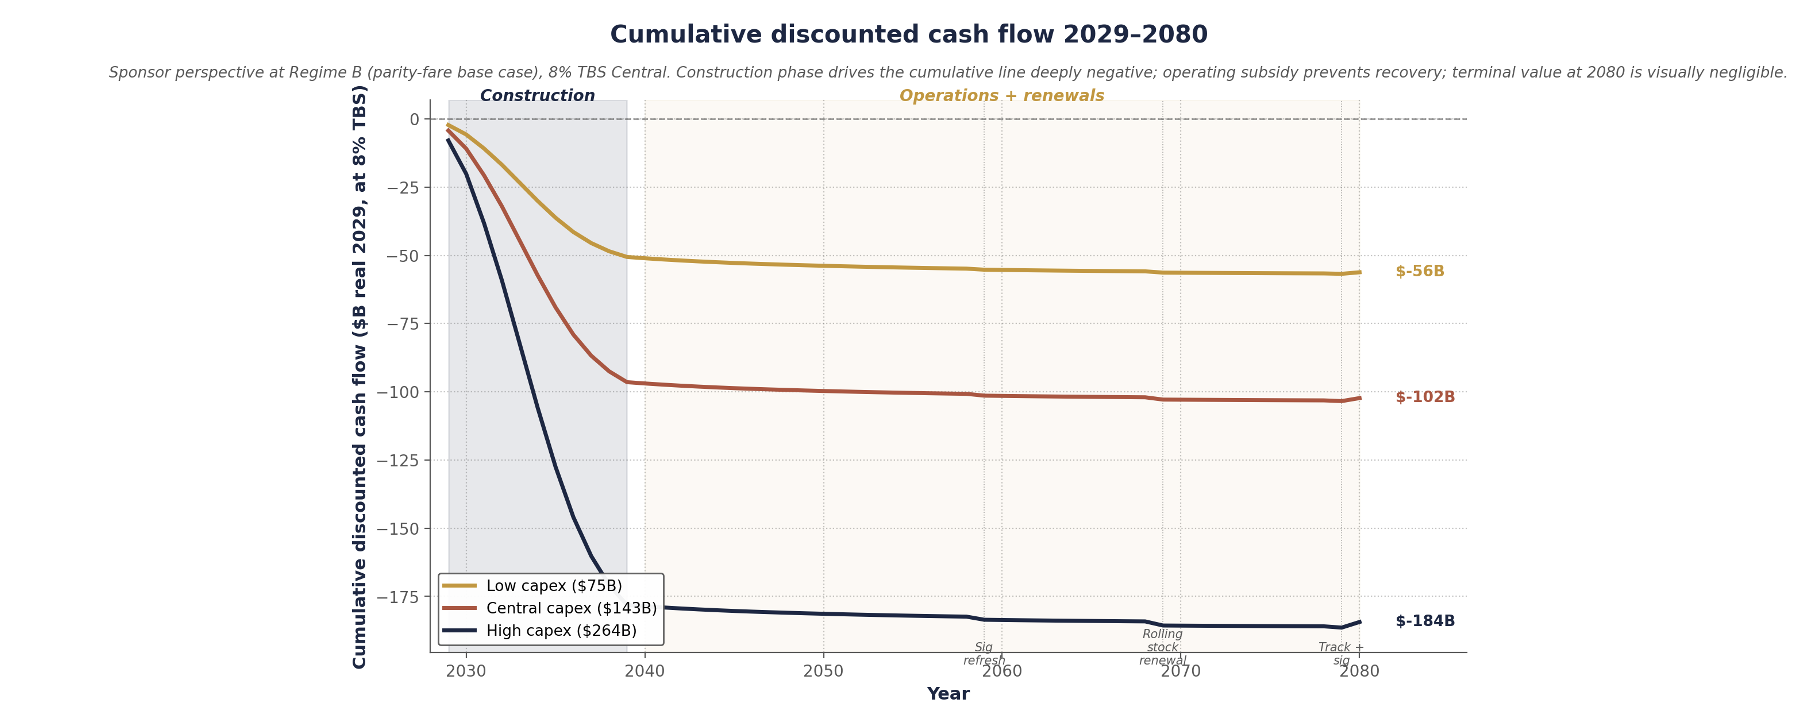
    Across 36 combinations of capital-cost scenario, operating regime, and discount rate, ALTO produces a financial NPV between −$50 billion and −$246 billion in real 2029 CAD. At the Treasury Board central 8% rate and the welfare-efficient Regime B posture, NPV is −$56B at $75B capex, −$102B at $143B, and −$184B at $264B.

    The benefit-cost ratio across the 9-cell capex×regime grid runs from 0.030 to 0.107 — every cell at least nine times below the 1.0 break-even threshold. Capital cost is the dominant driver; operating regime is second-order; the discount rate changes magnitudes but not the direction.

    Executive Summary

    This report evaluates financial and combined NPV over a 52-year horizon, integrating the engineering operating-cost build of the Cost-of-Running-the-Train work with the modal-shift subsidy frontier — a coupled analysis in which ridership, fare, operating cost, and operating subsidy are determined jointly along the corridor’s achievable frontier.

    Three capital-cost scenarios bracket the plausible range: a low case at ALTO’s published $75B (~P2.5 of the reference class), a central case at $143B (the reference-class mean under Flyvbjerg’s overrun distribution), and a high case at $264B (the P97.5). Three operating regimes from the subsidy frontier set the achievable operating points: premium (Regime C, 6.1M pax), parity-with-air (Regime B, 8.2M, the revenue peak), and deep-discount (Regime A, 11.2M, near the modal-shift ceiling).

    Cost-recovery break-even from fares alone sits at 117 trains/day, or 12.5 million annual passengers at the reference yield — above the modal-shift ceiling. All three regimes operate below it and require ongoing federal operating subsidy. The PV of that subsidy stream is structurally independent of capital cost ($4.6B at Regime C to $7.6B at Regime A at 8%). And the 24-million-by-2055 figure in ALTO’s public materials sits outside every operating point on the frontier and is not modellable under any defensible parameter combination.

    Download
    NPV Note 1 — NPV and BCR Projections for ALTO (PDF)
    The full report with all six figures and nine tables: the three capital scenarios, the three operating regimes, the four discount-rate NPV tables, the operating-subsidy stream, the economic overlay, the benefit-cost grid, and the methodology and parameter appendices
    Download PDF
    1 · Context

    What the analysis evaluates

    This report presents an NPV analysis of ALTO over 2029–2080, in real 2029 Canadian dollars from the project-sponsor perspective, with a parallel economic overlay for passenger and external benefits. The objective is a defensible quantitative basis for evaluating the project against the standard Treasury Board cost-benefit framework.

    The framework integrates two pieces of prior work. Annual operating cost is built from the lifecycle methodology of the operating-cost note — infrastructure maintenance, train operations, and fleet recapitalisation. Ridership, fare, and operating subsidy are determined jointly by the three operating regimes of the subsidy-frontier note, which establish the achievable points on the corridor’s modal-shift frontier. Capital cost is treated through reference-class forecasting, with three scenarios spanning the empirical distribution of cost outturns on comparable HSR megaprojects. Operations are assumed to commence in 2040 after an eleven-year construction period; cash flows include capex during construction, operating cost and ramped fare revenue, three lump-sum renewals at operating years 20/30/40, and a terminal residual at 2080.

    −$102B
    Financial NPV, base case ($143B capex × Regime B × 8%)
    0.030–0.107
    Benefit-cost ratio across the 9-cell grid — all ≥9× below break-even
    ~94%
    Share of the negative present value driven by capital cost alone
    2 · Capital Cost

    Three scenarios from the reference class

    Capital cost is the largest single quantity in the analysis and the dominant source of NPV uncertainty. Three scenarios span the plausible range, calibrated by reference-class forecasting on the international HSR cost database (log-normal, mulog = 4.963, sigmalog = 0.312).

    Low — $75B

    ALTO’s published figure (the centre of the $60–90B Fast Forward range). Sits at ~P2.5 of the reference class — a lower-tail estimate consistent with megaproject optimism bias. Predates the HFR→HSR scope expansion and carries no published contingency.

    Central — $143B

    The reference-class mean. Applying Flyvbjerg’s 44.7% average rail overrun to the baseline, plus ALTO’s engineering-complexity premium (composite 73–81), gives the modal outcome — the appropriate base case for procurement decisions.

    High — $264B

    The P97.5 — exceeded by ~1 HSR project in 40. Not a theoretical bound: HS2 Phase 1 (~+250%), California HSR (~+200%), and HSL-Zuid (228%) all approached it. The corridor’s geology and the Canadian P3 record make it a realistic case.

    The three scenarios are not equally probable: under the calibrated distribution, the proponent’s figure has roughly a 2.5% chance of being achieved or undercut, the central scenario is the modal outcome, and the high scenario reflects upper-tail risk. Treating $75B as the planning case would require ALTO to be delivered with cost discipline materially better than every comparable international HSR megaproject — a claim for which no evidence has been adduced.

    3 · Operating Regimes

    Three points on the achievable frontier

    The three operating regimes derive from the subsidy frontier. Each is an internally consistent point on the corridor’s achievable modal-shift frontier, with ridership, fare, revenue, and subsidy following from a single fare posture. No operating point produces high ridership at low subsidy.

    Table 2. Operating regime parameters (central 2055 demographic anchor). Operating subsidy = max(0, operating cost − fare revenue). Mature values shown; in operating years 2040–2047 ridership and revenue ramp from 50% to 100% of mature values.
    ParameterRegime C — premiumRegime B — parityRegime A — discount
    Rail-to-air fare ratio1.41.00.55
    Average fare ($/trip)$207$157$96
    Mature ridership (M pax/yr)6.18.211.2
    Modal share captured22%30%40%
    Annual fare revenue ($M)$1,260$1,290$1,080
    Annual operating cost ($M)$1,928$2,116$2,385
    Annual operating subsidy ($M)$668$826$1,305

    Regime B is the welfare-efficient point under standard cost-benefit assumptions — simultaneously the revenue-maximising point and the per-rider welfare-efficient point. A profit-maximising private operator and a welfare-maximising public authority applying marginal analysis would converge on it, even if they would disagree on whether to operate the corridor at all. Regime A, at 11.2M, approaches the modal-shift ceiling of ~12M; pushing beyond would require corridor-external policy (highway tolls, fuel pricing, aviation limits). The 24-million figure sits above the ceiling — reaching it would require doubling modal share to ~80%, far below cost recovery, and is not modellable as a financial NPV.

    4 · Operating Cost & Break-even

    Why fares can’t cover cost

    Annual operating cost follows the engineering build: $1,381M fixed (infrastructure maintenance $980M + fixed operating $221M + fleet recapitalisation annuity $180M) plus ~$26 per train-km variable, equivalent to $89.7M per million annual passengers at the 450-seat, 65% load-factor convention. Crucially, this cost is driven by service intensity, not by what the infrastructure cost to build — a $264B corridor running 80 trains/day costs essentially the same to operate as a $75B one.

    Cost recovery from fares alone, at the reference yield of $0.20/passenger-km, requires approximately 117 trains per day — 12.5 million annual passengers. That threshold sits above the modal-shift ceiling of ~12M. All three regimes operate below it and therefore require ongoing federal operating subsidy.

    Cost-recovery break-even chart: operating cost line crossing the reference-yield revenue line at 117 trains per day, with the three regime points and the modal-shift revenue curve never reaching cost recovery
    Figure 1. Cost-recovery break-even and the three operating regimes. The navy cost line is the engineering build; the dashed terracotta line is reference-yield revenue, crossing cost at 117 trains/day (12.5M pax). The solid terracotta curve is the modal-shift revenue line, Laffer-peaked at ~$1.29B near Regime B and sitting below the reference line because the framework requires sub-reference fares to capture modal share. The vertical gap between each regime’s cost square and revenue diamond is the annual operating subsidy. The modal-shift revenue curve never crosses the cost curve at any achievable ridership — cost recovery from fares alone is unreachable, even at the deep-discount Regime A.
    5 · Financial NPV

    Strongly negative across all 36 cells

    Financial NPV is strongly negative across all 36 combinations of capex scenario, operating regime, and discount rate. The base case — central capex × Regime B × 8% — is −$102.3B, of which the capital component accounts for ~94%.

    Cumulative discounted cash flow 2029-2080 under three capex scenarios, driven deeply negative during construction and flattening through operations
    Figure 2. Cumulative discounted cash flow, 2029–2080, sponsor perspective at the Regime B base case, 8% TBS Central. Construction 2029–2039 drives the cumulative line deeply negative under all three capex scenarios; operating subsidy outflows from 2040 prevent recovery, and the lines flatten toward their terminal NPV. The small dips mark the renewals at 2059/2069/2079; the terminal residual at 2080 gives a slight upward inflection. Final values are −$56B, −$102B, and −$184B at Low, Central, and High capex.
    Table 3. Financial NPV at 8% TBS Central ($B real 2029). Figures in parentheses are negative. The grid is monotonically more negative moving down (capex rising) and weakly more negative moving across (regime premium→discount), reflecting that higher ridership produces both higher operating cost and higher operating subsidy.
    Capital cost scenarioRegime CRegime BRegime A
    Low — $75B($55.4)($56.2)($58.5)
    Central — $143B($101.5)($102.3)($104.6)
    High — $264B($183.6)($184.4)($186.6)
    Present value decomposition by capex scenario: PV of capital cost dominating the negative side at every level, with operating cost identical across scenarios
    Figure 3. Present value decomposition by capex scenario, Regime B, 8% TBS Central. PV of capital cost (navy) dominates the negative side at every level, growing from $51B at Low to $178B at High. PV of operating cost (terracotta) is identical across scenarios at $11.2B — structurally decoupled from construction outturn. On the benefit side, PV of fare revenue is $5.8B and capex-independent; the economic overlay is $0.76B. Benefits cover only ~6% of total costs at the central scenario.

    The pattern holds across every discount rate. At 5% (HM Treasury Green Book) the base case is −$121.2B; at 3% (long-horizon Treasury), −$136.8B; at 10% (private-capital opportunity cost), −$92.4B. Lower rates produce more negative figures, because the cash-flow profile is dominated by front-loaded capex and operating-subsidy outflows rather than long-dated revenue. The full sensitivity tables are below.

    Tables 4–6. Financial NPV at 5%, 3%, and 10% ($B real 2029), all three with the Central×Regime B base case marked. At no defensible discount rate does NPV approach break-even.
    Discount rate & capexRegime CRegime BRegime A
    5% — Low $75B($66.8)($68.4)($72.9)
    5% — Central $143B($119.6)($121.2)($125.6)
    5% — High $264B($213.4)($215.0)($219.5)
    3% — Low $75B($77.1)($79.8)($87.2)
    3% — Central $143B($134.1)($136.8)($144.2)
    3% — High $264B($235.6)($238.2)($245.7)
    10% — Low $75B($49.7)($50.2)($51.7)
    10% — Central $143B($91.9)($92.4)($93.9)
    10% — High $264B($167.0)($167.5)($169.0)
    NPV sensitivity tornado: capital cost producing a $130 billion swing, dwarfing every other parameter
    Figure 4. NPV sensitivity tornado — parameter swings from the base case (Central capex × Regime B × 8%, NPV −$102.3B). Gold bars improve NPV, terracotta bars worsen it. Capital cost dwarfs every other input, with a $130B swing across the Low–High range. Discount rate is next. All operating-side parameters combined — operating cost, fare yield, renewals, terminal value, yield erosion, and regime choice — produce swings of at most a few billion each, more than an order of magnitude below the capex effect.
    6 · Operating Subsidy

    Decoupled from capital cost

    The PV of the operating-subsidy stream is structurally independent of capital cost under the engineering build — operating cost is driven by service intensity, not construction outturn. The same subsidy values apply at all three capex scenarios.

    Table 7. PV of operating-subsidy stream by discount rate and regime ($B real 2029, 2040–2080). Subsidy is capex-independent — identical at all three capex scenarios. Corresponding mature annual subsidies: $668M (C), $826M (B), $1,305M (A).
    Discount rateRegime CRegime BRegime A
    3% (long-horizon)$14.2$16.9$24.3
    5% (Green Book)$8.7$10.3$14.7
    8% (TBS Central)$4.6$5.4$7.6
    10% (private capital)$3.1$3.7$5.2

    The corridor would impose an ongoing federal operating contribution of roughly $700 million to $1.3 billion per year over four decades, on top of the federal share of capital service. Adding capital service (federal share 50%, 6% blended cost of capital, 40-year amortisation) of ~$2.5B/yr at Low, $4.8B at Central, and $8.8B at High, the full annual federal cost at Regime B ranges from ~$3.3B to ~$9.6B per year — a full-cost-per-rider of $405 to $1,171, five to fourteen times the federal value-of-time benefit per rider.

    Stacked annual federal cost commitment by capex scenario, combining capital service and operating subsidy, ranging from 3.3 to 9.6 billion per year
    Figure 5. Annual federal cost commitment by capex scenario, Regime B mature operations — capital service (federal share 50%, 6% blended cost of capital, 40-year amortisation) stacked with the $0.83B/yr operating subsidy. Total federal cash commitment ranges from $3.32B/yr at the proponent capex to $9.60B/yr at the upper reference-class capex. Per rider at 8.2M annual passengers, $405 to $1,171 — five to fourteen times the federal value-of-time benefit per rider. Real 2029 dollars.
    7 · Economic Overlay & BCR

    An order of magnitude below break-even

    The economic overlay adds five benefit categories (passenger time savings, modal-shift GHG, accident reduction, local externalities) and one cost (embodied construction carbon). It is small relative to the financial cash flow: even at Regime A, the largest overlay of $1.94B is ~1/50th of the central financial NPV. It does not move the directional finding.

    Table 8. Economic overlay components at 8% TBS ($B PV). The embodied-carbon debit of $2.48B is regime-invariant — it depends on corridor characteristics, not operating posture. Regime C’s total is slightly negative because passenger benefits at 6.1M pax don’t offset it.
    ComponentRegime CRegime BRegime A
    Passenger time savings$1.28$1.72$2.35
    Modal-shift GHG savings$0.10$0.14$0.19
    Embodied carbon (debit)($2.48)($2.48)($2.48)
    Accident reduction$0.88$1.18$1.61
    Local externalities$0.15$0.20$0.27
    Total economic overlay($0.07)$0.76$1.94
    Table 9. Benefit-cost ratio at 8% TBS Central. All values an order of magnitude below the 1.0 break-even threshold. Corner-to-corner range 0.030 (High×C) to 0.107 (Low×A). The capex axis explains >80% of the variation; the regime axis <20%.
    Capital cost scenarioRegime CRegime BRegime A
    Low — $75B0.0920.1060.107
    Central — $143B0.0530.0610.062
    High — $264B0.0300.0350.036

    The most favourable cell anywhere — Low capex × Regime A — requires conjoining ALTO’s own optimistic capex with the deep-discount posture that maximises ridership; neither half is publicly committed to. Under the central reference-class capex, the highest achievable BCR is 0.062, about one-sixteenth of break-even. For context, the Ontario provincial HSR study of 2016 rejected a comparable 300 km/h scope at a reported BCR of 0.70 — this analysis finds the ALTO option materially worse than the level at which Ontario rejected comparable scope a decade earlier.

    8 · The 24-Million Problem

    A target outside the frontier

    The 24-million-by-2055 figure in ALTO’s public materials sits outside the achievable frontier. The modal-shift ceiling is ~12 million annual passengers — at Regime A, capturing 40% of the addressable market. Reaching 24 million would require doubling modal share to ~80%, which means fares well below cost recovery plus structural changes to the corridor’s competitive position against car and air that go beyond any operating posture.

    ALTO public ridership target versus the modal-shift achievable frontier: the three regimes between 6 and 11 million, and the 24-million target nearly twice beyond the modal-shift ceiling
    Figure 6. ALTO’s public ridership target vs. the modal-shift achievable frontier. The three regimes (C 6.1M, B 8.2M, A 11.2M) occupy the frontier between ~5 and 12 million; the cost-recovery break-even at 12.5M sits just outside the ceiling. ALTO’s 24-million target sits ~11.5 million passengers — nearly twofold — beyond the ceiling. The gap is not bridgeable under the modal-shift framework: it would require ~80% modal share against air and road, for which there is no precedent in the international HSR record on a comparable corridor.

    The 24-million figure is therefore not a defensible operating point and is not modellable as a financial NPV under the regime framework. Public communication that pairs the 24-million target with operating-cost or subsidy figures drawn from other points on the frontier is internally inconsistent — the corridor cannot simultaneously achieve 24-million ridership and the operating subsidy of any regime on the frontier.

    9 · Conclusions

    The viability question is a capex question

    Negative across every combination

    Financial NPV ranges from −$55B to −$187B at 8%; the central case is −$102B. BCR runs 0.030–0.107 — every cell at least nine times below break-even. The probability of positive NPV under any defensible scenario is negligible.

    Capital cost dominates

    Low→High capex swings NPV by ~$130B at 8%; Regime C→A swings it by only ~$3B. The choice of operating regime is second-order once capital is committed. The first-order question is whether to commit the capital.

    Operating subsidy is decoupled

    Operating cost is driven by service intensity, not construction outturn — a corridor running 80 trains/day costs the same to operate whether built at $75B or $264B. The subsidy stream can be planned independently of the capital outturn.

    An HPR review is warranted

    The single largest lever for project economics is cost containment, and the reference class gives no basis for assuming ALTO beats it. An independent review of the High Performance Rail alternative — a lower-capex configuration delivering comparable user benefits over the same corridor — is warranted before any corridor-selection decision.

    Proceeding with ALTO at any defensible parameter combination would impose a significant net cost on Canadian public finances over the analysis horizon, even after accounting for non-financial passenger and environmental benefits. The High Performance Rail framework — 200 km/h electrified passenger rail along the Highway 401 corridor, using existing rail corridor rather than greenfield HSR construction — would not attract the same reference-class capital premium, and an independent review should compare the two on the same NPV framework, with HPR producing materially less negative NPV and materially higher BCR across every defensible parameter combination.

    The procurement and cost-control decision is by far the most consequential single decision affecting the corridor’s financial outcome. The choice of operating regime is substantive for transport policy but does not move the financial NPV by more than a few per cent. The viability question is a capex question.
    Download Full Report
    NPV Note 1 — NPV and BCR Projections for ALTO (PDF)
    Reference document with all six figures, nine tables, the full methodology, and the parameter and reference appendices
    Download PDF
    Methodology

    Framework and parameters

    The analysis is conducted from the project-sponsor perspective in real 2029 CAD over 2029–2080 (period 0 = 2029), counting direct cash flows: capex, operating cost, renewals, fare revenue, and terminal residual. Capex is allocated across 2029–2039 on an eleven-year S-curve (3% in 2029, peaking at 13% in 2034–35, tapering to 6% in 2039). Three renewals are modelled — signalling at operating year 20 (4% of capex), rolling stock at year 30 (12%), combined track-and-signalling at year 40 (8%) — and a terminal residual at 2080 of 40% of capex. Demand ramps from 50% of mature ridership in 2040 to 100% by 2047; real fare yield erodes 0.5%/yr.

    Operating cost follows the engineering build: $1,381M fixed plus $26/train-km variable (equivalently $89.7M per million annual passengers at 450 seats × 65% load factor × 1,000 km), calibrated against the California HSR 2024 Business Plan O&M model, SNCF Réseau and SNCF Voyageurs reports, ADIF AV accounts, and the UIC LICB series. Capital cost scenarios ($75B / $143B / $264B) come from Flyvbjerg reference-class forecasting on the international HSR cost database (log-normal, mulog = 4.963, sigmalog = 0.312) with corridor-specific complexity adjustments. The economic overlay uses 1.75 h saved per trip at $25/h, modal-shift GHG of 113 kt/yr at the Regime B baseline valued at $250/t, embodied construction carbon of 14.69 Mt, accident reduction at $30/pax, and local externalities at $5/pax; network and agglomeration effects are excluded. The analysis is deterministic across the 36-cell grid; a probabilistic overlay would refine the central tendency but not change the directional finding.

    Sources

    Principal sources

    1.
    Treasury Board of Canada Secretariat. Canada’s Cost-Benefit Analysis Guide for Regulatory Proposals (2022) and Policy on Cost-Benefit Analysis — social opportunity cost of capital as the central 8% discount rate.
    2.
    HM Treasury (UK). The Green Book: Central Government Guidance on Appraisal and Evaluation (2022) — the 5% reference for long-lived infrastructure. — and Boardman, Moore & Vining, “The Social Discount Rate for Canada,” Canadian Public Policy 36(3), 2010.
    3.
    Flyvbjerg, B., Holm, M.K. & Buhl, S.L. — reference-class forecasting and the rail-project cost-overrun record (mean ~44.7% overrun): JAPA 68(3), 2002; JAPA 71(2), 2005; and Megaprojects and Risk (Cambridge, 2003).
    4.
    California High-Speed Rail Authority. 2024 Business Plan: Operations and Maintenance Cost Model. — UIC Lasting Infrastructure Cost Benchmarking (LICB); ADIF AV Management Report 2022; SNCF Réseau and SNCF Voyageurs Rapport financier annuel 2024.
    5.
    Transport Canada. High-Speed Rail Initiative briefing materials, Section 08 (2025–2026). — ALTO Fast Forward (Cadence consortium, March 2025); ALTO Pre-Development Agreement (signed 19 March 2025).
    6.
    European Court of Auditors. A European high-speed rail network: not a reality but an ineffective patchwork. Special Report 19/2018.
    7.
    ALTO HSR Citizen Research Initiative companion notes: the operating-cost engineering build and the subsidy frontier on which this NPV analysis is built; and the ridership envelope and modal-shift synthesis that establish the achievable frontier.
  • Two targets

    Two Targets

    Ridership figures in ALTO’s 2025-26 Corporate Plan and current public materials, side by side.

    In current ALTO materials

    ALTO’s Corporate Plan Summary 2025-2026 to 2029-30 — the formal accountability document submitted to the Minister of Transport for Treasury Board approval, signed by the Chief Financial Officer in January 2025 — cites a Project Outcome of at least 17 million annual passenger trips by 2059, defined to include “both Alto Passenger Rail Services and Local Services.”

    ALTO’s consultation website, as of May 6, 2026, continues to host a CEO opinion piece projecting 24 million passengers annually by 2055, “fully consistent with international outcomes.” A Globe and Mail editorial citing the same source extended this to 43 million by the 2080s. altotrain.ca

    Summary

    Two ridership figures currently appear in ALTO documents. The figure listed as Project Outcome #1 in the Corporate Plan submitted for Treasury Board approval is 17 million by 2059, defined to include both Alto Passenger Rail Services and the continuation of VIA Rail’s conventional Local Services. The figure in current public-facing materials is 24 million by 2055, rising to 43 million by 2084, presented in reference to Alto.

    The 17 million figure is the same target set in the 2023 Request for Qualifications, when the project was specified as 177 km/h High Frequency Rail at an estimated capital cost of $27.7 billion. It carries forward into the current Corporate Plan, which describes the project as 300 km/h high-speed rail at a Class 4 capital cost estimate of $60–90 billion. The Corporate Plan does not record a formal revision of the figure when the specification changed.

    This brief sets out what each document says, when each figure was published, and what other publicly available evidence indicates about ridership at the corridor scale. It does not draw conclusions about which figure is the operative one. The purpose is to make the documentary record visible.

    Download
    Two Targets — Full Brief (PDF)
    Documentary record of ALTO ridership figures across 2021–2026 publications
    Download PDF
    The Setting

    Why ridership figures matter for accountability

    A megaproject’s ridership projection anchors several other figures: the revenue model, the benefit-cost ratio, the modal-shift carbon argument, and the agglomeration economic case. When a ridership projection moves, related figures move with it.

    For ALTO, two ridership figures are currently visible in the public record. They appear in different documents, communicated to different audiences. This brief sets the two figures alongside each other, with the document trail and the available comparator evidence, and identifies the questions that would resolve which figure is the operative one.

    The brief is not an assessment of either figure on the merits. It is an assemblage of what has been published, in chronological order, with the structural definitions of each figure made explicit. Readers are invited to draw their own conclusions.

    A note on dating the Corporate Plan

    The Corporate Plan Summary 2025-26 to 2029-30 carries a CFO attestation dated January 7, 2025. Several elements of its content, however, post-date that signature: it describes the February 2025 HSR announcement and Cadence selection, the March 2025 PDA execution, Stage 1 of Co-Development as having “occurred from April 2025 to July 2025,” and workforce figures “as of May 2025.” Appendix 12’s chronology ends with August 2025. The document was therefore finalised in approximately mid-2025, with the CFO attestation date preserved as the formal accountability anchor. References in this brief to the Corporate Plan should be read with that timing in mind.

    Side by Side

    The two figures, in their own words

    Both figures appear in current ALTO materials. Both are being communicated to different audiences in May 2026.

    Public Materials · May 6, 2026Corporate Plan to Treasury Board · 2025-26
    24 million by 2055, rising to 43 million by 2084

    From the Imbleau opinion piece originally published in the Toronto Star and La Presse on April 17, 2026, reposted on the consultation site as of May 6, 2026:

    “Alto’s projected 24 million passengers annually by 2055 is fully consistent with international outcomes, based on the modelling used worldwide.”

    The Globe and Mail editorial citing the same source extended this to “43 million by the 2080s, up from three million today.”

    This figure is referenced in connection with the project’s benefit-cost claims, the 1.1% GDP uplift estimate, and the 50,000-job projection.
    At least 17 million by 2059

    From the Corporate Plan Summary 2025-26 to 2029-30, Project Outcome #1, signed by the CFO January 7, 2025:

    “Significantly Increase Intercity Rail Passengers to at least 17 million by 2059 through both the new passenger rail services (NPRS Services) and Local Services through increased annual seat capacity.”

    The same figure appears in Appendix 9 (Long-term Outcomes) as: “up from 4.8 million in 2019, including both Alto Passenger Rail Services and Local Services.”

    This is the figure listed as a Project Outcome in the document submitted for Treasury Board approval.

    Three observations about the two figures, drawn from the documents themselves:

    The 17 million figure includes Local Services

    The Corporate Plan target counts “Alto Passenger Rail Services and Local Services” together. Local Services is the planning term, defined in the Corporate Plan’s glossary, for VIA Rail’s continuing conventional service in the Quebec City–Windsor corridor. The 24 million public figure, as presented, is referenced in connection with Alto. The two figures therefore measure across different scopes.

    The 17 million figure carries forward unchanged from the 2023 RFQ

    17 million by 2059 was the Project Outcome attached to the 2023 Request for Qualifications, when the project was specified as 177 km/h High Frequency Rail at an estimated capital cost of $27.7 billion. The same figure, with the same target year, appears in the Corporate Plan that describes the project as 300 km/h high-speed rail at a Class 4 cost estimate of $60–90 billion. Project Outcomes are formally established in procurement documents and are not trivially revised; the Corporate Plan does not record a revision to this figure on either the specification change or the cost-envelope change.

    The two figures use different baseline years

    The Corporate Plan cites a 4.8 million baseline from 2019 (pre-COVID). The Imbleau opinion piece cites “three million today.” VIA Rail’s 2024 Annual Report records 4.19 million corridor passengers, of which 3.34 million on Corridor East. The growth multiplier from each baseline to its corresponding target therefore differs.

    Document Trail

    When each figure was published

    The chronology below sets out the principal ALTO ridership figures in the public record, in order of publication.

    DateDocumentHeadline ridership figure
    December 2021 JPO Business Case Update v.002
    VIA / CIB internal (released via ATI, November 2025)
    405M cumulative30-year cumulative trips 2030–2059 for HFR Electric scenario, an average of approximately 13.5 million per year. BCR ~ 0.4. NPV −$21.1 billion.
    February 2023 Request for Qualifications (HFR)
    PSPC, 126 pp.
    17M by 2059The Project Outcome attached to the 177 km/h HFR specification at an approximate $27.7B capital cost. Zero operating subsidy was a parallel commitment.
    February 2025 HSR announcement
    Government of Canada
    Specification changeProject rebranded from 177 km/h HFR to 300 km/h HSR. Cadence selected as Private Developer Partner. $3.9B Co-Development Phase funding announced.
    March 2025 Fast Forward: Shaping Canada’s Future
    ALTO public document
    24M by 2055
    43M by 2084
    Stated baseline of “3 million today.” Used in subsequent ALTO public materials and consultation graphics; cited in the Globe and Mail editorial.
    CFO signature
    Jan 7, 2025
    (finalised
    mid-2025)
    Corporate Plan Summary 2025-26 to 2029-30
    Treasury Board submission
    17M by 2059Listed as Project Outcome #1. Defined to include “both Alto Passenger Rail Services and Local Services.” 4.8M (2019) baseline. CFO attestation dated January 7, 2025; document content references events through summer 2025.
    April 17, 2026 Imbleau opinion piece
    Toronto Star · La Presse · ALTO website
    24M by 2055Published one week before the consultation deadline. Described as “fully consistent with international outcomes, based on the modelling used worldwide.” Reposted on ALTO’s consultation site, where it remains as of May 6, 2026.

    The chronology has a feature worth surfacing on its own. The 24 million and 43 million figures first appear in the Fast Forward document of March 2025. The Corporate Plan, finalised in approximately mid-2025, references only the 17 million figure as a Project Outcome and does not mention, footnote, or otherwise acknowledge the higher Fast Forward figures. The April 2026 Imbleau opinion piece reverts to the 24 million figure for public-facing communications.

    In other words: since at least March 2025, the two figures have been running on parallel tracks. The lower figure has appeared in formal accountability documents (the Corporate Plan submitted for Treasury Board approval). The higher figure has appeared in public-facing communications (the Fast Forward document, the consultation website, the CEO’s opinion pieces, and external commentary citing them). Neither document has reconciled the two, and neither has stated which is the operative ridership target.

    Adjacent Disclosure

    The cost figure, in the same period

    The Imbleau opinion piece of April 17, 2026 contains the following statement on the project’s capital cost:

    “In order to finalize project cost, we need to know what is being built and where. We must choose the best alignment through consultation. Then comes detailed engineering for bridges, tunnels and the design; a 320 km/h train requires millimeter level precision.”

    The publicly cited Class 4 capital cost estimate is $60–90 billion. The Co-Development Phase funding of $3.9 billion has been approved and is being expended over fiscal years 2024-25 to 2029-30 per the Corporate Plan. The CEO’s statement above appears in the same publication on the same day as the 24 million ridership figure cited earlier in this brief.

    This brief makes no inference about the relationship between the cost statement and the ridership figures. They are presented here together because they appear in the same document and are part of the documentary record currently available to the public.

    Comparator Evidence

    Other publicly available ridership analyses for the corridor

    For context, three additional sources of corridor ridership analysis are part of the public record. Each uses a different methodology and a different scope.

    Munk School Global Economic Policy Lab (Toronto–Montréal segment only)

    The University of Toronto’s Global Economic Policy Lab published an analysis projecting 9.44 million annual passengers by year 20 and 10.45 million by year 30 on the Toronto–Montréal segment, which the GEPL identified as generating 57% of total corridor ridership. Scaled to the full corridor on the GEPL’s own segment-share assumption, this implies approximately 16–17 million by year 20. This is the only independent academic modelling exercise for the corridor that has been published with a disclosed methodology.

    JPO Business Case Update v.002 (December 2021, ATI release)

    The Joint Project Office Business Case Update released through Access to Information by the Canada Infrastructure Bank in November 2025 projects 405 million cumulative trips over 30 years (2030–2059) for the HFR Electric scenario, an average of approximately 13.5 million per year. The same document records a benefit-cost ratio of approximately 0.4 and a 30-year NPV of −$21.1 billion against a $27.7B capital cost baseline.

    VIA Rail Annual Report 2024 (current corridor baseline)

    The most recent published actual corridor ridership figure is 4,191,080 passengers in 2024, of which 3,336,057 on Corridor East (Quebec City–Toronto). The Montréal–Ottawa–Toronto segment alone carried 2,314,024 passengers. These figures were achieved with on-time performance averaging 51% for the year.

    No reconciliation between the ALTO 17 million Corporate Plan figure, the ALTO 24 million public figure, and these comparator analyses has been published.

    From the Documentary Record

    Five things visible in the public record

    Without drawing inferences about motive or intent, five observations can be made directly from the documents reviewed for this brief.

    1. The two figures have been running on parallel tracks since March 2025

    The 24 million figure was introduced in the Fast Forward document of March 2025. The Corporate Plan was finalised in approximately mid-2025; it references only the 17 million figure as a Project Outcome and does not mention or footnote the Fast Forward figures. Both figures remain in active circulation in May 2026: the 17 million figure in the Corporate Plan, the 24 million figure in the consultation website and the CEO’s April 2026 opinion piece.

    2. The two figures have different scopes

    The 17 million figure is defined as “Alto Passenger Rail Services and Local Services” combined. The 24 million figure, as presented in the Imbleau opinion piece, references Alto. The Corporate Plan does not break the 17 million figure into Alto-component and Local-Services-component shares.

    3. The 17 million figure was set under the previous specification

    17 million by 2059 was the Project Outcome attached to the 2023 RFQ for the 177 km/h HFR specification at $27.7B. The same figure carries forward into the Corporate Plan that describes the project as 300 km/h HSR at $60–90B, without a recorded revision to the target.

    4. The capital cost is also presented as a working figure

    The CEO has publicly stated that “in order to finalize project cost, we need to know what is being built and where.” The Class 4 estimate of $60–90 billion is, on this account, a working figure pending corridor selection and detailed engineering. The Co-Development Phase funding of $3.9 billion has been approved and is being expended.

    5. Independent ridership review remains unpublished

    The Parliamentary Budget Officer has not published a review of either the cost or the ridership figures. The only independent academic modelling exercise for the corridor with a disclosed methodology, the Munk School GEPL analysis, projects approximately 16–17 million for the full corridor by year 20 of operation.

    Where things stand · May 6, 2026

    Disclosure ledger

    The following items are, or are not, currently in the public record.

    Disclosed
    Corporate Plan ridership figure: 17 million by 2059, including Alto Passenger Rail Services and Local Services. Corporate Plan Summary 2025-26 to 2029-30, Project Outcome #1.
    Disclosed
    Public-facing ridership figure: 24 million by 2055, rising to 43 million by 2084. Fast Forward (March 2025); Imbleau opinion piece (April 2026); ALTO consultation website (current).
    Partial
    Definition of the 17M target. Disclosed in Appendix 9 of the Corporate Plan as including Local Services, but not surfaced in summary communications about the figure.
    Not disclosed
    Demand modelling methodology for either the 17 million or the 24 million figure. No model documentation, elasticity assumptions, modal-shift coefficients, or sensitivity analysis has been published for either figure.
    Not disclosed
    Reconciliation between the two figures. No public ALTO statement explaining the relationship between the Corporate Plan figure and the public-marketing figure, or stating which is intended to be the operative ridership target.
    Not disclosed
    The Alto-only share of the 17M target. The Corporate Plan does not break the 17 million into the share attributable to high-speed services and the share attributable to Local Services.
    Not disclosed
    Updated benefit-cost ratio for the current 300 km/h HSR specification at $60–90 billion capital cost against the 17M ridership target. The last published BCR (~0.4) was calculated against the $27.7B HFR specification.
    Not disclosed
    Door-to-door journey time projection from representative origin points, accounting for the now-likely suburban Toronto station and Tremblay Ottawa terminus. The 24M figure is presumed to assume downtown-to-downtown service that is no longer the operating reality.
    Not disclosed
    Independent demand audit results from the Parliamentary Budget Officer or comparable independent body, against either the 17M or the 24M figure.
    Download Full Brief
    Two Targets (PDF)
    Documentary record of ALTO ridership figures, with comparator analyses
    Download PDF
    Questions for the Minister and the PBO

    Six questions that would resolve the disclosure gaps

    The following questions, addressed to the Minister of Transport and to the Parliamentary Budget Officer, would surface the items currently undisclosed.

    Question 1 “Which is ALTO’s operative ridership target: the 17 million by 2059 figure in the Corporate Plan submitted for Treasury Board approval, or the 24 million by 2055 figure in the Corporation’s consultation materials and the CEO’s opinion pieces?”
    Question 2 “Will ALTO publish a breakdown of the 17 million Project Outcome figure into the share attributable to Alto Passenger Rail Services and the share attributable to Local Services?”
    Question 3 “Will ALTO publish the demand modelling methodology, elasticity assumptions, modal-shift coefficients, and sensitivity ranges underpinning both the 17 million and the 24 million figures?”
    Question 4 “What is the updated benefit-cost ratio for the current 300 km/h high-speed rail specification at the Class 4 capital cost estimate of $60–90 billion, calculated against the 17 million Treasury Board ridership target?”
    Question 5 “Has the Parliamentary Budget Officer been asked to review the ridership and cost figures underpinning ALTO’s benefit-cost case, and if so, what is the expected timeline for publication of that review?”
    Question 6 “Given the Corporation’s acknowledgment that ‘in order to finalize project cost, we need to know what is being built and where,’ what is the formal status of the $60–90 billion capital cost figure relative to the $3.9 billion in Co-Development Phase funding already committed?”
    Sources

    Primary documents

    1.
    VIA HFR–VIA TGF Inc. (Alto), “Corporate Plan Summary 2025-2026 to 2029-30,” submitted to the Minister of Transport for Treasury Board approval, signed by the Chief Financial Officer January 7, 2025. Project Outcome #1 (Executive Summary, Appendix 2, Appendix 9, Appendix 13).
    2.
    Martin Imbleau, “High-speed rail is not a leap of faith: Why it matters for Canada’s growth,” opinion piece published Toronto Star and La Presse, April 17, 2026; reposted on ALTO consultation website. altotrain.ca (retrieved May 6, 2026)
    3.
    ALTO, “Fast Forward: Shaping Canada’s Future with a High-Speed Rail Network,” explanatory document, March 2025.
    4.
    Public Services and Procurement Canada, “Request for Qualifications — High Frequency Rail Project (RFQ No. T8128-210188/C),” February 17, 2023. Project Outcomes including 17M ridership by 2059 and zero operating subsidy. 126 pages.
    5.
    VIA Rail Canada / Canada Infrastructure Bank, “JPO Business Case Update v.002,” December 2021. Released through Access to Information by CIB, November 2025. Source for 405M cumulative trips, BCR ~0.4, and 30-year NPV of −$21.1B for HFR Electric option.
    6.
    VIA Rail Canada, “Annual Report 2024,” published 2025. 2024 actual corridor ridership: 4,191,080 passengers; Corridor East subtotal: 3,336,057; Montréal–Ottawa–Toronto segment: 2,314,024.
    7.
    The Globe and Mail, editorial referencing ALTO ridership projections: “projected ridership numbers – 24 million trips annually, in the 2050s, rising to 43 million by the 2080s, up from three million today.”
    8.
    Munk School of Global Affairs and Public Policy, University of Toronto, Global Economic Policy Lab analysis of Toronto–Montréal HSR ridership: 9.44 million by year 20; 10.45 million by year 30 on Toronto–Montréal segment (57% of corridor).