Tag: Canada Infrastructure Bank

  • A straighter line

    A Straighter Line

    Three ways to connect the same cities — and what the government’s own yardstick says about each.

    ⚠ Companion to “Sixth in North America”

    The 2020 ministerial briefing released under A-2022-005 contains two yardsticks the federal government chose for itself: slide 2.5, a checklist of where high-speed rail works best, and slide 2.6, a benchmark table of selected HSR systems. This brief runs ALTO’s eight proposed stations through both — then tests two other ways of connecting the same anchor cities. Read the companion brief →

    The finding in brief

    On the government’s own benchmark, ALTO as planned is the longest corridor and the least demand-dense of any system in the briefing — about 14,600 people per kilometre of new track, below every benchmarked line that reports a population.

    Straightening the Toronto–Montreal spine helps only a little. The real lever is dropping the two stations that sit on no existing line, and reaching Ottawa and Quebec City on upgraded track rather than new build. Do that and the new build falls to a 540 km High Performance Passenger Rail (HPPR) spine — about 40 per cent less new track than ALTO — while demand density on new build climbs by roughly two-thirds, to mid-pack above Spain, without losing a single anchor city.

    The Yardsticks

    Two tests, chosen by the government

    Slide 2.5 lists what makes high-speed rail work: large metropolitan populations, strong local transit, an optimal corridor length between economic centres, and dense city pairs.
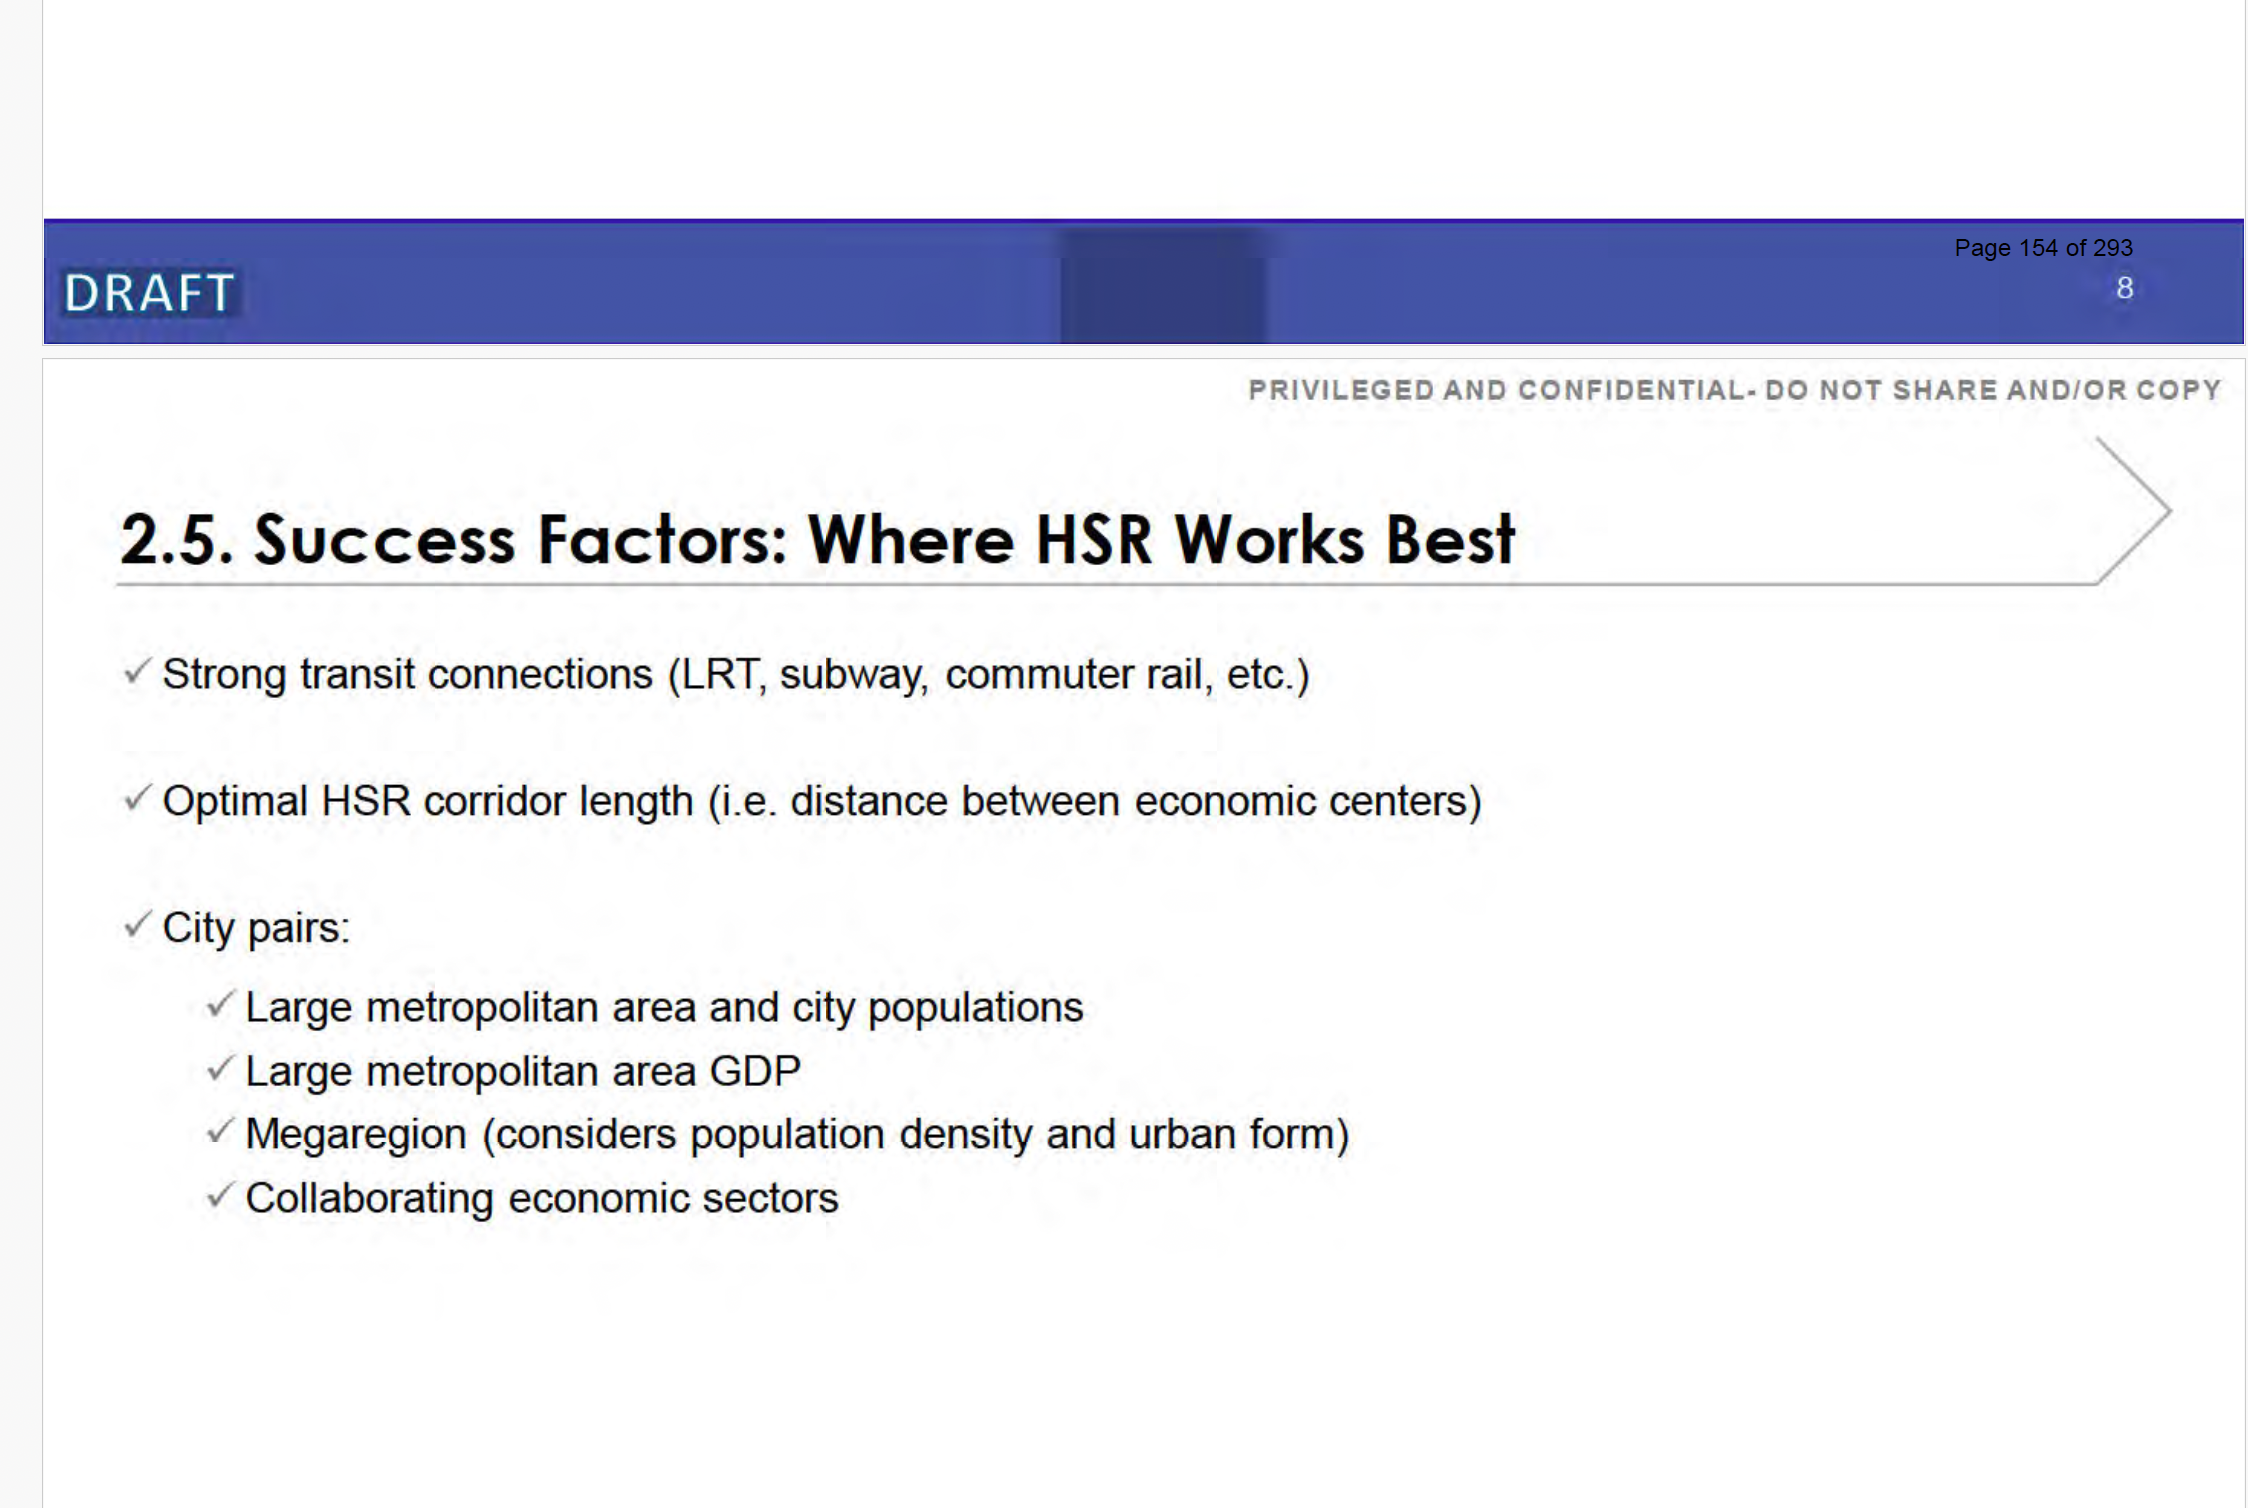
    Ministerial briefing slide 2.5, Success Factors: Where HSR Works Best, listing strong transit connections, optimal corridor length, and city-pair criteria including metropolitan population, GDP, density and collaborating economic sectors
    Slide 2.5, “Success Factors: Where HSR Works Best.” Page 154 of the Canada Infrastructure Bank release, A-2022-005 (disclosed in part; marked DRAFT) — the federal checklist of where high-speed rail succeeds.

    Slide 2.6 then benchmarks selected systems on capital cost, length, and the combined population they serve. Together the two let us score any route on the government’s own criteria — not ours.
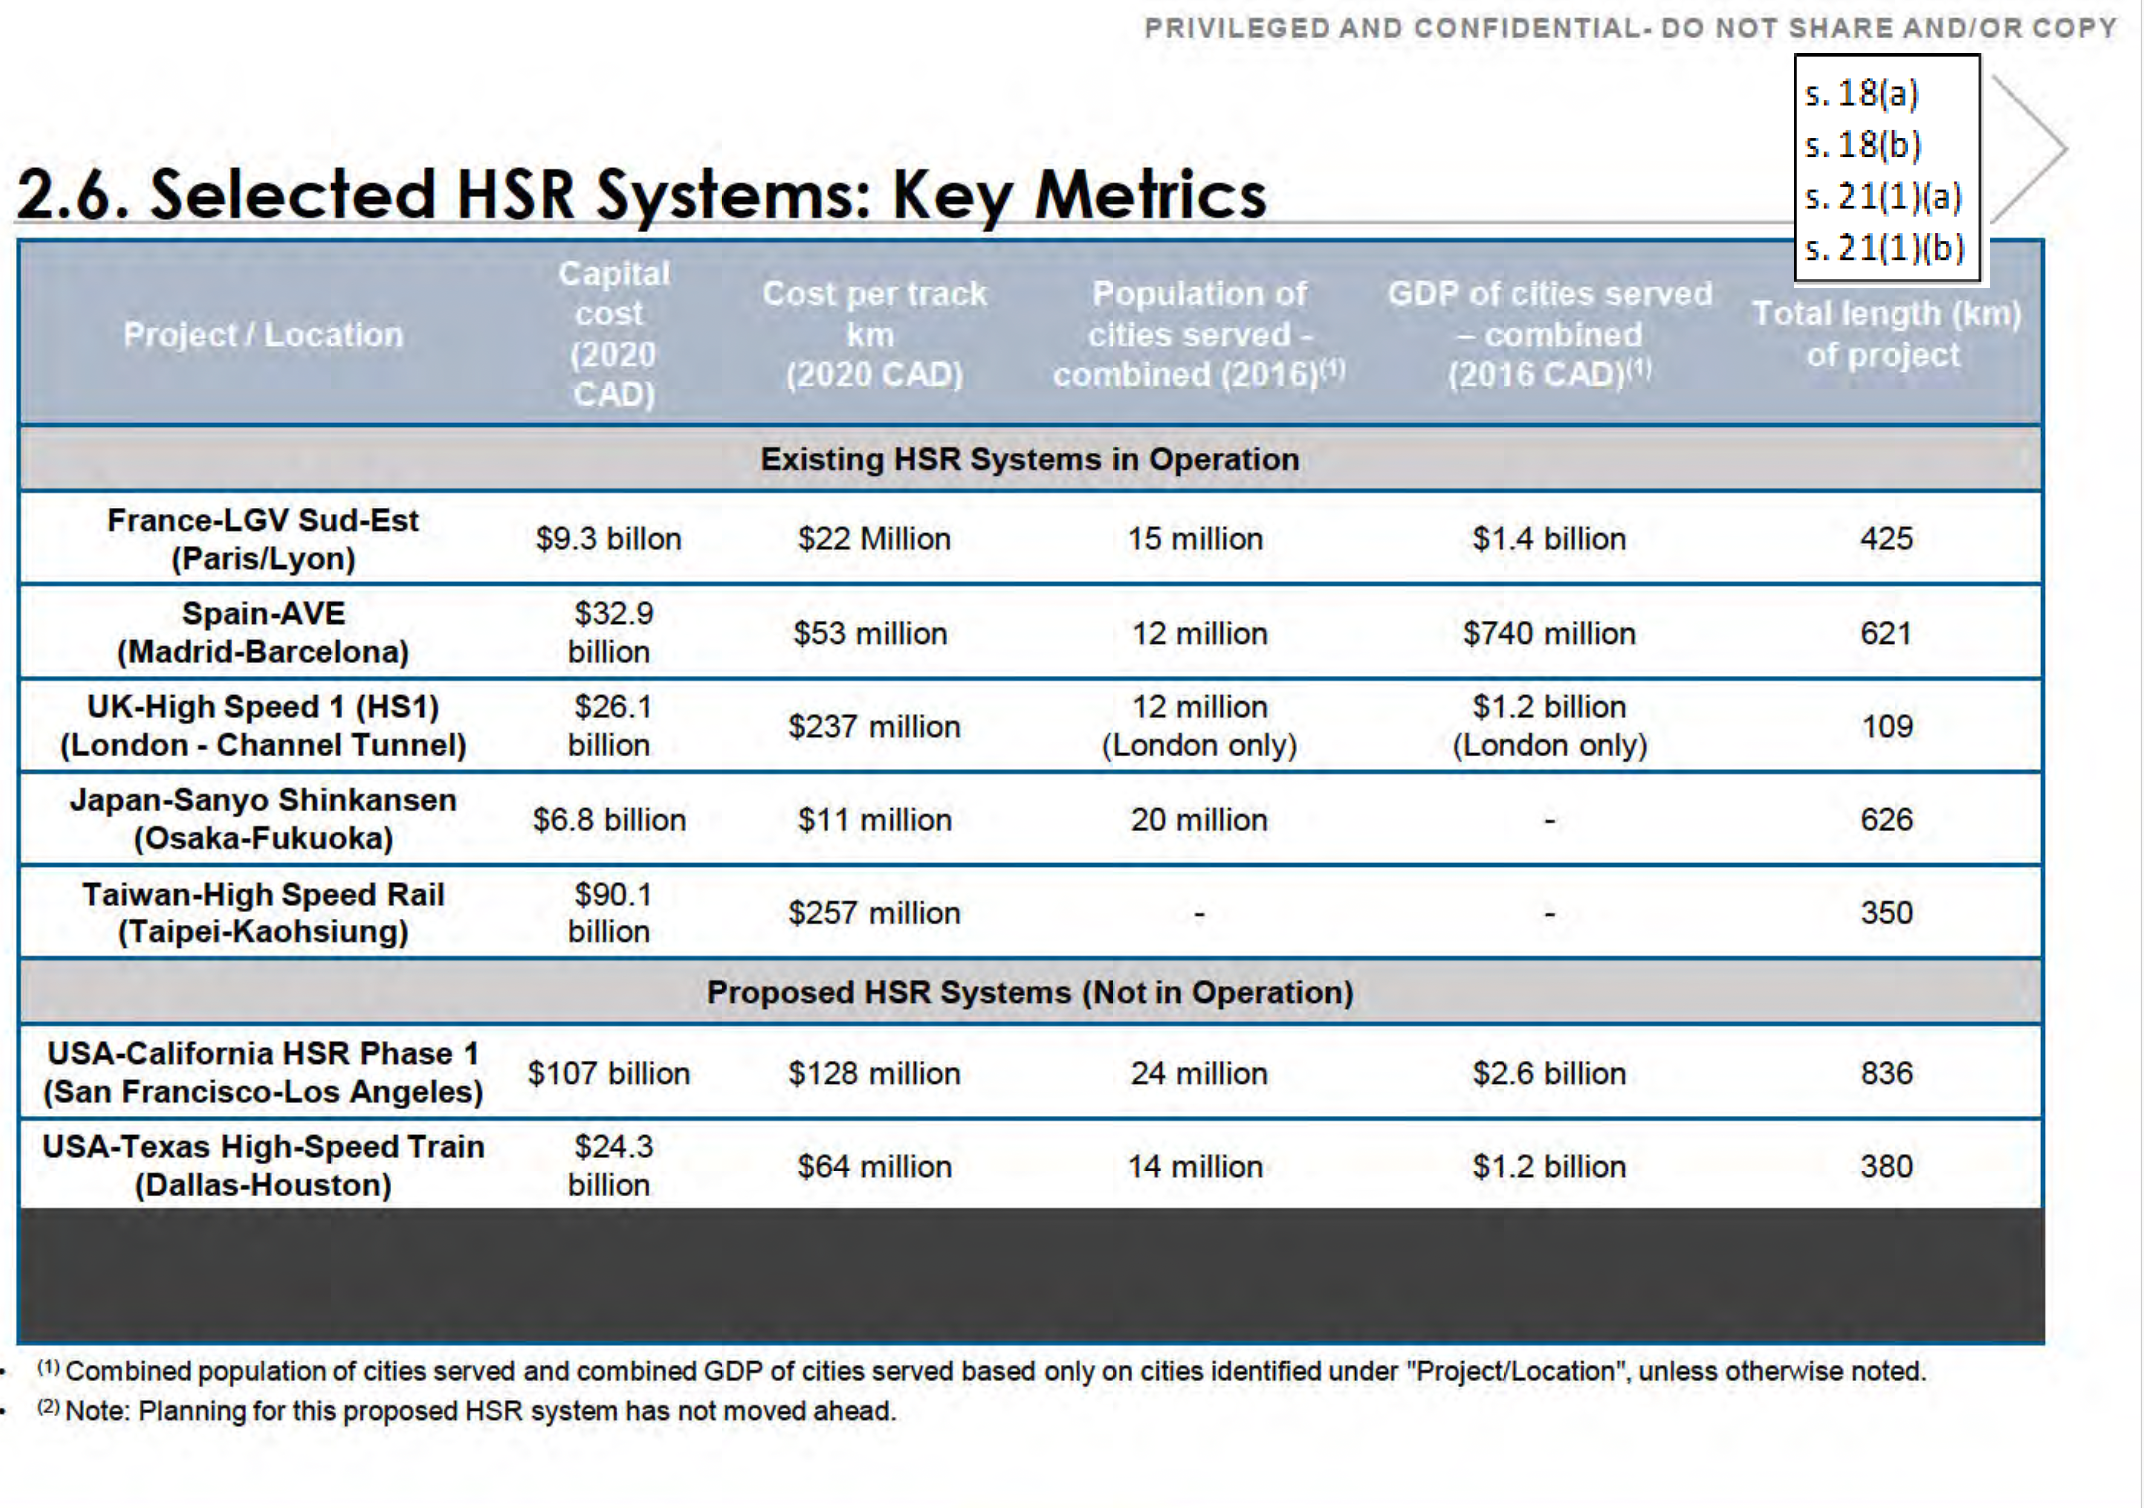
    Ministerial briefing slide 2.6, Selected HSR Systems: Key Metrics, a table of capital cost, cost per track-kilometre, population served, GDP and total length for seven HSR systems including France, Spain, the UK, Japan, Taiwan, California and Texas
    Slide 2.6, “Selected HSR Systems: Key Metrics,” from the same release (A-2022-005, disclosed in part; marked DRAFT) — the benchmark systems against which the corridor is measured below.

    Run ALTO’s eight stations through slide 2.5 and they sort cleanly into three tiers:

    Anchors — pass outright

    Toronto, Montreal, Ottawa, Quebec City: large metros with real or near-real rapid transit, at HSR-friendly distances. These are the cities the corridor exists to connect.

    Good intermediate — earns its place

    Kingston: small, but it sits on the direct Toronto–Montreal path, so it adds riders without adding distance. The methodology rewards exactly this.

    Weak — cost without a base

    Peterborough and Trois-Rivières are small and sit on no existing passenger line; reaching either means building all-new track. Laval is redundant — it is inside the Montréal CMA.

    The Ladder

    Three ways to connect the same anchors

    Hold the four anchor cities constant and change only how they are linked. Option ① is ALTO as planned. Options ② and ③ are the High Performance Rail (HPR) alternative: a new-build HPPR spine — the High Performance Passenger Rail line — on the direct Toronto–Montreal lakeshore, plus upgraded existing track for the secondary connections. ② keeps all eight stations, reaching Ottawa on the existing line and the small cities by new spur; ③ keeps Kingston on the spine, reaches Ottawa and Quebec City on upgraded existing lines, and drops the two off-corridor cities.

    Metric① ALTO as planned② Direct HPPR spine + spurs (keep all 8)③ Direct HPPR spine + Ottawa link (drop 2)
    Stations886
    Toronto–Montreal routing~650 km (detour via Peterborough/Ottawa)~540 km direct lakeshore (HPPR spine)~540 km direct lakeshore (HPPR spine)
    Ottawa connectionon the new mainlineupgraded existing (Smiths Falls–Brockville)upgraded existing (Smiths Falls–Brockville)
    Montreal–Quebec City legnew build (north shore, via Trois-Rivières)new build (north shore, via Trois-Rivières)upgraded existing (south-shore VIA line)
    New-build track~910 km~850 km~540 km
    Upgraded existing track~80 km~350 km
    People served~13.3 M~13.3 M~13.0 M
    Demand density, new-build track~14,600 / km~15,600 / km~24,100 / km
    Position on the slide 2.6 benchmarklastbelow Spainmid-pack (above Spain)
    Off-corridor cities needing new trackPeterborough, Trois-RivièresPeterborough, Trois-Rivièresnone

    The Montreal–Quebec City leg is the pivot between ② and ③: ② builds it as new north-shore track to keep Trois-Rivières on the line, while ③ drops Trois-Rivières and serves Quebec City on the existing south-shore line, upgraded — about 260 km of the gap in new build between the two. In both ② and ③ the Ottawa connection is upgraded existing track (VIA’s Smiths Falls–Brockville line), not new build. Distances are approximate planning-level estimates; full workings with live formulas are in the reference-class workbook.

    What the Numbers Say

    Reading the ladder

    ① ALTO is the longest, least-dense option

    At roughly 14,600 people per kilometre of new track, ALTO sits below every system on slide 2.6 that reports a population — the most track for the least demand per kilometre.

    ② Straightening the spine helps only a little

    Keep all eight cities but run Toronto–Montreal direct on the HPPR spine and reach Ottawa on the existing line: new build falls to ~850 km (from ALTO’s ~910) and density edges up to ~15,600 per kilometre. Better — but still near the bottom of the benchmark, because it keeps building new track for Peterborough and the north-shore line to Trois-Rivières. The off-corridor cities, not the spine, are what hold it down.

    ③ Dropping the two off-corridor cities is the lever

    Removing Peterborough and Trois-Rivières — and reaching Ottawa and Quebec City on upgraded existing track — cuts new build to just the 540 km HPPR spine, about 40 per cent less than ALTO, while losing fewer than 0.3 million people. Most of the saving is the Quebec leg: with Trois-Rivières gone, Montreal–Quebec reverts from ~260 km of new north-shore track to the existing south-shore line, upgraded. Demand density on new build climbs from ~14,600 to ~24,100 per kilometre — from worst on the benchmark to mid-pack, above Spain. The route gets stronger by building less, because the dropped legs were costing more length than they were adding demand.

    The Kingston Test

    Same city, opposite effect

    Kingston is the cleanest illustration, because every option serves it. On the direct line it sits on the shortest Toronto–Montreal path, so it adds riders at almost no added distance — density goes up. On ALTO, reaching the same city means a southern dogleg off the northern route — the same population bought with extra kilometres, so density goes down. One stop, two outcomes, set entirely by the alignment rather than the city. Keeping Kingston while dropping Peterborough is precisely the discrimination the federal criteria imply: reward the intermediate that sits on the path, decline the one that pulls the line off it.

    In plain language

    The problem was never which cities to serve. It is the line drawn to reach them. Run the strong Toronto–Montreal market on the direct lakeshore route, branch to Ottawa, serve Quebec City on the line that already exists, and keep Kingston where it naturally sits — and the corridor moves from worst on the government’s own benchmark to the middle of the pack, on far less new track.

    The two stations that drag it down, Peterborough and Trois-Rivières, are the two that sit on no existing line and would each need new track built to reach them. Serving them may be a worthy regional goal — but it should be argued and costed as that, openly, not folded into a national corridor whose headline case rests on Toronto–Montreal.

    Method

    How this was scored

    “People served” is the combined metropolitan population of the named cities — a scale proxy, not modelled ridership, and the same crude basis slide 2.6 uses. Demand density is people per kilometre of new-build track. The alternative configurations are High Performance Rail (HPR): a new-build HPPR spine on the direct Toronto–Montreal lakeshore, plus upgraded existing lines for the Ottawa connection (VIA’s Smiths Falls–Brockville route) and, in ③, the Montreal–Quebec leg. ALTO and both alternatives are high-performance (≤200 km/h), not the 300 km/h HSR of the slide 2.6 benchmark systems, so the density comparison is conservative. Distances are approximate planning-level estimates and should be checked against ALTO’s published alignment before any figure is cited. Populations are 2021 StatCan census-metropolitan-area figures; slide 2.6 is on a 2016 basis. Trois-Rivières has had no passenger rail since 1990 and is not on VIA’s south-shore Montréal–Québec line, so serving it requires all-new track. Full workings, with live formulas, are in the reference-class workbook.
  • Sixth in NA

    Sixth in North America

    What the ranking actually measures — and the route it does not describe.

    ⚠ Source: Disclosed under the Access to Information Act

    The slide below is page 206 of a 294-page record released by the Canada Infrastructure Bank under access request A-2022-005 — a request for all studies, analyses, and reports related to the federal government’s high-frequency and high-speed rail file, disclosed in part. The briefing deck it belongs to is stamped “Privileged and Confidential — Do Not Share and/or Copy,” and its own footer marks it “DRAFT.” Adjacent pages were withheld under the Act’s economic-interest and advice exemptions (s. 18 and s. 21). The deck, as disclosed, is posted in full here: Ministerial Briefing — HFR and HSR (PDF).

    The marking is part of the point: this is a draft analysis the department preferred not be seen, and it is the evidence being used to vouch for the corridor.

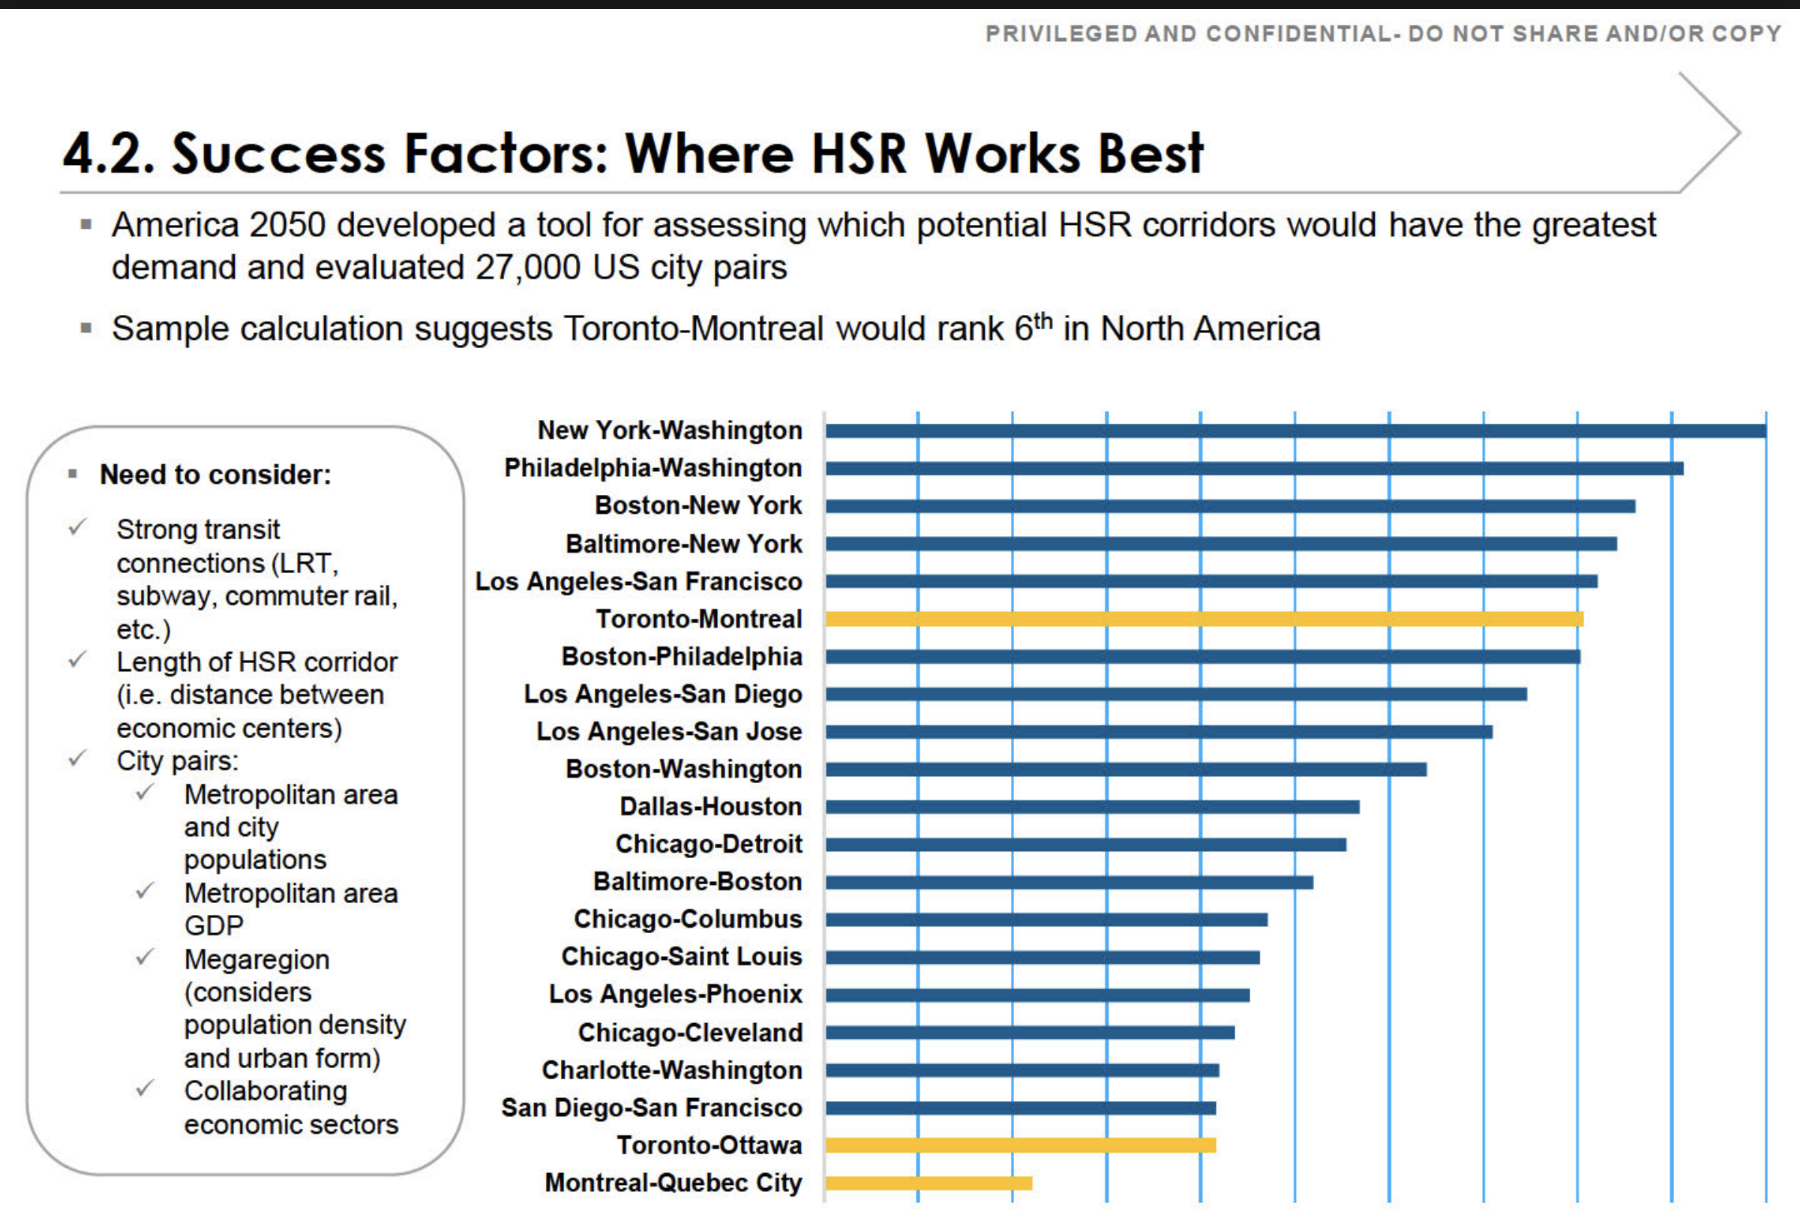
    Briefing slide: Success Factors, Where HSR Works Best, ranking North American city pairs by high-speed rail demand
    Section 4.2, “Success Factors: Where HSR Works Best.” Page 206 of the Canada Infrastructure Bank release, A-2022-005 (disclosed in part; marked DRAFT). The three highlighted bars are Toronto–Montreal, Toronto–Ottawa, and Montreal–Quebec City.
    The finding in brief

    The slide ranks Toronto–Montreal sixth among North American city pairs for high-speed rail demand. The ranking is real. What it measures is the market between two endpoint metros — not the route now being built.

    The number describes the direct Toronto–Montreal corridor. The alignment taking shape runs Toronto–Peterborough–Kingston–Ottawa–Montreal — a longer, meandering route. On the very methodology the slide cites, every one of those detours lowers the score rather than raising it. And the segment actually proceeding first, Ottawa–Montreal, does not appear on the chart at all.

    The Methodology

    What the ranking measures

    The “sixth in North America” figure comes from America 2050’s screen of tens of thousands of city pairs, a methodology published in full by the Regional Plan Association. It scores the market between two endpoint metros: downtown employment, population density, transit reach, and the existing air and road travel between them. On those inputs Toronto–Montreal scores well. The endpoints are large, dense, and already heavily travelled.

    Two features of that method decide everything that follows, and both are explicit in the source.

    It is calculated per mile. Adding distance without adding a major generator pulls a corridor’s score down, not up. The screen normalizes precisely so that longer routes cannot coast on length.

    Intermediate stations only help when they are themselves large. The report is clear that longer corridors out-rank shorter ones only when the cities in between are medium or large generators. Otherwise the additional miles are a penalty. The top-ranked corridor on the chart, New York–Washington, scores as it does because the dense intermediate cities of Philadelphia and Baltimore sit directly on the shortest path between the endpoints.

    The Route

    The corridor on the chart is not the corridor being built

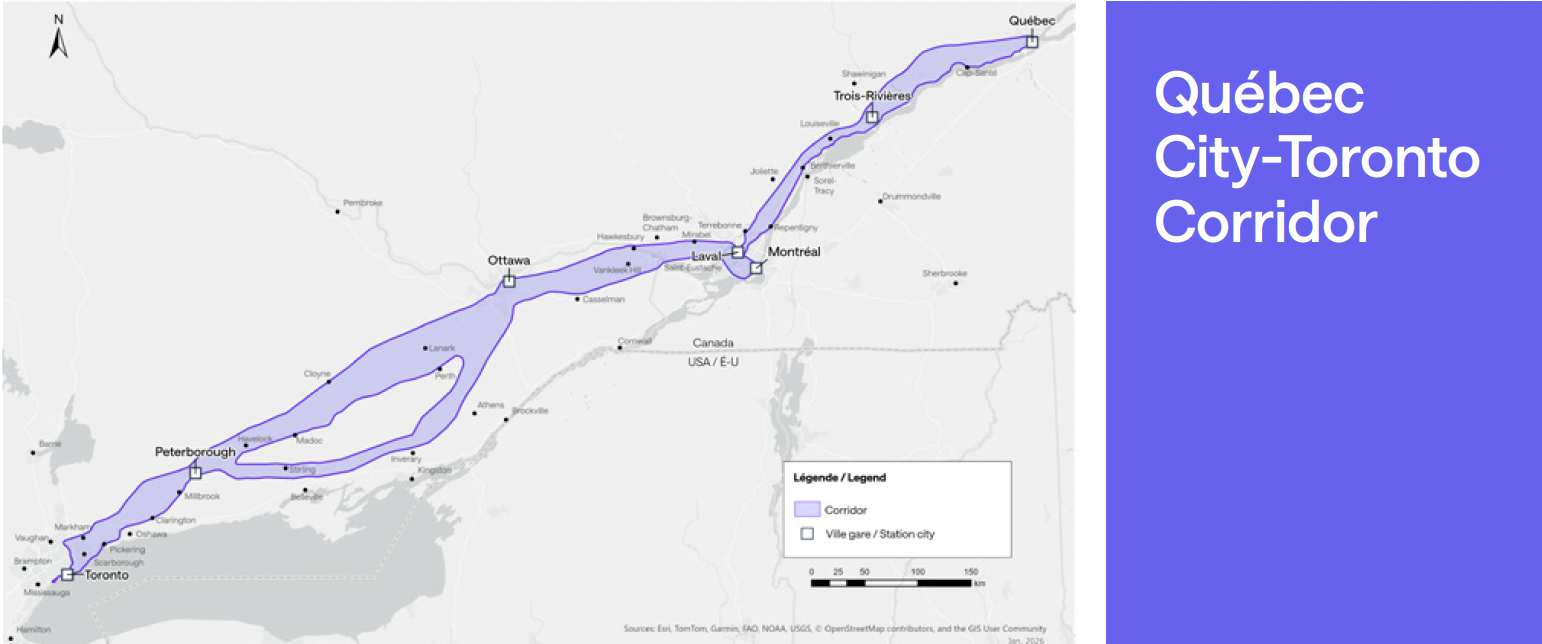
    The favourable score belongs to the direct Toronto–Montreal market — the existing lakeshore line, the shortest path, with a dense string of intermediate communities along it. The alignment now taking shape is the opposite of that. From Toronto it runs north to Peterborough; then — assuming the Kingston stop and southern routing the federal government added to its consideration in June 2026 come to pass — it doubles back south to Kingston, climbs north again to Ottawa, and drops south once more to Montreal. The result is a corridor that zigzags between its cities rather than running directly between its endpoints.

    Map of the projected Toronto to Quebec City corridor showing the route meandering north and south between cities rather than following a direct line
    The projected Toronto–Quebec City corridor. Rather than following the direct lakeshore line, the alignment meanders — north to Peterborough, south to Kingston, north to Ottawa, south to Montreal, and on toward Quebec City.
    The direct corridor (what the bar scores)The alignment being built
    Toronto–Montreal, direct. The existing Lake Ontario lakeshore line, on the order of 540 km — the shortest path between the two endpoints. Toronto–Peterborough–Kingston–Ottawa–Montreal. Roughly 610 km via Ottawa — about 13 per cent longer for the identical endpoints, and longer still with a Kingston dogleg. (This path assumes the Kingston stop and southern routing added to federal consideration in June 2026 proceed.)
    Dense intermediate string. Oshawa, Cobourg, Belleville, Kingston — population and employment added steadily along the path. Sparse flanks, weak axis. Peterborough is small and the stretches on either side of it are thinly populated; reaching Ottawa means importing the Toronto–Ottawa axis the same chart ranks near the bottom.
    Highest possible per-mile score for these two endpoints. A lower per-mile score: more kilometres, less density per kilometre, and a low-scoring leg folded in.

    There is a particular irony in Kingston. It is the natural intermediate city on the direct corridor — precisely the stop that would have helped the Toronto–Montreal score. The chosen alignment runs north to bypass it. Now it is being considered for re-inclusion, bolted back onto a route designed to avoid it.

    On the Method’s Own Terms

    What each detour does to the score

    Re-run the published methodology on the alignment actually on the table, and the per-mile score falls below the sixth-place bar. Each of the route’s defining choices works against it:

    Length is a straight penalty

    Per-mile normalization spreads the same Toronto and Montreal endpoint demand over more kilometres. A longer, more circuitous route scores lower for the identical endpoints — that is what the normalization is designed to do.

    Peterborough adds miles faster than density

    Intermediate stops only lift the score if they add population and employment per kilometre faster than the corridor’s average. Peterborough is too small, and the stretches on either side are sparse, so it adds length faster than it adds riders — a net penalty.

    A Kingston dogleg is more of the same

    Re-adding the one city the alignment was routed to avoid means a southern detour off the northern line: a modest generator bought with extra kilometres — again, length outpacing density.

    Reaching Ottawa imports a weak leg

    Ottawa is the one genuine generator among the added stops. But reaching it is the Toronto–Ottawa axis the same chart already ranks near the bottom of its field. The detour swaps the strong direct Toronto–Montreal axis for a leg the deck itself scores as weak.

    Sequencing

    What is actually being built first

    There is a further mismatch between the headline number and the build. The first segment to proceed is not Toronto–Montreal at all — it is Ottawa–Montreal, confirmed in December 2025 as the opening phase, with construction targeted for 2029. Ottawa–Montreal does not appear anywhere on the chart.

    And by the government’s own account, it was chosen first not for demand but for buildability: a relatively short and straight portion of the overall route, since high-speed trains do not handle curves well — the same logic that led California to build its first section across the flat Central Valley, avoiding tunnelling and urban construction. A constructability rationale, not a ridership one.

    The corridor that scores sixth, Toronto–Montreal, is only realized once the full line is complete — including the Toronto–Ottawa leg that sits near the bottom of this very chart — work not expected to finish until the 2040s. So the headline ranking and the actual build diverge twice over: the number describes a market the first segment does not deliver, assembled from legs the chart scores unevenly, with the strongest part of the case deferred to last.

    In plain language

    Strip away the methodology and the point is simple. The federal government’s own briefing says high-speed rail makes the most sense between Toronto and Montreal — two large cities with heavy travel between them. It says nothing in favour of the winding route now being built.

    That route keeps collecting stops the demand evidence does not support: north to Peterborough, a proposed southern dogleg to Kingston, and Trois-Rivières on the Quebec leg. Each one adds distance and cost while the case for the line still rests on the direct Toronto–Montreal market. When stations are added that do not earn their place on the numbers, the usual explanation is political — spreading the visible benefits of a marquee project across as many communities as possible to assemble support for it.

    This is one of the central problems with the project, and it is a familiar one. Bent Flyvbjerg’s research on megaprojects — the body of work behind this Initiative’s reference-class approach — finds that large infrastructure projects routinely run over budget and under-deliver because their scope and routing are shaped by political bargaining and the need to sell the project, rather than by the demand evidence. A corridor designed around who gets a station rather than where the riders are is precisely the pattern that research warns about.

    In Summary

    What the slide does and does not say

    The “sixth in North America” finding endorses a Toronto–Montreal market. It says nothing in favour of the Peterborough-routed, Kingston-doglegged, Ottawa-and-Montreal-served alignment. On the methodology’s own terms, those inclusions are exactly the choices it would mark down.

    A strong endpoint market is a real asset. It is not the same thing as a strong route — and a briefing that uses the first to vouch for the second is measuring the wrong thing. That the slide is marked “DRAFT,” and that adjacent pages were withheld under the Act’s economic-interest and advice exemptions, only sharpens the question: this is the analysis on the record, and on its own terms it does not say what it is being used to say.

    A note on method. The deck describes its result as a “sample calculation.” The disclosed page does not show how the path was drawn or scored. The standard America 2050 methodology and the headline result both point to the direct corridor as the basis for the sixth-place figure; if the underlying calculation is obtained, the path it used is the detail to confirm.

    Anticipated Objection

    “Doesn’t the line serve all those city pairs — Toronto–Ottawa, Ottawa–Montreal, Montreal–Quebec — not just Toronto–Montreal? Combine them and the project makes sense.”

    It is true that a corridor serves a whole matrix of city pairs, not only its endpoints. But that observation concedes the point rather than answering it. The “sixth in North America” figure is the score for the direct Toronto–Montreal pair. The moment the case leans on Toronto–Ottawa, Ottawa–Quebec, and Toronto–Quebec, it is no longer resting on that figure — and those are precisely the legs the same chart rates weakest: Toronto–Ottawa sits second from the bottom, Montreal–Quebec City is last, and Ottawa–Quebec, Toronto–Quebec, and Ottawa–Montreal do not appear on it at all.

    Two things make “combine the figures” fail on the slide’s own terms. The bars are demand-strength rankings — built from population, GDP, density, and corridor length — not passenger counts that can be summed; a sixth-place pair plus a near-last pair does not add up to a stronger corridor. And because the screen normalizes per mile, stringing the one strong pair onto a longer, detouring alignment spreads the same demand across more track-kilometres, which lowers the score rather than raising it.

    The logic in fact argues for the line this brief describes. If the goal is to capture Toronto–Montreal and the markets in between, the alignment that does it best is the direct lakeshore corridor — it serves the sixth-place pair at full strength and threads a dense string of real intermediate cities (Oshawa, Cobourg, Belleville, Kingston) on the way. Adding up the pairs does not rescue the meandering route; it makes the case for the direct one.

    Sources

    Primary documents and statements

    1.
    Canada Infrastructure Bank, completed access-to-information release A-2022-005 (disclosed in part), “Success Factors: Where HSR Works Best,” draft briefing slide, page 206. Released under the Access to Information Act; deck marked “Privileged and Confidential — Do Not Share and/or Copy” and “DRAFT.” View the disclosed deck (PDF)
    2.
    America 2050 / Regional Plan Association, High-Speed Rail in America, January 2011 — the published methodology scoring rail corridors by ridership demand on a per-mile basis.
    3.
    America 2050, Where High-Speed Rail Works Best — the precursor study of city pairs that the briefing slide reproduces.
    4.
    Transport Canada / Alto, “Full speed ahead: Ottawa–Montreal chosen as starting point for Alto High-Speed Rail,” December 12, 2025. canada.ca · altotrain.ca
    5.
    “First segment of Canadian high-speed rail to be built between Montreal, Ottawa,” Trains, December 12, 2025 — carries the Minister of Transport’s rationale for selecting the segment as a short, straight portion of the route. trains.com
    6.
    “Ottawa-Montreal chosen as 1st segment of promised high-speed rail line,” CBC News, December 12, 2025 — remaining segments (Quebec City–Montreal and Ottawa–Toronto) to begin at a later, unspecified date. CBC News
    7.
    Federal government statement, June 22, 2026, indicating an additional stop at Kingston would be considered for the corridor.
    8.
    Bent Flyvbjerg, Nils Bruzelius & Werner Rothengatter, Megaprojects and Risk: An Anatomy of Ambition (Cambridge University Press, 2003); Flyvbjerg, “Survival of the Unfittest: Why the Worst Infrastructure Gets Built — and What We Can Do About It,” Oxford Review of Economic Policy 25, no. 3 (2009): 344–367; and Flyvbjerg, “Design by Deception: The Politics of Megaproject Approval,” Harvard Design Magazine no. 22 (2005) — on strategic misrepresentation, perverse incentives, and the political shaping of megaproject scope and routing.
  • Land Value Capture

    The $12 Billion That Isn’t There

    What the land value capture line in the McGill TRAM financial model actually rests on — and why a number doing the heaviest lifting in ALTO’s only public financial model is a planning placeholder, not a financing prospect.

    ⚠ What This Brief Examines

    The McGill TRAM financial model assumes that land value capture — the public capture of property-value uplift around new stations — will contribute $12 billion toward ALTO’s capital cost, reducing the amount that must be borrowed from roughly $53 billion to $41.23 billion.

    This brief traces that figure to its origin, tests it against the international precedents the model invokes, against the realised Canadian record, against the legal authorities ALTO actually holds, and against the timing of when capture revenue could plausibly arrive. On every test, the $12 billion comes apart.

    Headline Finding

    The $12 billion land value capture line is reverse-engineered from a 15-percent rule of thumb, not built from any property analysis. It contains no parcel-level valuation, no station-area market study, no comparable transactions, and no discounted cash flow.

    A defensible figure for the present value of plausible station-area capture is in the low single billions — well under 5 percent of capital cost — and it accrues over decades rather than during the construction window when borrowing must actually be priced. The line is the difference between a model that reads as “tolerable on paper” and one that reads as “permanently subsidised.”

    Download
    Land Value Capture — Assessing the $12 Billion Claim (PDF)
    Full research note for federal decision-makers, parliamentarians, journalists, and residents along the corridor
    Download Note
    Section 1 · Origin of the Figure

    A percentage, not a forecast

    The $12 billion originates in the McGill TRAM financial analysis, where it is described as land and real estate development gains “equivalent to roughly 15 percent of the total cost.” Fifteen percent of the assumed $79.8 billion capital cost is $12 billion. The ratio is asserted; the dollar figure follows arithmetically.

    That is the whole of its derivation. The report contains no parcel-level valuation, no station-area market analysis, no comparable transaction work, no discounted cash flow of expected development revenues, and no sensitivity analysis. Change the cost assumption and the “capture” number moves with it — without any change to the underlying property economics, because there are no underlying property economics in the figure to begin with.

    The line is also structurally load-bearing. Remove it and the borrowed principal rises from $41.23 billion to roughly $53 billion. At the model’s own 8 percent rate over 50 years, that adds about $1.05 billion a year in debt service. The companion brief concedes the consequence directly: its “No LVC” scenario requires average annual subsidies of $2.12 billion and never reaches self-sufficiency by Year 50.

    15%
    Rule-of-thumb ratio applied to capital cost — the figure’s entire basis
    $12B
    The resulting line — with no property analysis behind it
    $53B
    Borrowed principal without the line, up from $41.23B
    Section 2 · The Precedents

    The international examples do not transfer

    The TRAM brief grounds its capture case on three precedents — Hong Kong’s West Kowloon, an Australian East Coast HSR pre-feasibility study, and California’s High-Speed Rail. None is institutionally analogous to the ALTO corridor.

    Hong Kong West Kowloon

    The only case with realised capture at scale: a single super-prime tower site sold for HK$42.2 billion. But Hong Kong’s land is overwhelmingly state-owned under a colonial leasehold system, and the government grants development rights as a primary fiscal instrument. It bears no resemblance to Peterborough, Trois-Rivières, Laval, or even Ottawa-Gatineau.

    Australia East Coast HSR

    The cited evidence is a 2022 preliminary investigation with a near three-fold range ($43–126 billion), for a project that remains unbuilt. Citing an aspirational range from an unconstructed project as proof that ALTO can capture $12 billion is circular reasoning.

    California HSR

    Cited for proposed tax-increment financing concepts. After fifteen-plus years and over $13 billion of spending, California HSR has captured essentially zero, while costs escalated from $33 billion to over $128 billion. It is a cautionary precedent, not a supporting one.

    Two precedents the brief omits are more directly relevant. The UK’s HS2 explicitly considered capture and recovered a negligible fraction of capital cost — property values along the route fell on construction blight, and the government spent more on compensation than it recouped. Brightline in Florida, the closest North-American analogue with vertically integrated real-estate interests, is in distress on its Private Activity Bonds despite favourable conditions: no winter operations, sustained population growth, and no expropriation politics.

    The most relevant evidence is Canadian — and it comes from a source the federal government itself supports. A 2023 study by the University of Toronto’s Infrastructure Institute, prepared for and supported by the Canada Infrastructure Bank, surveyed the realised Canadian record:

    • Per-deal ceiling: realised Canadian capture deals — joint development and surplus land sales — have typically raised $30 million to $110 million, with only the largest sales in the most expensive markets exceeding that band.
    • Corridor analogue: Montréal’s REM, the closest comparable, raised a $512 million station-area contribution — covering just 7.4 percent of the project’s $6.9 billion cost, itself well below a 2014 estimate of up to 35 percent.
    • Single station: Vancouver’s Capstan Station, described as having near-ideal conditions for capture, raised only $32 million over nine years.
    • The Hong Kong verdict: the same CIB-supported study attributes West Kowloon’s success to a combination of factors unique to Hong Kong, and concludes the model is fundamentally different from most capture models.

    A CIB-supported source thus reaches the same conclusion this note does: the marquee precedent does not transfer, and realised Canadian capture operates two to three orders of magnitude below the $12 billion line.

    Section 3 · Canadian Institutional Constraints

    The authorities required do not exist

    Capture at the scale TRAM assumes requires legal authorities ALTO does not have and that no level of government has proposed. Property and land use are provincial jurisdiction. Municipal zoning, development charges, and the property tax base lie outside federal control. There is no Canadian equivalent of U.S. tax-increment financing as a station-area capture tool, and Ontario’s closest analogue — Section 37 / community benefits charges — generates modest, parcel-by-parcel sums and has been further constrained by recent provincial reform.

    A structural obstacle compounds the jurisdictional one. The same CIB-supported study identifies fragmented land ownership as a core constraint: unlike Hong Kong’s state leasehold system, prime station-adjacent land in Canada is held by many separate owners. ALTO’s catchments — especially built-out central areas like Toronto Union and Montréal Central — are precisely this kind of fragmented holding, where capturing uplift at scale would first require slow, costly, politically fraught land assembly.

    The brief’s recommendation that government “empower Alto to lead development and value capture within 2 km around the stations” implies development authority over roughly 88 km² of station catchment — about 12.6 km² around each of seven stations. No mechanism in Bill C-15, the Cadence consortium structure, or any published ALTO document contemplates this. The Bill C-15 expropriation provisions are scoped to the right-of-way, not to station catchments; acquiring 88 km² would be a separate expropriation programme of significant scale, with compensation costs the model never nets against the $12 billion gross.

    On the procurement record

    Housing and TOD intent does exist in the procurement. A federal housing and TOD presentation to bidders — released under access to information — sets out a four-pillar housing strategy and contemplates that Canada would acquire project lands and explore station-hub development with the developer partner. That intent carried forward into the ALTO procurement, which required a high-speed rail proposal from all bidders.

    But the presentation is explicitly provisional throughout: “provisional guidelines,” requirements “to be refined,” an affordable-housing threshold “to be determined.” It attaches no budget, no land-assembly cost, no carrying-cost provision, and no capture-revenue target — and it describes a federal-acquisition-then-explore model that is the opposite of ALTO-led capture across catchments. The procurement confirms an intention to pursue TOD; it does not supply the costed mechanism on which the $12 billion depends.

    Section 4 · Station-Level Realism Check

    Even a generous bottom-up envelope falls short

    The TRAM model is corridor-wide and does not allocate the $12 billion to specific stations. Spread across the seven announced stations, it implies an average of roughly $1.7 billion per station. A station-by-station review of catchment characteristics shows how implausible that is — most of the corridor’s stations serve small markets or are already built out, so most uplift would accrue to existing landowners rather than to a public capture programme.

    Already built out

    Toronto:$1.0–2.0B — incremental only

    Montréal:$1.0–2.0B — incremental only

    Note:Most uplift to existing owners

    Small / thin markets

    Ptbrgh:$0.1–0.3B — CMA ~90k

    T-Rivières:$0.1–0.3B — CMA ~85k

    Québec:$0.3–0.8B — heritage limits

    Suburban / uncertain

    Ottawa:$0.5–1.5B — core receding

    Laval:$0.3–0.8B — greenfield TOD

    Total:$3.3–7.7B gross envelope

    Summed, a generous corridor-wide envelope — gross, undiscounted, spread over 20–30 years — reaches $3.3 to $7.7 billion. Even its upper bound falls short of the $12 billion the model requires. And that envelope still assumes full institutional empowerment of ALTO as a development corporation, which is not on the table, while ignoring both the carrying cost of land assembly and the compensation cost of catchment-area expropriation.

    Section 5 · The Timing Mismatch

    Most of the value, in present terms, is fictional

    The model treats $12 billion as available during construction, to reduce the principal borrowed. In practice, capture accrues over decades. Land sales and development gains around new stations typically materialise five to fifteen years after a station opens, and construction on the full corridor is projected to take well over a decade. A realistic capture stream would produce most of its value between roughly 2040 and 2060 — long after the borrowing is priced.

    Discounted at the model’s own 8 percent rate, $12 billion realised over Years 15–35 has a present value of only about $3 to $4 billion at financial close. That is the figure that can actually reduce the borrowing requirement. The remaining $8 to $9 billion in the arithmetic is, in present-value terms, fictional — and the construction debt still has to be priced against the full undiscounted principal.

    $12B
    Gross, undiscounted — as the model treats it
    $3–4B
    Present value at financial close, at the model’s own 8% rate
    $8–9B
    The remainder — fictional in present-value terms
    Section 6 · Why It Matters

    One line, three improvements, all of them collapse

    The $12 billion capture line is the single most important — and least scrutinised — financing assumption in the only publicly available financial model for ALTO. It does three things at once, and all three depend on the same unsupported number.

    1

    It cuts the borrowed capital

    From roughly $53 billion to $41 billion — the difference being the $12 billion the model assumes capture will supply.

    2

    It pulls self-sufficiency forward

    From “never” to Year 48. Without the capture line, the companion brief’s own “No LVC” scenario never reaches self-sufficiency by Year 50.

    3

    It lowers the annual subsidy

    From $2.12 billion to $1.23 billion a year on average — the gap between “tolerable on paper” and “permanently subsidised.”

    Professor El-Geneidy has said publicly that the model uses “very generous” assumptions, particularly on demand, and that breakeven “can happen … but it requires a lot of work from the government to make it happen.” The capture assumption falls into the same category. Even on its own optimistic terms, the model shows cumulative subsidies of $61.6 billion through Year 50, on top of the initial $26.6 billion federal investment — a combined taxpayer exposure of $88.2 billion before any recovery from project revenues.

    Where Things Stand

    A placeholder, not a pillar

    The $12 billion figure should be treated as a planning placeholder rather than a financing prospect. Any business case, public communication, or appraisal that relies on it as a stable revenue pillar is overstating ALTO’s financial position by an order of magnitude — at the present-value point that matters most, the moment construction debt is priced. The defensible number is in the low single billions, it arrives over decades, and it cannot be borrowed against today.

    Download Full Note
    Land Value Capture — Assessing the $12 Billion Claim (PDF)
    Reference note for federal decision-makers, parliamentarians, journalists, and residents along the corridor
    Download Note
    Sources

    References

    1.
    Zhang, B., Negm, H., & El-Geneidy, A. (2025). High-Speed Rail in Canada: Insights from a corridor-wide survey and a financial analysis. Transportation Research at McGill, McGill University. Updated January 2026. Source of the $79.8 billion capital cost, the 15-percent capture ratio, and the $41.23 billion borrowed-principal figure.
    2.
    El-Geneidy, A., et al. (December 2025). Importance of Land Value Capture regarding the Canada High-Speed Rail. Transportation Research at McGill, McGill University. Source of the “No LVC” scenario and the $2.12 billion average annual subsidy.
    3.
    Pettit, C., Thackway, W., & Wade, R. (2022). High Speed Rail Value Uplift Preliminary Investigation Report. City Futures Research Centre, UNSW Sydney. The Australian East Coast HSR pre-feasibility range.
    4.
    On the UK case see HM Treasury, Oakervee Review of HS2 (2020); on Brightline see filings under SEC EDGAR for Brightline Holdings LLC and reporting in Bond Buyer through 2025–2026.
    5.
    Siemiatycki, M., Fagan, D., & Arku, R. N. (April 2023). Land Value Capture Study: Paying for Transit-Oriented Communities. Infrastructure Institute, School of Cities, University of Toronto. Supported by the Canada Infrastructure Bank. Source of the $30–110 million per-deal range, the REM 7.4-percent figure, the Capstan Station case, and the fragmented-ownership finding.
    6.
    Infrastructure Canada (April 10, 2024). Housing and Transit-Oriented Development (TOD) — High Frequency Rail (HFR) Project, Subject-Specific Meeting #4B. Government of Canada. Released under the Access to Information Act, file A-2025-00223.
    7.
    El-Geneidy quoted in Canadian Affairs, “The high cost of high-speed rail” (January 9, 2026; corrected February 27, 2026).