Coalition for Better Rail · Research Brief · The HPR Framework
What is HPR?
An alternative built around the journey people actually take — not the top speed on the brochure.
Chapter 1 · The HPR Framework · Coalition for Better Rail
High-Performance Rail (HPR) is an integrated framework for modernising passenger and freight rail along an existing transportation corridor. Rather than a single greenfield high-speed line, HPR treats the corridor as one system to be optimised as a whole: a new-build passenger spine where new track earns its place, upgrades to existing infrastructure where they deliver more per dollar, and freight capacity improvements that let passenger and freight services each run to their own business model. It is designed to compete on total door-to-door travel time, to reach city centres and the communities in between, and to be delivered in affordable, demonstrable stages.
Download
What is HPR? — Chapter 1 (PDF)
The HPR framework in full: the three-part structure, the ten principles, and the case for a made-in-Canada alternative to greenfield high-speed rail
HPR is not a single thing but a whole-system approach with two working halves. The framework combines a passenger spine and a freight dimension into one corridor strategy, appraised together and delivered incrementally — so each mode can grow to its own business model rather than being forced onto the other’s infrastructure.
HPR — High-Performance Rail · the framework
The whole-system approach. HPR combines the passenger spine and the freight dimension into one corridor strategy, appraised together and delivered incrementally.
HPPR — High-Performance Passenger Rail · the spine
The physical passenger railway: new-build and grade-separated where the corridor requires it, engineered for reliable operation at speeds up to 240 km/h (150 mph), serving downtowns and the communities along the route.
HPFR — High-Performance Freight Rail · the freight dimension
The capacity that untangles freight from passenger obligations. Freed from passenger scheduling, freight can run to a more flexible timetable and operate longer trains — the levers that drive a lower operating ratio — so each mode grows without subordinating the other on shared track.
The Ten Principles
What HPR is built on
01
Holistic optimization. Treat the rail network as a single system to be optimised as a whole, respecting the disparate business models of freight and passenger operations rather than forcing one onto the other’s infrastructure. Avoid projects that monopolize funding, starving the many smaller improvements that would together deliver more.
02
A community railway. Build a railway that benefits the communities along the route, with the potential to deliver genuine, long-term prosperity to the places it passes — integrating them rather than alienating them, and so reducing community friction, political risk and ultimately cost.
03
Untangle freight from passenger. Build the capacity to separate freight from passenger obligations, so each can run to its own service pattern without one subordinating the other.
04
Fast enough. Target typical speeds in the 180–240 km/h band — fast enough to compete door-to-door without the greenfield-only alignments that higher speeds demand. A 240 km/h maximum is also the safer option in extreme temperatures (±30 °C).
05
Safe, comfortable and productive. Deliver a journey a car or plane cannot: grade separation and modern rolling stock make rail among the safest ways to travel, while generous space lets passengers work, rest or connect en route. Time on the train is usable time — a decisive advantage over driving.
06
Frequent and punctual. Compete on turn-up-and-go frequency and dependable punctuality — an on-time performance (OTP) above 90%, sustained through Canadian winters. Reliability, not peak speed, is what earns a traveller’s trust.
07
Downtown access and corridor communities. Prioritise city-centre access and serve the communities along the route, not only the endpoint city-pairs.
08
New-build plus upgrades. Combine new construction with upgrades to existing rail infrastructure, using each where it delivers the most value.
09
Mixed service on shared track. Allow regional, commuter and intercity services to operate over the same tracks, with freed freight capacity as a deliberate co-benefit.
10
Incremental investment strategy. Deliver in stages and invest where benefits are demonstrable — phasing improvements so each tranche earns its place, and avoiding the cost and risk concentration of a single megaproject.
How HPR Differs
A North American solution
The defining difference is what the railway is optimised for. A design that chases 300-plus km/h commits, almost by necessity, to a new greenfield alignment — long straight sections, wide curve radii and bypasses that route around the very communities and city centres a passenger service exists to reach, with speed on the open track bought back in access time, capital and carbon. HPR inverts that priority: by accepting typical speeds in the 180–240 km/h range it can follow the existing corridor, upgrade what already works where prudent, reach downtowns directly, all while liberating capacity for freight — competitive door-to-door at a fraction of the capital exposure, in stages that can be re-scoped as evidence matures.
It is also a difference of provenance. A greenfield high-speed line is essentially an imported experiment — the French passenger-rail model, built for a temperate, densely settled geography and a network that carries no freight. Established North American railroading is the opposite: freight-dominated, shared-track, and tested by hard winters and long distances. HPR is engineered for that reality — made in Canada, for Canadian conditions. It fosters domestic technology transferable to subsequent Canadian projects rather than transplanted from France, and is best understood not as a slower high-speed railway but as a different answer for a distinctly different continent: how to move the most people and freight, to the most useful places, at car-competitive prices, for the most defensible investment with the lowest possible risk.
Travel Time, Not Speed
The clock, not the speedometer
A journey is not a single dash between two stations; it is a chain — reaching the station, waiting for the departure, the run itself, and getting to the final destination at the far end. Top speed touches only one link in that chain. Once access, waiting and egress are counted, the line-haul run is a fraction of the door-to-door total, and shaving it delivers steeply diminishing returns: the gap between 240 and 300 km/h saves minutes on the segment that is already the smallest part of the trip.
Worse, the alignments that permit the highest speeds tend to push stations out of city centres, adding access and egress time that can outweigh whatever the faster run saved — so a train that is quicker on paper can be slower in practice. Frequency compounds the point: a train leaving soon beats a faster one you must wait an hour to board.
The measure that matters
Measured the way travellers actually experience it — and against the car, which over a corridor drive of some 540 kilometres is the real competitor — the figure that matters is the reliable door-to-door clock, not the number on the fastest stretch of track.
The Price Lever
Pricing for a car-centric market
In a car-centric culture, the railway’s real competitor is not the airplane or the existing train but the private car — and against a car already owned, a trip is judged on its perceived marginal cost. That makes price the most direct lever on whether people switch. A line built at megaproject cost must recover that capital somewhere, and fares set to service debt price discretionary travellers straight back into their cars, hollowing out the very ridership the business case assumed. HPR’s lower capital cost is therefore not only a fiscal virtue but a demand strategy: a railway that costs less to build can price to fill trains rather than to service debt. Frequency, downtown access and reliable door-to-door times create the conditions for mode shift; price is what converts them into boardings — and where most trips default to the car, that fare is often the difference between a full train and an empty one.
What HPR Is Not
Neither political, nor all at once
HPR is not a political project. Its route, its staging and its scope follow the evidence — engineering, economics and demographics — not political convenience or partisan preference. Where a claim cannot be grounded in that evidence, it is not made.
Nor is it everything at once. Stage 1 — the scope of the current report — is deliberately bounded: it does not detour via Peterborough, it reaches Ottawa over upgraded existing lines rather than costly new-build, and it defers Québec City to a later stage. Each further stage is added only when the evidence and the need justify it.
The Pitch
A case built to be checked
HPR does not ask to be believed; it asks to be checked. Every figure in its case is meant to be traced to a source, tested against what comparable projects actually cost and carried, and stated with its uncertainty rather than its best case. Where a promotional business case leads with a single confident number, HPR leads with a range and the reference class behind it — because the honest way to forecast a railway is from the record of railways already built, not from the hopes, ambitions and bias of the proponents hoping to build it.
The result is a stronger case, not a softer one. HPR delivers a passenger spine that beats the car on door-to-door time at a fraction of the capital a greenfield high-speed line demands; freight capacity that lifts the operating ratio instead of fighting passengers for slots; benefits that arrive in stages, each proven before the next is committed; and an environmental and cost profile that improves, rather than worsens, once the whole life of the asset is counted. It needs no optimistic ridership and no heroic cost control, and no slick advertorials to stand up. That is the pitch: not the fastest railway that can be drawn, but the one that will be built, used, and pay its way — the case that survives the scrutiny the alternative cannot.
ALTO’s benefits page, set against independent estimates for the corridor — and against the cost figure it never states.
ALTO HSR Citizen Research Initiative · Economic Brief · Published July 2026 · ALTO consultation closed April 24, 2026
⚠ What the page does not say
ALTO’s “Discover Alto’s Many Benefits” page presents at least nine distinct benefit figures — GDP, jobs, tourism, road decongestion, emissions avoided, and annual ridership. It states no capital cost, no operating subsidy, and no benefit-cost ratio anywhere on the page. ALTO benefits page
Every figure on the page is a numerator. The one number that would let a reader judge whether the benefits are worth the spending — the cost of the project — appears nowhere on it.
Critical Finding
The page is built on a single asymmetry: benefits are presented gross, and the cost side is absent. Restore the denominator and the picture inverts. On ALTO’s own official $60–90 billion cost the benefit-cost ratio is only about 0.1; on the Initiative’s higher independent estimate, about 0.06 — against roughly 0.44 for the lower-speed HPPR alternative. Whichever cost figure you use, the benefits recover a dime or less on the dollar, far short of the 1.0 a project needs to break even; the page asks readers to evaluate the project on numerator alone.
On the page’s own headline figures, the ridership claim of up to 24 million passengers by 2055 is roughly 2.6 times the Initiative’s central estimate, and the sustainability claim inverts under full-lifecycle carbon accounting: the Initiative finds ALTO a net emitter of about 15 million tonnes CO₂e over fifty years, while HPPR is a net carbon sink.
This is the standard presentation pattern of optimism bias documented in megaproject appraisal: gross benefits foregrounded, costs and risks kept off the page, and ceiling figures — “up to” — offered as though they were expectations.
The Frame
Benefits gross, cost absent
The GDP line is the clearest instance. The page reports a 1.1 per cent increase in Canada’s GDP, valued at $24.5 billion “in today’s value” — a figure discounted to the present without disclosing the capital sum it is being discounted against. The Initiative’s ECI/CFI cost model puts ALTO at approximately $143 million per kilometre central; over a corridor of roughly one thousand kilometres, the capital envelope is an order of magnitude larger than any single benefit line quoted on the page. The HPPR spine, by contrast, is modelled at roughly $28–40 million per kilometre. ALTO’s own official figure, stated elsewhere, is $60–90 billion for the corridor; the conclusion here does not turn on whose estimate you take, since even on that lower number the benefit-cost ratio is only about 0.1, and on the Initiative’s estimate about 0.06.
Presented this way, the benefits cannot be wrong — only incomplete. A gross benefit is a real quantity; it simply says nothing about whether the project earns it back. That judgement requires the two numbers the page withholds: the cost, and the ridership assumption most of the other benefits depend on.
Comparison
The page’s claims against the corridor’s numbers
Each row sets a figure as ALTO states it beside the corresponding finding from the Initiative’s modelling.
ALTO’s Claim
The Initiative’s Finding
Ridership. Up to 24 million passengers annually by 2055.
The Initiative’s central estimate is approximately 9.2 million in 2055, rising to about 12.5 million by 2080 — roughly 2.6 times lower than the page’s figure. “Up to” marks a ceiling, not an expectation, and the figure coincides exactly with the page’s own 2041 corridor population of 24 million, inviting readers to conflate people in the corridor with trips captured.
Emissions. 100% electric — the equivalent of removing about 100,000 cars from the road each year.
“100% electric” describes operational emissions only. Counted over its full lifecycle — the embodied carbon of a 300+ km/h greenfield build, against a ridership that is itself overstated — the Initiative finds ALTO a net emitter of roughly +15 Mt CO₂e over fifty years. The lower-speed HPPR alternative, built largely on existing alignment, is a net carbon sink.
Economic impact. 1.1% increase in Canada’s GDP ($24.5 billion in today’s value).
A gross benefit stated with no cost and no netting, discounted to present value without disclosing the capital figure behind it. Set against the Initiative’s cost model, the corresponding benefit-cost ratio is approximately 0.06.
Jobs. Over 50,000 during construction; a further 5,000 once operational.
Construction employment is a project input — a cost — not a benefit. Counting it on the benefit ledger is double-counting, among the most reliably flagged errors in megaproject business cases. The 5,000 operational jobs are a genuine recurring effect; the 50,000 construction jobs are not a benefit at all.
Road decongestion. Valued at $570 million.
The figure scales directly off ridership. If the 24 million capture is roughly 2.6 times high, the decongestion benefit is proportionally overstated. Induced demand refilling freed road capacity is not addressed.
Tourism. Approximately $800 million in revenue each year.
A gross figure with no displacement netting — spending that would have occurred anyway, or shifted from elsewhere in the corridor, is not removed.
Travel times. Toronto–Montréal ~3h; Ottawa–Montréal ~1h; Montréal–Québec City ~1h30.
These times are the payoff of the 300+ km/h greenfield alignment that drives both the ~$143M/km cost and the community disruption the page does not mention. HPPR achieves competitive times at 180–240 km/h for a fraction of the cost.
Cost of the project.
Stated nowhere on the page. ALTO’s own official range, given elsewhere, is $60–90 billion; the Initiative’s independent estimate is higher, at roughly $143 million per kilometre. This is the number against which every benefit above would have to be weighed — and the one the benefits page omits.
Three Inversions
Where the page’s strongest claims turn over
The sustainability claim inverts under lifecycle accounting
The page’s environmental case rests on ALTO being “100% electric.” That describes how the trains are powered, not what building the line costs in carbon. A 300+ km/h greenfield corridor — concrete, steel, tunnelling, geofoam, land conversion — carries a large embodied-carbon debt that operational electricity does not offset, particularly once the offset is recomputed against realistic rather than headline ridership. The Initiative’s finding is a net carbon deficit of roughly +15 Mt CO₂e over fifty years, while the lower-speed HPPR alternative is a net sink. The single most quotable line on the page — sustainability — is the one the accounting reverses.
“Up to 24 million” is a ceiling offered as an expectation
The headline ridership number does the persuasive work of the page, and “up to” is doing the work inside it. The Initiative’s central estimate is about 9.2 million passengers in 2055. Systematic overstatement of rail ridership at the appraisal stage is one of the best-documented patterns in the megaproject-forecasting literature, and this figure fits it squarely. The Initiative’s brief The Anatomy of an Optimistic Forecast sets out the mechanism in full.
Construction jobs are counted on the wrong side of the ledger
The page presents “over 50,000 jobs during construction” as a benefit. In a proper appraisal, construction labour is an input the project pays for — part of its cost, not part of its return. Presenting it as a benefit counts the same money twice. This is standard in the appraisal literature, and it is one of the easier errors for a general reader to check.
Three Numbers
What restoring the denominator shows
2.6×
the page’s 2055 ridership claim over the Initiative’s central estimate
Initiative ridership modelling
+15 Mt
net CO₂e over fifty years — ALTO as emitter, not saver, on a lifecycle basis
Initiative lifecycle carbon analysis
0.06–0.1
benefit-cost ratio for ALTO — on the Initiative’s estimate and on ALTO’s own $60–90B; both far below 1.0 (HPPR ~0.44)
Initiative cost & benefit model
None of these three figures appears on ALTO’s benefits page. Each is derived from the page’s own claims once the cost and the ridership assumption are made explicit.
Where things stand · July 2026
Summary ledger
Against the benefit claims as the page presents them:
Overstated
Ridership — “up to 24 million by 2055” is roughly 2.6 times the Initiative’s central estimate of ~9.2 million.
Contradicted
Emissions — the “100% electric” sustainability claim reverses to a net +15 Mt CO₂e deficit once lifecycle carbon is counted.
Omitted
Benefit-cost ratio — no BCR is stated anywhere; the Initiative’s central case is ~0.06.
Omitted
Capital cost — no cost figure appears on the page; central estimate ~$143M/km.
Miscounted
Construction jobs — presented as a benefit; they are a cost input, and counting them double-counts.
Overstated
Decongestion and tourism — gross figures that scale off the overstated ridership, with no netting for displacement or induced demand.
Omitted
Land and community impact — the disruption the 300+ km/h alignment requires is absent from the benefits page entirely.
The page is titled “Discover Alto’s Many Benefits.” The benefits are real as gross figures; what the page withholds is the cost against which they would have to be set, the ridership assumption most of them depend on, and the lifecycle accounting that reverses its environmental claim. Read with those three restored, the case the page makes for the project is substantially weaker than the case it appears to make.
ALTO HSR Citizen Research Initiative, lifecycle carbon analysis — ALTO net +15 Mt CO₂e over fifty years; HPPR net sink.
5.
ALTO HSR Citizen Research Initiative, ECI/CFI cost model (ALTO ~$143M/km central; HPPR spine ~$28–40M/km) and benefit-cost analysis (ALTO ~0.06 on the Initiative’s cost and ~0.1 on ALTO’s own $60–90B; HPPR ~0.44).
6.
ALTO HSR Citizen Research Initiative, “The Anatomy of an Optimistic Forecast” and “A Straighter Line,” citizenresearch.ca.
7.
Bent Flyvbjerg, on optimism bias and reference-class forecasting in the appraisal of major infrastructure projects.
The More You Look, the Worse It Gets — ALTO HSR Citizen Research Initiative
The More You Look, the Worse It Gets
Thirty studies of high-speed rail in this corridor, across fifty-six years. One simple pattern runs through all of them.
ALTO HSR Citizen Research Initiative · A plain-language guide to the record · 2026 · Working synthesis
⚠ The bottom line, up front
The people building the railway say it will pay for itself. The one independent study in 2026 that actually checked the math — using the builders’ own cost estimates — found a hole of about $53 billion over fifty years.
That’s not a fluke. It’s the pattern. For fifty-six years, the case for this railway has looked best in exactly the studies with the most to gain from building it.
In one minute
We read thirty major studies of high-speed rail in this corridor, from 1970 to today, and asked every one the same set of questions — with all the dollar figures put on a level footing.
The verdict almost always matches who paid for the study. Equipment makers, the proponent and paid advocates say build it. Independent governments say wait. And every single study that actually runs the finances finds the same thing: ticket sales can’t cover the cost, so the public pays most of the bill.
The numbers that look great — low costs, huge ridership, big climate wins — come from the promoters. The numbers that survive an independent look are far more sober. The closer and more independent the analysis, the weaker the case.
Read the full report
Corridor Rail Studies, 1970–2026 — A Cross-Decade Analysis
Thirty studies, thirty-four dimensions, nine findings, with the full evidence tables
We didn’t cherry-pick. We took thirty of the major studies of this railway — going right back to a 1970 federal commission — and put the same 34 questions to all of them, so the answers line up side by side across the decades.
30
major studies of this railway, read into one matrix
1970–2026
34
questions asked of every single study
so the answers compare
56
years of studies, all priced in today’s dollars
a level playing field
The studies come from every side: equipment makers, government task forces, a Crown corporation, universities, Transport Canada, and the builders themselves. That range is the whole point — it lets us tell a real change in the corridor apart from a change in who’s doing the asking.
What we found
Nine things every reader should know
Read across all thirty studies, nine patterns keep showing up. Here they are in plain terms.
1The answer depends on who paid for the study
Line up the verdicts and it’s impossible to miss. The build-it studies come from equipment makers, from a Crown corporation that wanted to run the trains, from the proponent, and from paid advocates. Every independent government that looked said wait. Building new is the sponsors’ answer — not what fifty-six years of evidence actually points to.
2It has never paid for itself. Not once.
Every study that runs the money lands in the same spot: fares can’t cover the cost, and taxpayers foot most of the bill. VIA’s own 1984 numbers came out negative. In 1995, three governments agreed the public would cover 70–75%. In 2026, an independent model put the public subsidy at about $53 billion over fifty years — and found the railway wouldn’t even break even until year 44. The promise that it’ll fund itself is the single most optimistic claim in the whole record.
3The closer you look, the more it costs
Whenever a promoter and an independent body price the same thing, the promoter’s number is lower — and the price climbs as the estimate gets more serious. A 2026 advocacy paper gets the cost down to $63 billion only by assuming rock-bottom construction prices, about a third of our own central estimate of roughly $143 million per kilometre. The cheaper the headline, the thinner the math underneath it.
4The ridership numbers don’t hold up
The passenger forecasts are shakier than they look — and academics, an airline, Parliament and Transport Canada have all said so. One 1994 study showed the forecast could swing fivefold just by changing a single modelling choice, on the same data. Transport Canada’s own reviewers called the assumptions “optimistic and aggressive.” And the biggest numbers always belong to the promoters.
5The freight idea is good — with one catch
Splitting passengers and freight onto the corridor’s two parallel tracks, and freeing up freight capacity as a bonus, is a genuinely sound idea — it was proposed back in 2002. The catch: at the time, the freight railways said they didn’t need the extra capacity. It’s a strong argument, as long as it’s honest about that condition.
6Going faster barely helps
Study after study finds that top speed buys almost no extra riders — one found just an 8% jump going all the way from 300 to 400 km/h, another only about 9% from 200 to 300. So the level-headed studies settle far lower: a 2002 plan judged 240 km/h fast enough, and even the independent 2026 model assumes trains averaging just 200–250 km/h. The “top speed everywhere” designs are the outliers — a moderate railway of roughly 180–240 km/h carries nearly the same riders for far less money, and that’s where the evidence actually sits.
7We’ve seen this financing risk before
Having a private partner build and run the railway while the public owns the assets isn’t new — and neither is the warning. Both Parliament (1998) and Transport Canada (2003) flagged the same danger decades ago: deals like this can hand the risk to taxpayers and the reward to investors, with a rosy headline resting on one convenient assumption.
8The climate math only counts the good half
For decades, no study counted carbon at all. Now they do — but only the savings from getting people out of cars and planes. The huge emissions from pouring hundreds of kilometres of concrete and steel and clearing land? Left out. Count both sides honestly and this design adds emissions for decades. That’s the difference between a climate win and a climate cost.
9When the numbers fail, out comes “nation-building”
There’s a move that shows up again and again: when the dollars-and-cents case comes up short, in come national unity, regional growth, and keeping up with other countries. One 2016 report recommended extending the line even at a benefit-cost ratio of 0.24 — about 24 cents of benefit for every dollar spent. These arguments can be fair. But they do the heaviest lifting exactly where the economics are weakest.
The gap, side by side
What the promoters say vs. what independent studies find
All nine findings come down to one contrast. Same railway, same engineering — but the promoters’ numbers and the independent record split apart at every point that matters, and they split the same way every time.
What the promoters say
What independent studies find
Build it new. Equipment makers, a Crown corporation that wanted the contract, the proponent, and paid advocates all say go ahead.
Wait. Every independent government that studied it held off; the reviews and the airlines said upgrade what’s there instead.
The verdict:Build vs Wait
It’ll pay for itself. The 2025 prospectus says the trains will turn a profit — the rosiest claim in fifty-six years.
Taxpayers pay most of it. From 1984 to 2026, every study that runs the money says fares can’t cover the cost. The 2026 independent model: about $53 billion in public subsidy over fifty years.
The money:Self-funding vs ~$53B public
As low as $63 billion. A 2026 paper reaches that number by assuming bargain construction prices.
More like $80–90 billion. The proponent’s own range tops out at $90 billion; independent build-ups land near $80 billion. Costs rise the closer you look.
Price tag:~$63B vs ~$80–90B
24 to 56 million riders. The 2025–2026 figures are the highest ever produced for this line.
About half that. The only recent independent, survey-based forecast lands near 10 million a year — right in line with fifty years of history.
Yearly riders:~24–56M vs ~10M
A big climate win. The proponent headlines a 39-megatonne cut — counting only the savings from fewer car and plane trips.
A climate cost, for decades. The emissions from building it — concrete, steel, cleared land — are left out entirely. Count both sides and it adds emissions.
On carbon:Half the ledger vs The whole ledger
Ridership
Same railway. Forecasts from 6 million to 56 million.
Put the passenger forecasts next to each other and they span almost tenfold — for one railway line. The high numbers always come from the promoters. The one to trust is the recent independent forecast built on an actual survey of travellers.
~10M
independent, survey-based forecast for 2050
McGill, 2026
24–43M
the proponent’s own forecast
ALTO prospectus, 2025
42–56M
the highest numbers ever produced for this line
2026 advocacy paper
Study (year)
Who produced it
Yearly riders
Basis
Air Canada / CP (1993)
Airline / railway
5.8 M
the low end of the record
Task Force (1991)
Governments
7.8 M
full corridor
Tri-government (1995)
Governments
10–12 M
full corridor
EcoTrain (2011)
Governments
10–11 M
full corridor
Lynx (1998)
Private consortium
11.1 M
Québec City–Toronto
SNCF (2010)
Equipment maker
up to 22.5 M
best-case scenario
ALTO prospectus (2025)
Proponent
24–43 M
full network
Advocacy paper (2026)
Paid advocacy
42–56 M
the highest ever
McGill (2026)
Independent
~10 M
survey-based, 2050
The numbers aren’t perfectly apples-to-apples — they cover different routes and years — which is part of the point. The takeaway is simple: the independent, survey-based forecast is about half the proponent’s.
What it means
Five takeaways
The current project sits right at the meeting point of every pattern above. The prospectus is the most upbeat sales pitch in the whole record. The most careful independent 2026 work finds a multi-billion-dollar hole. And the one favourable outside verdict is reached only by pairing the cheapest possible construction cost with the highest ridership ever forecast for the line. Here’s what that adds up to.
What the record points to
Building new from scratch is the sponsors’ pick, not the safe reading of history. Fifty-six years of evidence leans toward upgrading what exists — or waiting for a full, honest costing.
Expect the public to pay most of it. Three governments said 70–75% back in 1995, and every financial study since has landed in the same place.
A moderate-speed, lower-cost railway fits the evidence better. Extra speed barely adds riders, and costs balloon the closer you look. Both have been true for decades.
What to insist on
Get the ridership numbers independently checked before trusting them. A single forecast from the people who want to build it isn’t enough — the best studies in the record always used more than one independent forecaster.
Make the freight case — but be upfront about the catch. The idea is sound; its real value depends on the freight railways actually wanting the freed-up capacity. Say so plainly.
The evidence
All thirty studies, at a glance
Here’s the whole set, oldest to newest. Read the two right-hand columns together — who did the study, and what they concluded — and Finding 1 jumps out: the “build it” verdicts belong to the sellers and the promoters; the governments that were truly independent said wait.
Year
Study — who did it
Independent of the builder?
Verdict
1970
Intercity Passenger Transport Study — CTC
Federal
Upgrade
1984
High-Speed Passenger Rail in Canada — VIA
Crown corp
Mixed
1990
Review of Previous Studies — TRANSURB
Consultant
Wait
1990
A Pragmatic Approach (SPRINTOR) — ABB
Equipment maker
Upgrade
1990
The Canadian TGV Project — Bombardier / GEC Alsthom
Equipment maker
Build new
1991
Rapid Train Task Force — Ontario / Québec
Governments
Wait
1991
Competition in Rail Carriage — Berkowitz
Academic
Build new
1992
FAST TRACKS — VIA (advocacy)
Crown corp
Build new
1993
HST Market Assessment — Air Canada / CP
Airline / railway
Upgrade
1994
Demand-model re-estimate — Gaudry & Le Leyzour
Academic
No verdict
1995
Industrial Strategy (Vol II) — Simpson-Guerin
Consultant
No verdict
1995
Routing & Costing Study — SNC-Lavalin / Delcan
Consultant
No verdict
1995
Québec–Ontario HSR, Final Report — tri-gov
Governments
Wait
1998
The Lynx Proposal — Lynx consortium
Private consortium
Build new
2002
VIAFast — VIA Rail
Crown corp
Upgrade
2003
VIAFast validation — IBI for Transport Canada
Gov’t reviewer
No verdict
2009
Infrastructure and the Economy — Martin Prosperity Inst.
“Advocacy” means a document written to argue a case — a sales prospectus, a think-tank brief, or paid expert advocacy. “No verdict” means the study analysed the question but didn’t take a build/don’t-build position.
The independent studies to trust
Where the sober numbers come from
The full list is above. If you read just a few, read the independent ones — the counterweight to the sales pitch.
1.
Québec–Ontario High Speed Rail Project, Final Report — three governments together, 1995. Concluded the public would cover 70–75% of the cost, and a private-only version couldn’t be financed.
2.
VIAFast validation — IBI Group for Transport Canada, 2003. The government’s own reviewers, who flagged “optimistic and aggressive” ridership assumptions.
3.
Updated Feasibility Study (EcoTrain) — three governments, 2011. The most recent independent-government study; it said wait.
4.
Future of Passenger Rail in Canada — Library of Parliament, 2015. Recommended upgrading service rather than building new.
5.
Corridorwide Survey & Financial Analysis — Transportation Research at McGill, 2026. The independent study behind the $53-billion subsidy figure and the ~10-million ridership forecast.
Build Canada’s case for high-speed rail, measured against the megaproject method the memo itself invokes.
ALTO HSR Citizen Research Initiative · Methodology Brief · Published June 2026 · ALTO consultation closed April 24, 2026
⚠ The Document Under Review
Build Canada’s February 24, 2025 memo, Let’s Show the World How Canada Builds, was published one week after the federal high-speed rail announcement. It endorses high-speed rail in the Toronto–Quebec City corridor and names ALTO directly, while contesting only how the project is delivered — not whether the demand exists or whether the benefit–cost case closes. This brief takes the memo’s argument on its own terms, and holds it to the analytical standard the memo itself sets. Build Canada · original memo
Critical Finding
The memo reaches for exactly the right tools. It quotes Bent Flyvbjerg, the leading scholar of megaproject cost overruns; it calls for reference-class benchmarking against comparable lines; it demands contingency discipline; and it warns that without these, ALTO becomes another HS2 or California High-Speed Rail. On the diagnosis, the Initiative agrees.
The memo then abandons each principle at the moment it matters. It caps contingency at the level that, on its own logic, guarantees overrun. It imports foreign unit costs from a reference class that is not comparable. And it promises true high-speed rail at a unit cost that, in Canadian conditions, only high-performance rail can plausibly reach. Applied honestly, the memo’s own method points away from its conclusion.
The evidence produced since the announcement confirms the diagnosis the memo made and refutes the targets it set. The corridor is still being fundamentally re-routed in the project’s second year; the friction the memo proposed to legislate away has surfaced exactly where the method predicts. The case for caution on ALTO does not require rejecting Build Canada’s framework. It requires applying it.
The Argument’s Shape
What the memo contests, and what it does not
The memo’s argument has a particular structure. It accepts ALTO’s entire benefit case without examination — 40 per cent of the economy, 18 million people connected, up to $35 billion a year in added GDP, travel times halved — and contests only whether the project can be built cheaply and quickly. Every one of those headline figures is the proponent’s own number, repeated approvingly. The memo never asks whether the ridership exists to fill the trains, or whether the benefits exceed the costs.
It asks one question: can Canada build it the way France, Spain, and Japan did? To answer, it reaches for the right instruments — Flyvbjerg’s work on megaproject overruns, reference-class benchmarking, contingency discipline, and the cautionary record of HS2 and California. That choice of tools is what makes the memo worth engaging seriously, and what makes its conclusion fail. The same tools, applied with honest inputs, do not support the case the memo builds on them.
Common Ground
Where the memo is right
Credit first, because the diagnosis is sound. The memo correctly identifies the planning-maturity gap that drives Canadian overruns: our transit projects enter procurement with as little as 1–10 per cent of design complete, where peer countries reach 30–70 per cent. It is right that a strong, technically competent public authority — not a consortium of consultants — must own delivery. It is right that reference-class benchmarking is the antidote to optimism bias. And it is right that HS2 and California are the cautionary tales Canada should study.
None of this is in dispute. What follows is not an argument against the memo’s framework. It is the memo measured against that framework — the standard it asks to be judged by.
Held To Its Own Standard
Three flaws, by the memo’s own method
On three load-bearing claims, the memo prescribes the opposite of what the method it cites requires. The left column states the memo’s own prescription; the right column applies the memo’s own standard to it.
What the memo prescribes
Held to its own standard
1. Cap contingency, including inflation, at 10 per cent. Presented as following global best practice, alongside meticulous benchmarking against French and Japanese lines.
Reference-class forecasting — the very method the memo invokes — requires a larger uplift the less design is complete, because the unknowns are still unpriced. The memo itself concedes Canadian projects sit at 1–10 per cent design maturity. At that maturity, the honest uplift is routinely 40 per cent or more; a 10 per cent cap is defensible only near design completion. The prescription specifies the precise conditions under which budgets break, and calls it discipline.
Verdict:Self-contradictory
2. $25–40M per km; a corridor for under $50B; payback within two years. Drawn from the cost record of France, Spain, and Japan.
A reference class works only if the cases are comparable, and these are not. The cited figures come from older lines, on flatter and cheaper terrain, in earlier cost eras, with no adjustment for what this corridor crosses: the granite of the Canadian Shield, the Frontenac Arch, the wetland and karst of eastern Ontario, and dense urban approaches at both ends. Importing an unadjusted foreign unit cost is exactly the non-analogous-reference-class error Flyvbjerg’s method exists to catch — committed in the section that cites him. The Initiative’s complexity-adjusted estimate runs several times higher, with a central benefit–cost ratio far below the break-even the memo treats as obvious.
Verdict:Wrong reference class
3. True high-speed rail at that same unit cost. Dedicated track, full electrification, grade separation, 300 km/h — delivered for $25–40M per km.
In Canadian conditions, $25–40M per km is not a high-speed-rail figure at all. It is roughly the cost of a high-performance rail upgrade — incremental improvement of existing alignments, the option the memo dismisses in a single line. The memo promises high-speed performance at high-performance-rail prices. The headline product and the headline number belong to two different projects; you cannot buy the performance of one at the price of the other.
Verdict:HSR promise, HPR price
$25–40M
per km — the memo’s claimed unit cost, from France / Spain / Japan
Build Canada memo
≈ $143B
reference-class capital for the corridor delivered as high-speed rail
CRI reference-class analysis
≈ 0.06
central benefit–cost ratio — against the memo’s implied two-year payback
CRI NPV / BCR matrix
“Payback in two years” implies a project that returns many times its capital. The reference-class evidence points to one that returns a small fraction of it. The gap between the memo’s number and the comparable record is not a rounding difference; it is the entire argument.
What Has Happened Since
The diagnosis confirmed, the targets refuted
More than a year on, events have tested the memo’s promises against reality. They vindicate its diagnosis of Canadian megaproject failure and dismantle the targets it set against that diagnosis.
A corridor still being re-routed in year two
The memo set a target of a high-value section carrying passengers within five years, on standardized, locked-in designs, at 10 per cent contingency. Yet the corridor is still being fundamentally re-aligned — a southern-corridor study, a conditional new station at Kingston, an alignment still unchosen between north and south. That is direct evidence of the planning immaturity the memo flagged on its first page — and it makes the memo’s own targets incoherent. You cannot run trains in five years on frozen designs while you are still deciding where the line goes.
Friction exactly where the method predicts
The memo’s prescriptions — sever environmental review from planning, legislate automatic approvals, reduce municipalities to suggesting where infrastructure is placed rather than whether — were aimed at the precise constraints this corridor turns out to be full of: two UNESCO designations, species at risk, organized community opposition, and rural-character concerns that public consultation surfaced in volume. The Initiative’s Community Friction Index has risen from 43 to 54 since consultation began and is projected to climb further. The memo’s answer to friction is not to resolve it but to override it — and on this corridor, that is neither lawful nor likely.
The memo’s own number makes the HPR case
The memo dismisses improving existing rail as insufficient, insisting dedicated high-speed track is the only way. But its own affordability figure, $25–40M per km, is a high-performance-rail number — and the consultation recorded clear public appetite for improving VIA service first and preserving existing Kingston and eastern-Ontario connections. Strip the rhetoric and the memo makes the affordability case for the alternative it rejects.
Conclusion
The antidote that recreates the disease
The memo casts ALTO as Canada’s escape from the HS2 and California failures. Trace its logic, though, and the resemblance runs the other way. “We will build it cheaply and quickly like France and Japan — just cap the contingency and clear the obstacles” is not the cure for optimism bias. It is the textbook expression of it, almost word for word how California began.
The memo’s real service is that it concedes the entire framework. Flyvbjerg, reference classes, contingency discipline, planning maturity: take those tools, feed them honest inputs, and the conclusion does not survive. The case for caution on ALTO does not require rejecting Build Canada’s method — it requires applying it. Done honestly, it points not toward a sprint to high-speed rail at imported prices, but toward a high-performance upgrade of the corridor Canadians actually use, at a cost the country can defend.
Where The Method Lands
Summary ledger
The memo measured against the standard it sets for itself:
Sound
Diagnosis — planning-maturity gap. Correctly identifies that Canadian projects enter procurement at 1–10% design versus 30–70% abroad.
Sound
Delivery authority. Rightly prefers a strong, technically competent public authority over dependence on a consultant consortium.
Sound
Reference-class benchmarking. Rightly names it as the antidote to optimism bias.
Violated
10% contingency cap prescribed at 1–10% design maturity — manufactures the overrun the memo warns against.
Violated
$25–40M/km imported from non-comparable lines without adjustment for terrain, era, or urban approaches.
Violated
HSR promised at HPR price. The headline product and the headline cost belong to two different projects.
Violated
Override of environmental review and municipal consent — aimed squarely at the corridor’s real, documented constraints.
Refuted by events
Five-year passenger target on frozen designs — incompatible with a corridor still being re-routed in the project’s second year.
The memo is at its strongest where it agrees with the Initiative — on method. It is at its weakest where it abandons that method to reach a predetermined answer. Applied honestly, Build Canada’s own framework makes the case for high-performance-rail realism, not for a high-speed sprint at imported prices.
Alto, Public Consultation Report, June 22, 2026 — corridor framing, southern-corridor and Kingston-station feedback, community and environmental concerns.
3.
Bent Flyvbjerg, “What You Should Know About Megaprojects and Why: An Overview,” Project Management Journal (2014) — the megaproject-overrun research the memo cites.
4.
ALTO HSR Citizen Research Initiative — reference-class forecasting, Engineering Complexity Index regression, and de-biased cost analysis for the Toronto–Quebec City corridor.
5.
ALTO HSR Citizen Research Initiative — NPV / benefit–cost matrix and Community Friction Index (post-consultation update).
An ALTO Vice-President says the rail alternative would cost about as much as high-speed rail without the benefits. The government’s own record — and ALTO’s own document — say otherwise.
ALTO HSR Citizen Research Initiative · Analysis · June 2026
In short
In a recent public video, an ALTO Vice-President argues that high-frequency rail would still need dedicated track, would therefore cost about as much as high-speed rail, and would deliver less — a “high cost, low benefit” option. The claim runs against the public record. The government’s own reports costed a dedicated-track high-frequency railway far below high-speed rail, and judged it buildable in a fraction of the time. What shifted that cost to “similar” has never been made public.
On the benefit side, ALTO’s case rests on ridership the international reference class does not support. Tested against ALTO’s own document and the Initiative’s financial analysis, the high-cost option turns out to be the one being built.
The argument is a single chain. High-frequency rail, the video says, is often presented as the cheaper alternative — but it would still require new dedicated track, so its cost would rise to roughly that of high-speed rail, while delivering lower travel-time, ridership, and economic benefits. The conclusion offered to viewers is that high-frequency rail is a “high cost, low benefit” option, while high-speed rail delivers both speed and frequency.
It is a clean story. Two problems sit beneath it before any single figure is examined.
It claims a cost convergence the record contradicts
The video is right that high-frequency rail needs dedicated track — it does not claim trains would share track with freight. Its claim is that building that dedicated track pushes the cost up to roughly high-speed rail’s. The government’s own reports say otherwise, on both cost and time. A dedicated-track, electrified high-frequency railway was costed at $27.7 billion in the December 2021 Business Case — and roughly $4–6 billion in its original 2016 form — and judged buildable in about four years. High-speed rail is now costed at $60–90 billion, on a build horizon stretching into the 2040s. What evidence moved high-frequency rail’s cost and schedule up to “similar” has never been explained, and no side-by-side comparison has been made public.
It never engages the alternative the Initiative proposes
The video treats high-frequency rail as the only alternative to high-speed rail. The Initiative’s proposal is different again: High Performance Rail (HPR) builds dedicated passenger track along existing transportation corridors — such as the CN right-of-way and the Highway 401 — and frees the Kingston Subdivision for freight. It is neither the government’s old high-frequency plan nor ALTO’s high-speed one, and ALTO has never assessed it.
Tested Against the Record
Three claims, three answers
$27.7B
what a dedicated-track high-frequency railway was costed at — against $60–90B for high-speed rail
2021 JPO Business Case
5×
the cost-per-kilometre gap between ALTO and High Performance Rail in the Initiative’s model
$142M vs $28M per km
0.11
ALTO’s central benefit-cost ratio — well below the 1.0 that marks a project that pays its way
Initiative methodology paper
The video makes three factual claims — on cost, on speed, and on benefit. Each can be checked against ALTO’s own published document and the Initiative’s analysis.
The claim in the video
What the record shows
“It would cost on a similar scale to high-speed rail.”
Contradicted by the public record. The government’s own 2021 Business Case put a dedicated-track high-frequency railway at $27.7 billion, against ALTO’s $60–90 billion. Even ALTO’s own Annex B places its “conventional rail” comparator 20–30% below high-speed rail. The Initiative’s reference-class model — a regression across more than forty international projects — puts ALTO at $142M/km and HPR at $28M/km, a five-fold gap. “Similar scale” holds on none of these.
“Without significantly faster travel times.”
Conventional speed already captures most of the benefit. A 177 km/h dedicated-track service was set to cut Toronto–Ottawa from over four hours to about two hours fifty. By ALTO’s own travel-time table, going to 300 km/h saves only a further 17 minutes on Toronto–Ottawa, 19 on Ottawa–Montréal, and 25 on Montréal–Québec. Most of the time saving comes from leaving freight-priority track — not from the extra speed.
“Lower ridership and reduced economic benefits.”
The benefit case rests on ridership the reference class does not support. ALTO’s 24-million-trip target sits outside the achievable modal-shift frontier of 5–12 million annual riders. No operating posture is subsidy-free; each requires roughly $1–3.5 billion per year. The central benefit-cost ratio is about 0.11. The “high benefit” half of the slogan is the half that does not survive checking.
A Note on the Travel Times
Estimated, not simulated
There is a further problem with the speed claim, separate from how small the gain is. The faster journey times were never modelled for this corridor at all. A government record released under the Access to Information Act (file A-2025-00333) shows that the project office produced a detailed RailSys simulation only for the 177 km/h base case. Every faster journey time was a spreadsheet estimate, benchmarked to average speeds on intercity railways in other countries — described in the project’s own memorandum as “for information and comparison purposes” and left to be refined later.
In other words, the under-three-hour trips that make high-speed rail attractive have no corridor-specific engineering behind them in the released record. The one number anyone actually drove through a model of the real line is the slow one.
Read the full record
The Initiative examines this in detail — the two methods, the journey-time tables, and how the speed ceiling was set as a policy target — in a companion research note, Estimated, Not Simulated, based on the same Access to Information release.
The Carbon Case
A carbon debt, not a carbon saving
The video folds environmental benefit into ALTO’s column, on the assumption that faster, higher-ridership rail is the greener choice. The Initiative’s 50-year lifecycle analysis finds the opposite once construction and a decarbonising vehicle fleet are counted. ALTO’s build is a large one-time carbon debt before a single passenger boards — about 14.7 Mt CO₂e in the central construction estimate — and with fifty years of operations the lifecycle total lands at roughly 24 to 27 Mt CO₂e on Ontario’s current grid, and as much as 34 Mt if the grid leans more on gas.
That debt only counts as a saving if the trips it captures would otherwise have been higher-carbon — and the payback math is unforgiving. At the ridership the corridor is most likely to see in its early years, around 4 million passengers a year, no scenario repays the construction debt within a credible horizon. Even at mature ridership, payback runs from a few decades to more than five hundred years, depending on how clean the grid is.
The comparison only worsens with time. By the 2040s, when ALTO might open, much of the car fleet will be electric — and an electric car carrying 1.2 people already emits about 10 g CO₂e per passenger-kilometre, below ALTO’s all-in emissions at every ridership level on today’s grid. Diverting existing VIA Rail passengers, at roughly 25 g/pkm, saves nothing at all. ALTO’s carbon case rests on displacing gasoline cars and short-haul flights — not the fleet that will actually be on the road when it opens.
Most of that debt is greenfield construction. An approach that runs on existing corridors — as High Performance Rail does — avoids the bulk of it, and the single largest carbon lever, shifting freight off congested track, is available whatever the trains’ speed or traction.
Why the Gap Is Real
The cost difference is structural, not arithmetic
The five-fold difference in the Initiative’s model is not an accounting artefact. A 300 km/h design forces a new dedicated greenfield alignment — grade separation, gentle curves, continuous fencing, and large-scale land acquisition — through terrain that scores high on both engineering complexity and community friction. Both the government’s high-frequency plan and the Initiative’s HPR instead run on or alongside existing corridors, which is why each comes in well below the high-speed option. In the Initiative’s model, the gap between high-speed rail and HPR splits roughly evenly between physical engineering and community friction — the cost of the land, the disruption, and the opposition that a new high-speed right-of-way creates.
The Bottom Line
High cost, low benefit — for whom?
The video’s thesis — that high-frequency rail is high cost and low benefit while high-speed rail delivers both — is contradicted by the government’s own record. High-frequency rail was a fully studied, dedicated-track plan, priced at $27.7 billion in 2021 and a fraction of that in its original form, and due to be carrying passengers now. The decision to replace it with a 300 km/h, $60–90-billion project was taken without a published comparison; the video supplies the missing conclusion after the fact.
On the evidence available, the high-cost option is the one that was chosen. The lower-cost alternatives — the government’s own, and the Initiative’s — were set aside without being weighed in public. That is the question the slogan invites, turned back on itself: high cost, low benefit, for whom?
Sources
Primary documents
1.
ALTO, Fast Forward: Shaping Canada’s Future with a High-Speed Rail Network (March 2025) — cost ranges, travel times, and ridership targets, main text and Annex B. altotrain.ca
2.
Joint Project Office High Frequency Rail Project, Business Case Update, V.002 (December 10, 2021) — dedicated-track design, $27.7 billion costing, and four-year construction estimate.
3.
The Globe and Mail, “Transport Canada reviewing studies on Via Rail expansion” (July 2017) — the original 2016 high-frequency concept at roughly $4–6 billion. theglobeandmail.com
4.
“VIA HFR-TGF Journey Times” memorandum and accompanying email chain (August–September 2023), released under the Access to Information Act as file A-2025-00333 — simulated base case versus estimated higher-speed times.
5.
ALTO HSR Citizen Research Initiative, ALTO Financial Analysis (methodology paper and supporting research notes) — cost-per-kilometre model, ridership frontier, subsidy spectrum, benefit-cost ratio, and lifecycle carbon. ALTO-Financial-Analysis.pdf
6.
ALTO HSR Citizen Research Initiative, 50-Year Lifecycle CO₂ Budget — Parametric Analysis (March 2026) — construction, operational, payback, and modal-comparison figures, drawing on HS2, UIC, and international HSR lifecycle studies.
7.
Statements examined: public video by an ALTO Vice-President (June 2026).
A plain-language guide to how we evaluated the cost of the proposed ALTO high-speed rail line — starting from one simple rule that every railway in the world has to obey, and following it through to a number the government’s own claims do not match.
ALTO HSR Citizen Research Initiative · Financial Framework · Published May 2026
⚠ What this is
This is the readable version of a longer technical paper. The full document and slide deck show every calculation; this post explains, in everyday terms, what we did, why, and what we found — with no maths background assumed.
The short version: the project’s likely capital cost is roughly double what the government has stated; the trains cannot pay for themselves at any realistic ticket price; and the project’s headline ridership target of 24 million passengers a year sits outside the range that any comparable line has ever achieved.
The one idea to take away
Every operating railway in the world has a bill that has to balance every year. What it costs to build and run the line on one side; where the money to cover that comes from on the other. The money can only come from three places: ticket sales, a government subsidy, or value captured from land near the stations.
You can argue about any single number. What you cannot do is leave one side of the bill short. If a proponent quotes you a low cost and a high number of riders but never tells you the subsidy, the subsidy is simply the part of the bill they haven’t shown you — it doesn’t disappear. Our whole method is just: fill in every blank on the bill using independent evidence, and see what the missing number turns out to be.
Read in full
A Framework for Independent Evaluation of the ALTO HSR Project
The complete methodology, every rubric and dataset, and a slide deck version — all published and reproducible
Imagine your household budget. Whatever you spend has to be matched by money coming in — from your salary, your savings, a loan. A railway is no different, just bigger. There are two kinds of cost: the enormous one-time cost of building the line (paid off gradually, like a mortgage), and the ongoing cost of running it every year — staff, electricity, maintenance, replacing worn-out trains.
Those costs have to be paid for. There are only three sources. Here is the whole thing on one line:
The annual fiscal ledger
Cost to build (yearly share) + cost to run=ticket sales + government subsidy + land value capture
The left side is what the railway costs each year. The right side is where that money comes from. The two sides must be equal — that’s what “balance” means.
In plain terms
“Land value capture” means a railway can sometimes raise money from the rise in nearby land prices that a new station creates — for example by developing land around the station. It’s a real tool, but a modest one in Canada, and ALTO has named no such mechanism. So for ALTO that third source is effectively zero, which leaves only two: tickets and subsidy.
Here is the consequence that does all the work. Once you’ve pinned down the cost, the ticket revenue, and the land capture using evidence, the subsidy isn’t a choice anyone gets to make — it’s whatever is left over to make the bill balance. It’s a leftover, not a decision. That single insight is why a project can claim to be “self-sustaining” and still, on its own numbers, need billions of dollars of public money a year. The subsidy was always there; it just wasn’t written down.
The Method
Seven steps to fill in the blanks
To fill in each part of that bill honestly, we built a seven-step process. Each step answers one question using published evidence rather than the project’s own marketing, and each step shows its work so that anyone who disagrees can re-run it with their own assumptions. Here is what each step asked, and what it found for ALTO.
1
How hard is this to build?
Engineering complexity, compared to rail lines around the world
We scored the corridor’s technical difficulty against an international database of comparable projects. ALTO lands in the upper “High” band — among the most demanding corridors anywhere in the world. Hard things cost more and run late more often; this matters for every number that follows.
2
How smooth will getting it approved and built be?
Community, consultation and consent risk
We measured the friction the project faces from communities, landowners and the consultation process. The score lands in the band where comparable megaprojects’ cost overruns tend to cluster — another reason to expect the final bill to climb.
3
What will it really cost to build?
Capital cost, calibrated against similar projects
The government states $75 billion. Comparing ALTO to a reference class of similar railways and adjusting for its difficulty, our central estimate is $143 billion — nearly double — with a worst-case ceiling of $264 billion. The stated budget sits at the very bottom of the plausible range.
4
What will it cost to run, every year?
Operating cost, built up from the actual assets
Adding up staff, operations, maintenance and replacing trains as they wear out gives about $2.15 billion a year. To cover just that running cost from fares, the line would need roughly 12.5 million passengers a year — and even then it only recovers about 80 cents of every dollar.
5
How many people would actually ride it?
Realistic ridership, and the subsidy that follows
Based on how many travellers comparable lines actually pull off the roads and out of the air, a realistic range is 5 to 12 million riders a year, with a sensible target near 8 million. ALTO’s headline figure of 24 million sits outside that range entirely.
6
Is it worth it?
Benefits weighed against costs
Weighing all the benefits against all the costs gives a ratio of about 0.11 — roughly eleven cents of benefit for every dollar spent. To make the 24-million target pay, tickets would need to cost between $381 and $1,596 — and 24 million riders is unreachable anyway.
7
Would a serious gatekeeper approve it?
Tested against Norway’s independent project-review system
Norway runs big projects through two independent quality gates before funding. Run through those gates, ALTO fails most of the criteria at both stages — described as a textbook example of exactly the kind of project the Norwegian system was built to catch.
What “reference class” means
Rather than trust a project’s own optimistic forecast, you line it up against a large group of similar projects that have already been built, and ask: what actually happened to those? It is one of the most reliable ways known to forecast cost and ridership, precisely because it sidesteps wishful thinking.
The Headline Figures
Three numbers that frame the whole thing
Cost to build
$143B
Our central estimate — against a stated budget of $75B
Value for money
11¢
Of benefit returned per dollar spent (a benefit-cost ratio of 0.11)
Ridership gap
24M
The stated target — against a realistic ceiling near 12M
None of these is a guess plucked from the air. Each one is the output of one of the seven steps above, and each step publishes the data and the scoring behind it. The point of putting them together is simple: a project whose costs are understated, whose value-for-money is low, and whose ridership is overstated does not become viable just because its three weaknesses are described in separate documents.
The Part Nobody Mentions
No ticket price makes the bill disappear
Here is where the “bill that has to balance” idea pays off. There is a temptation to think the subsidy could be designed away — charge higher fares, or fill more seats. So we tested the three obvious strategies. In every case, a large public subsidy remains. The only thing that changes is how the cost is split between the passenger and the taxpayer.
Charge premium fares
~$1B / yr
Trade-off:High ticket prices, so fewer riders. Lowest subsidy — but still about a billion a year.
Match airline fares
~$2B / yr
Trade-off:Prices in line with flying. A moderate middle path — roughly two billion a year.
Deep discounts, fill seats
~$3.5B / yr
Trade-off:Cheap tickets, more riders — but the lowest fares mean the largest subsidy.
Notice what this means. Choosing among these isn’t a choice between “subsidised” and “unsubsidised” — every option is subsidised. It’s only a choice about who pays: the rider at the ticket window, or the taxpayer through the public purse. That is a perfectly legitimate political decision to make out in the open. What isn’t legitimate is pretending the choice doesn’t exist.
And that is exactly why one specific government claim does not hold up. On 22 April 2026, the government stated the operation would be “financially self-sustaining” — meaning fares alone would cover running costs. But no realistic level of ridership produces enough ticket money to cover the $2.15 billion annual running cost. Measured against every comparable high-speed line operating in the world, that claim simply isn’t consistent with the evidence.
The Bottom Line
What the filled-in bill shows
Put the seven steps together and the picture is consistent, not cherry-picked:
Roughly double the cost
The likely cost to build is about twice the stated budget — and the stated figure sits at the bottom edge of what’s plausible.
Cannot pay its own way
At no realistic fare do ticket sales cover even the cost of running the trains, let alone building the line.
Eleven cents on the dollar
The central value-for-money ratio is about 0.11 — far below the level at which a project is normally considered worthwhile.
A ridership target out of reach
The 24-million figure lies outside the range any comparable line has achieved, and the subsidy is required no matter what.
Measured against Norway’s independent review standard — one of the most respected gatekeeping systems for large public projects — ALTO fails the majority of the tests at both the early-concept stage and the pre-funding stage.
In Fairness
This is a recommendation, not a verdict
It matters how this is meant to be read. The seven-step process produces a recommendation, not a decision. The decision belongs to elected officials and the public — ideally informed by an independent authority such as the Parliamentary Budget Officer.
The purpose of all this work is narrow and, we hope, fair: to put a balanced, contestable record on the table, so that the choice about which rail corridor Canada builds rests on evidence rather than on headline numbers. Every step publishes its rubric, its scoring, and its data. If you disagree with any finding, you are invited to re-run it under your own assumptions — that openness is the whole point.
A good public investment can survive this kind of scrutiny. The questions below are the ones any major rail proposal should be able to answer plainly.
On cost: If the stated budget sits at the bottom of the plausible range, what is the realistic central figure — and what happens to the case if the cost lands there?
On the subsidy: Since fares cannot cover running costs at any realistic ridership, what annual public subsidy is the government planning for, and who decided how to split the cost between riders and taxpayers?
On ridership: What evidence supports 24 million riders a year when comparable lines top out far below that — and what does the business case look like at a realistic 8 to 12 million?
None of these questions presupposes opposition to passenger rail, which many people support. Each asks only that the project state plainly what its own numbers imply — so the public can weigh a real proposal rather than a hopeful one.
Read the full framework
A Framework for Independent Evaluation of the ALTO HSR Project
The complete methodology, the seven-stage pipeline, and every rubric, score and dataset — published and reproducible
Citizen Research Initiative · Financial Analysis · NPV Note 1
NPV and BCR Projections for ALTO
A deterministic net-present-value analysis over 2029–2080 across three capital-cost scenarios, three operating regimes, and four discount rates — thirty-six combinations, every one of them strongly negative.
ALTO HSR Citizen Research Initiative · NPV Note 1 · Net Present Value Analysis 2029–2080 · Published May 2026 · updated June 2026
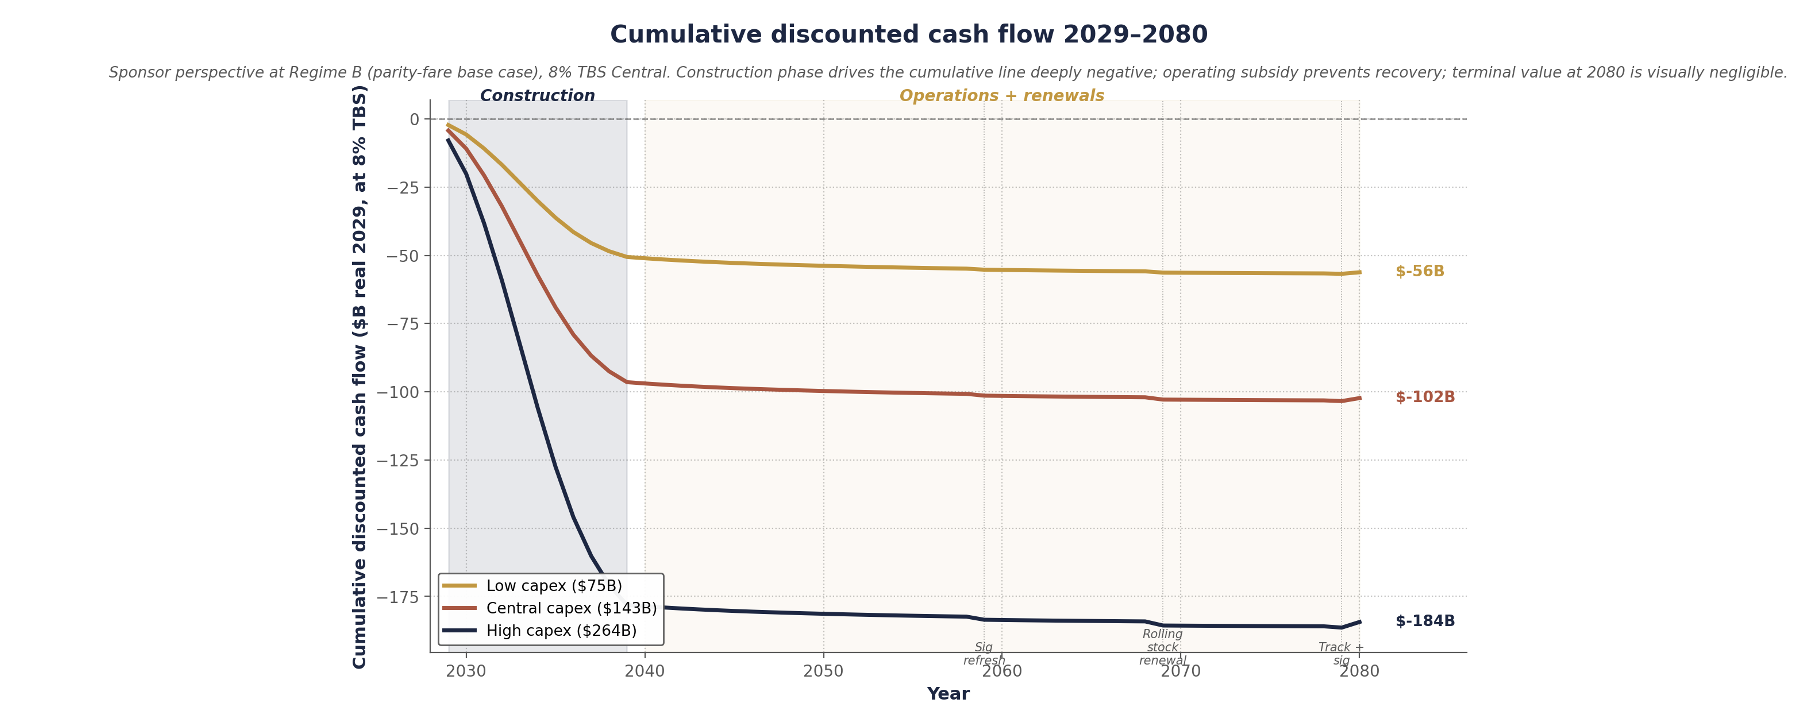
⚠ Headline Finding
Across 36 combinations of capital-cost scenario, operating regime, and discount rate, ALTO produces a financial NPV between −$50 billion and −$246 billion in real 2029 CAD. At the Treasury Board central 8% rate and the welfare-efficient Regime B posture, NPV is −$56B at $75B capex, −$102B at $143B, and −$184B at $264B.
The benefit-cost ratio across the 9-cell capex×regime grid runs from 0.030 to 0.107 — every cell at least nine times below the 1.0 break-even threshold. Capital cost is the dominant driver; operating regime is second-order; the discount rate changes magnitudes but not the direction.
Executive Summary
This report evaluates financial and combined NPV over a 52-year horizon, integrating the engineering operating-cost build of the Cost-of-Running-the-Train work with the modal-shift subsidy frontier — a coupled analysis in which ridership, fare, operating cost, and operating subsidy are determined jointly along the corridor’s achievable frontier.
Three capital-cost scenarios bracket the plausible range: a low case at ALTO’s published $75B (~P2.5 of the reference class), a central case at $143B (the reference-class mean under Flyvbjerg’s overrun distribution), and a high case at $264B (the P97.5). Three operating regimes from the subsidy frontier set the achievable operating points: premium (Regime C, 6.1M pax), parity-with-air (Regime B, 8.2M, the revenue peak), and deep-discount (Regime A, 11.2M, near the modal-shift ceiling).
Cost-recovery break-even from fares alone sits at 117 trains/day, or 12.5 million annual passengers at the reference yield — above the modal-shift ceiling. All three regimes operate below it and require ongoing federal operating subsidy. The PV of that subsidy stream is structurally independent of capital cost ($4.6B at Regime C to $7.6B at Regime A at 8%). And the 24-million-by-2055 figure in ALTO’s public materials sits outside every operating point on the frontier and is not modellable under any defensible parameter combination.
Download
NPV Note 1 — NPV and BCR Projections for ALTO (PDF)
The full report with all six figures and nine tables: the three capital scenarios, the three operating regimes, the four discount-rate NPV tables, the operating-subsidy stream, the economic overlay, the benefit-cost grid, and the methodology and parameter appendices
This report presents an NPV analysis of ALTO over 2029–2080, in real 2029 Canadian dollars from the project-sponsor perspective, with a parallel economic overlay for passenger and external benefits. The objective is a defensible quantitative basis for evaluating the project against the standard Treasury Board cost-benefit framework.
The framework integrates two pieces of prior work. Annual operating cost is built from the lifecycle methodology of the operating-cost note — infrastructure maintenance, train operations, and fleet recapitalisation. Ridership, fare, and operating subsidy are determined jointly by the three operating regimes of the subsidy-frontier note, which establish the achievable points on the corridor’s modal-shift frontier. Capital cost is treated through reference-class forecasting, with three scenarios spanning the empirical distribution of cost outturns on comparable HSR megaprojects. Operations are assumed to commence in 2040 after an eleven-year construction period; cash flows include capex during construction, operating cost and ramped fare revenue, three lump-sum renewals at operating years 20/30/40, and a terminal residual at 2080.
−$102B
Financial NPV, base case ($143B capex × Regime B × 8%)
0.030–0.107
Benefit-cost ratio across the 9-cell grid — all ≥9× below break-even
~94%
Share of the negative present value driven by capital cost alone
2 · Capital Cost
Three scenarios from the reference class
Capital cost is the largest single quantity in the analysis and the dominant source of NPV uncertainty. Three scenarios span the plausible range, calibrated by reference-class forecasting on the international HSR cost database (log-normal, mulog = 4.963, sigmalog = 0.312).
Low — $75B
ALTO’s published figure (the centre of the $60–90B Fast Forward range). Sits at ~P2.5 of the reference class — a lower-tail estimate consistent with megaproject optimism bias. Predates the HFR→HSR scope expansion and carries no published contingency.
Central — $143B
The reference-class mean. Applying Flyvbjerg’s 44.7% average rail overrun to the baseline, plus ALTO’s engineering-complexity premium (composite 73–81), gives the modal outcome — the appropriate base case for procurement decisions.
High — $264B
The P97.5 — exceeded by ~1 HSR project in 40. Not a theoretical bound: HS2 Phase 1 (~+250%), California HSR (~+200%), and HSL-Zuid (228%) all approached it. The corridor’s geology and the Canadian P3 record make it a realistic case.
The three scenarios are not equally probable: under the calibrated distribution, the proponent’s figure has roughly a 2.5% chance of being achieved or undercut, the central scenario is the modal outcome, and the high scenario reflects upper-tail risk. Treating $75B as the planning case would require ALTO to be delivered with cost discipline materially better than every comparable international HSR megaproject — a claim for which no evidence has been adduced.
3 · Operating Regimes
Three points on the achievable frontier
The three operating regimes derive from the subsidy frontier. Each is an internally consistent point on the corridor’s achievable modal-shift frontier, with ridership, fare, revenue, and subsidy following from a single fare posture. No operating point produces high ridership at low subsidy.
Table 2. Operating regime parameters (central 2055 demographic anchor). Operating subsidy = max(0, operating cost − fare revenue). Mature values shown; in operating years 2040–2047 ridership and revenue ramp from 50% to 100% of mature values.
Parameter
Regime C — premium
Regime B — parity
Regime A — discount
Rail-to-air fare ratio
1.4
1.0
0.55
Average fare ($/trip)
$207
$157
$96
Mature ridership (M pax/yr)
6.1
8.2
11.2
Modal share captured
22%
30%
40%
Annual fare revenue ($M)
$1,260
$1,290
$1,080
Annual operating cost ($M)
$1,928
$2,116
$2,385
Annual operating subsidy ($M)
$668
$826
$1,305
Regime B is the welfare-efficient point under standard cost-benefit assumptions — simultaneously the revenue-maximising point and the per-rider welfare-efficient point. A profit-maximising private operator and a welfare-maximising public authority applying marginal analysis would converge on it, even if they would disagree on whether to operate the corridor at all. Regime A, at 11.2M, approaches the modal-shift ceiling of ~12M; pushing beyond would require corridor-external policy (highway tolls, fuel pricing, aviation limits). The 24-million figure sits above the ceiling — reaching it would require doubling modal share to ~80%, far below cost recovery, and is not modellable as a financial NPV.
4 · Operating Cost & Break-even
Why fares can’t cover cost
Annual operating cost follows the engineering build: $1,381M fixed (infrastructure maintenance $980M + fixed operating $221M + fleet recapitalisation annuity $180M) plus ~$26 per train-km variable, equivalent to $89.7M per million annual passengers at the 450-seat, 65% load-factor convention. Crucially, this cost is driven by service intensity, not by what the infrastructure cost to build — a $264B corridor running 80 trains/day costs essentially the same to operate as a $75B one.
Cost recovery from fares alone, at the reference yield of $0.20/passenger-km, requires approximately 117 trains per day — 12.5 million annual passengers. That threshold sits above the modal-shift ceiling of ~12M. All three regimes operate below it and therefore require ongoing federal operating subsidy.
Figure 1. Cost-recovery break-even and the three operating regimes. The navy cost line is the engineering build; the dashed terracotta line is reference-yield revenue, crossing cost at 117 trains/day (12.5M pax). The solid terracotta curve is the modal-shift revenue line, Laffer-peaked at ~$1.29B near Regime B and sitting below the reference line because the framework requires sub-reference fares to capture modal share. The vertical gap between each regime’s cost square and revenue diamond is the annual operating subsidy. The modal-shift revenue curve never crosses the cost curve at any achievable ridership — cost recovery from fares alone is unreachable, even at the deep-discount Regime A.
5 · Financial NPV
Strongly negative across all 36 cells
Financial NPV is strongly negative across all 36 combinations of capex scenario, operating regime, and discount rate. The base case — central capex × Regime B × 8% — is −$102.3B, of which the capital component accounts for ~94%.
Figure 2. Cumulative discounted cash flow, 2029–2080, sponsor perspective at the Regime B base case, 8% TBS Central. Construction 2029–2039 drives the cumulative line deeply negative under all three capex scenarios; operating subsidy outflows from 2040 prevent recovery, and the lines flatten toward their terminal NPV. The small dips mark the renewals at 2059/2069/2079; the terminal residual at 2080 gives a slight upward inflection. Final values are −$56B, −$102B, and −$184B at Low, Central, and High capex.
Table 3. Financial NPV at 8% TBS Central ($B real 2029). Figures in parentheses are negative. The grid is monotonically more negative moving down (capex rising) and weakly more negative moving across (regime premium→discount), reflecting that higher ridership produces both higher operating cost and higher operating subsidy.
Capital cost scenario
Regime C
Regime B
Regime A
Low — $75B
($55.4)
($56.2)
($58.5)
Central — $143B
($101.5)
($102.3)
($104.6)
High — $264B
($183.6)
($184.4)
($186.6)
Figure 3. Present value decomposition by capex scenario, Regime B, 8% TBS Central. PV of capital cost (navy) dominates the negative side at every level, growing from $51B at Low to $178B at High. PV of operating cost (terracotta) is identical across scenarios at $11.2B — structurally decoupled from construction outturn. On the benefit side, PV of fare revenue is $5.8B and capex-independent; the economic overlay is $0.76B. Benefits cover only ~6% of total costs at the central scenario.
The pattern holds across every discount rate. At 5% (HM Treasury Green Book) the base case is −$121.2B; at 3% (long-horizon Treasury), −$136.8B; at 10% (private-capital opportunity cost), −$92.4B. Lower rates produce more negative figures, because the cash-flow profile is dominated by front-loaded capex and operating-subsidy outflows rather than long-dated revenue. The full sensitivity tables are below.
Tables 4–6. Financial NPV at 5%, 3%, and 10% ($B real 2029), all three with the Central×Regime B base case marked. At no defensible discount rate does NPV approach break-even.
Discount rate & capex
Regime C
Regime B
Regime A
5% — Low $75B
($66.8)
($68.4)
($72.9)
5% — Central $143B
($119.6)
($121.2)
($125.6)
5% — High $264B
($213.4)
($215.0)
($219.5)
3% — Low $75B
($77.1)
($79.8)
($87.2)
3% — Central $143B
($134.1)
($136.8)
($144.2)
3% — High $264B
($235.6)
($238.2)
($245.7)
10% — Low $75B
($49.7)
($50.2)
($51.7)
10% — Central $143B
($91.9)
($92.4)
($93.9)
10% — High $264B
($167.0)
($167.5)
($169.0)
Figure 4. NPV sensitivity tornado — parameter swings from the base case (Central capex × Regime B × 8%, NPV −$102.3B). Gold bars improve NPV, terracotta bars worsen it. Capital cost dwarfs every other input, with a $130B swing across the Low–High range. Discount rate is next. All operating-side parameters combined — operating cost, fare yield, renewals, terminal value, yield erosion, and regime choice — produce swings of at most a few billion each, more than an order of magnitude below the capex effect.
6 · Operating Subsidy
Decoupled from capital cost
The PV of the operating-subsidy stream is structurally independent of capital cost under the engineering build — operating cost is driven by service intensity, not construction outturn. The same subsidy values apply at all three capex scenarios.
Table 7. PV of operating-subsidy stream by discount rate and regime ($B real 2029, 2040–2080). Subsidy is capex-independent — identical at all three capex scenarios. Corresponding mature annual subsidies: $668M (C), $826M (B), $1,305M (A).
Discount rate
Regime C
Regime B
Regime A
3% (long-horizon)
$14.2
$16.9
$24.3
5% (Green Book)
$8.7
$10.3
$14.7
8% (TBS Central)
$4.6
$5.4
$7.6
10% (private capital)
$3.1
$3.7
$5.2
The corridor would impose an ongoing federal operating contribution of roughly $700 million to $1.3 billion per year over four decades, on top of the federal share of capital service. Adding capital service (federal share 50%, 6% blended cost of capital, 40-year amortisation) of ~$2.5B/yr at Low, $4.8B at Central, and $8.8B at High, the full annual federal cost at Regime B ranges from ~$3.3B to ~$9.6B per year — a full-cost-per-rider of $405 to $1,171, five to fourteen times the federal value-of-time benefit per rider.
Figure 5. Annual federal cost commitment by capex scenario, Regime B mature operations — capital service (federal share 50%, 6% blended cost of capital, 40-year amortisation) stacked with the $0.83B/yr operating subsidy. Total federal cash commitment ranges from $3.32B/yr at the proponent capex to $9.60B/yr at the upper reference-class capex. Per rider at 8.2M annual passengers, $405 to $1,171 — five to fourteen times the federal value-of-time benefit per rider. Real 2029 dollars.
7 · Economic Overlay & BCR
An order of magnitude below break-even
The economic overlay adds five benefit categories (passenger time savings, modal-shift GHG, accident reduction, local externalities) and one cost (embodied construction carbon). It is small relative to the financial cash flow: even at Regime A, the largest overlay of $1.94B is ~1/50th of the central financial NPV. It does not move the directional finding.
Table 8. Economic overlay components at 8% TBS ($B PV). The embodied-carbon debit of $2.48B is regime-invariant — it depends on corridor characteristics, not operating posture. Regime C’s total is slightly negative because passenger benefits at 6.1M pax don’t offset it.
Component
Regime C
Regime B
Regime A
Passenger time savings
$1.28
$1.72
$2.35
Modal-shift GHG savings
$0.10
$0.14
$0.19
Embodied carbon (debit)
($2.48)
($2.48)
($2.48)
Accident reduction
$0.88
$1.18
$1.61
Local externalities
$0.15
$0.20
$0.27
Total economic overlay
($0.07)
$0.76
$1.94
Table 9. Benefit-cost ratio at 8% TBS Central. All values an order of magnitude below the 1.0 break-even threshold. Corner-to-corner range 0.030 (High×C) to 0.107 (Low×A). The capex axis explains >80% of the variation; the regime axis <20%.
Capital cost scenario
Regime C
Regime B
Regime A
Low — $75B
0.092
0.106
0.107
Central — $143B
0.053
0.061
0.062
High — $264B
0.030
0.035
0.036
The most favourable cell anywhere — Low capex × Regime A — requires conjoining ALTO’s own optimistic capex with the deep-discount posture that maximises ridership; neither half is publicly committed to. Under the central reference-class capex, the highest achievable BCR is 0.062, about one-sixteenth of break-even. For context, the Ontario provincial HSR study of 2016 rejected a comparable 300 km/h scope at a reported BCR of 0.70 — this analysis finds the ALTO option materially worse than the level at which Ontario rejected comparable scope a decade earlier.
8 · The 24-Million Problem
A target outside the frontier
The 24-million-by-2055 figure in ALTO’s public materials sits outside the achievable frontier. The modal-shift ceiling is ~12 million annual passengers — at Regime A, capturing 40% of the addressable market. Reaching 24 million would require doubling modal share to ~80%, which means fares well below cost recovery plus structural changes to the corridor’s competitive position against car and air that go beyond any operating posture.
Figure 6. ALTO’s public ridership target vs. the modal-shift achievable frontier. The three regimes (C 6.1M, B 8.2M, A 11.2M) occupy the frontier between ~5 and 12 million; the cost-recovery break-even at 12.5M sits just outside the ceiling. ALTO’s 24-million target sits ~11.5 million passengers — nearly twofold — beyond the ceiling. The gap is not bridgeable under the modal-shift framework: it would require ~80% modal share against air and road, for which there is no precedent in the international HSR record on a comparable corridor.
The 24-million figure is therefore not a defensible operating point and is not modellable as a financial NPV under the regime framework. Public communication that pairs the 24-million target with operating-cost or subsidy figures drawn from other points on the frontier is internally inconsistent — the corridor cannot simultaneously achieve 24-million ridership and the operating subsidy of any regime on the frontier.
9 · Conclusions
The viability question is a capex question
Negative across every combination
Financial NPV ranges from −$55B to −$187B at 8%; the central case is −$102B. BCR runs 0.030–0.107 — every cell at least nine times below break-even. The probability of positive NPV under any defensible scenario is negligible.
Capital cost dominates
Low→High capex swings NPV by ~$130B at 8%; Regime C→A swings it by only ~$3B. The choice of operating regime is second-order once capital is committed. The first-order question is whether to commit the capital.
Operating subsidy is decoupled
Operating cost is driven by service intensity, not construction outturn — a corridor running 80 trains/day costs the same to operate whether built at $75B or $264B. The subsidy stream can be planned independently of the capital outturn.
An HPR review is warranted
The single largest lever for project economics is cost containment, and the reference class gives no basis for assuming ALTO beats it. An independent review of the High Performance Rail alternative — a lower-capex configuration delivering comparable user benefits over the same corridor — is warranted before any corridor-selection decision.
Proceeding with ALTO at any defensible parameter combination would impose a significant net cost on Canadian public finances over the analysis horizon, even after accounting for non-financial passenger and environmental benefits. The High Performance Rail framework — 200 km/h electrified passenger rail along the Highway 401 corridor, using existing rail corridor rather than greenfield HSR construction — would not attract the same reference-class capital premium, and an independent review should compare the two on the same NPV framework, with HPR producing materially less negative NPV and materially higher BCR across every defensible parameter combination.
The procurement and cost-control decision is by far the most consequential single decision affecting the corridor’s financial outcome. The choice of operating regime is substantive for transport policy but does not move the financial NPV by more than a few per cent. The viability question is a capex question.
Download Full Report
NPV Note 1 — NPV and BCR Projections for ALTO (PDF)
Reference document with all six figures, nine tables, the full methodology, and the parameter and reference appendices
The analysis is conducted from the project-sponsor perspective in real 2029 CAD over 2029–2080 (period 0 = 2029), counting direct cash flows: capex, operating cost, renewals, fare revenue, and terminal residual. Capex is allocated across 2029–2039 on an eleven-year S-curve (3% in 2029, peaking at 13% in 2034–35, tapering to 6% in 2039). Three renewals are modelled — signalling at operating year 20 (4% of capex), rolling stock at year 30 (12%), combined track-and-signalling at year 40 (8%) — and a terminal residual at 2080 of 40% of capex. Demand ramps from 50% of mature ridership in 2040 to 100% by 2047; real fare yield erodes 0.5%/yr.
Operating cost follows the engineering build: $1,381M fixed plus $26/train-km variable (equivalently $89.7M per million annual passengers at 450 seats × 65% load factor × 1,000 km), calibrated against the California HSR 2024 Business Plan O&M model, SNCF Réseau and SNCF Voyageurs reports, ADIF AV accounts, and the UIC LICB series. Capital cost scenarios ($75B / $143B / $264B) come from Flyvbjerg reference-class forecasting on the international HSR cost database (log-normal, mulog = 4.963, sigmalog = 0.312) with corridor-specific complexity adjustments. The economic overlay uses 1.75 h saved per trip at $25/h, modal-shift GHG of 113 kt/yr at the Regime B baseline valued at $250/t, embodied construction carbon of 14.69 Mt, accident reduction at $30/pax, and local externalities at $5/pax; network and agglomeration effects are excluded. The analysis is deterministic across the 36-cell grid; a probabilistic overlay would refine the central tendency but not change the directional finding.
Sources
Principal sources
1.
Treasury Board of Canada Secretariat. Canada’s Cost-Benefit Analysis Guide for Regulatory Proposals (2022) and Policy on Cost-Benefit Analysis — social opportunity cost of capital as the central 8% discount rate.
2.
HM Treasury (UK). The Green Book: Central Government Guidance on Appraisal and Evaluation (2022) — the 5% reference for long-lived infrastructure. — and Boardman, Moore & Vining, “The Social Discount Rate for Canada,” Canadian Public Policy 36(3), 2010.
3.
Flyvbjerg, B., Holm, M.K. & Buhl, S.L. — reference-class forecasting and the rail-project cost-overrun record (mean ~44.7% overrun): JAPA 68(3), 2002; JAPA 71(2), 2005; and Megaprojects and Risk (Cambridge, 2003).
4.
California High-Speed Rail Authority. 2024 Business Plan: Operations and Maintenance Cost Model. — UIC Lasting Infrastructure Cost Benchmarking (LICB); ADIF AV Management Report 2022; SNCF Réseau and SNCF Voyageurs Rapport financier annuel 2024.
5.
Transport Canada. High-Speed Rail Initiative briefing materials, Section 08 (2025–2026). — ALTO Fast Forward (Cadence consortium, March 2025); ALTO Pre-Development Agreement (signed 19 March 2025).
6.
European Court of Auditors. A European high-speed rail network: not a reality but an ineffective patchwork. Special Report 19/2018.
How hard is the ALTO corridor to build — and why the answer decides whether its cost forecast can be trusted?
ALTO HSR Citizen Research Initiative · Engineering Methodology Brief · Published May 2026
◆ Engineering-Complexity Methodology
Cost forecasts for major rail projects are usually defended by comparison: the proponent points to a built line elsewhere, cites its per-kilometre cost, and applies it here. The comparison only holds if the two corridors are genuinely alike in how demanding they are to build. Most of the time, that question is never asked explicitly.
This brief sets out a way to ask it. A ten-dimension rubric scores the engineering complexity of any high-speed corridor on a common 100-point scale, so that a proposed project can be placed against a worldwide database of built and under-construction lines. The point is not to produce a single number, but to make the comparator-selection step — the step where cost forecasts quietly succeed or fail — auditable.
Critical Finding
Scored against the rubric, the ALTO corridor reaches a composite of 82 out of 100 — in the Extreme band (81–100), and the highest of fourteen corridors in the worldwide reference database, seven points above the next-highest (California HSR, 75). No corridor at a comparable score has finished construction. ALTO therefore sits outside the range for which directly comparable delivery precedent exists.
This matters for one reason above all: under reference-class forecasting, a project without a dimensionally matched precedent cannot be reliably costed from international benchmarks. A forecast built by borrowing the per-kilometre cost of a European or East Asian line scoring in the 40s or 50s will systematically understate what an Extreme-band corridor should be expected to cost.
The ten-dimension framework, the five-level descriptors, the weighting rationale, the two composite indices, and the illustrative application across thirteen reference corridors
The rubric applied dimension-by-dimension to the proposed ALTO corridor, with evidence, exposure-adjusted analysis, reference-class comparison, and sensitivity scenarios
The rubric scores a corridor on ten dimensions, grouped into four natural clusters: the ground and climate the corridor must cross (subgrade, bedrock, hydrology, climate); the geometry and hazard of the terrain (topographic relief, seismic and geohazard exposure); the environment and community it encounters (ecological footprint, heritage and Indigenous-rights constraints); and the corridor as a delivery and integration project (land acquisition, urban engineering content).
Each dimension carries a weight reflecting its typical role in driving capital-cost dispersion across the reference class. Four cost-dominant dimensions — bedrock, climate, topography, and urban engineering — carry the maximum weight of 15 each. Subgrade and hydrology carry 10. The remaining four carry 5. The weights sum to 100, so the composite reads directly as a score out of 100. Each dimension is then scored on a granular scale up to its weight, against five descriptor levels: Minimal, Low, Moderate, High, and Extreme.
20–60
Low to Moderate — routine to standard HSR engineering
most commissioned European and East Asian lines
61–80
High — multiple elevated dimensions; reference-class forecasting essential
Extreme — frontier engineering on several dimensions at once
few or no directly comparable precedents
The rubric reports two composites that answer different questions. The Peak Severity composite sums the granular scores, treating a dimension as fully present wherever its worst severity appears on the alignment — it characterises the engineering capability the corridor must provide at its most demanding locations. The Exposure-Adjusted composite scales each dimension by the fraction of corridor length at which that peak severity is actually present — it characterises the aggregate engineering burden spread across the whole route. Both are reported, because both bear on cost and schedule.
Why this matters
The rubric’s primary purpose is to discipline comparator selection. The standard failure mode in infrastructure forecasting, identified in the reference-class literature, is anchoring a forecast on favourable comparators while omitting the corridors whose complexity profile actually matches the proposed project. Explicit scoring against ten dimensions makes that selection step visible and checkable — only corridors with a similar dimensional profile are admitted to the reference class.
The Application · ALTO
The ALTO corridor scores 82 — Extreme
Applied to the proposed ALTO corridor, the rubric returns a Peak Severity composite of 82 out of 100. The complexity is not attributable to any single factor; it arises from the simultaneous presence of multiple elevated dimensions across the ground, climate, environment, and land-acquisition clusters — the rubric’s definition of frontier engineering. Three dimensions reach their maximum, and two more sit at granular “High-plus” levels between the High and Extreme descriptors.
Composite 82 / 100 — Extreme band (81–100). Three dimensions at maximum (subgrade, ecological, greenfield integration); two at High-plus (bedrock, climate). Bars show score as a fraction of each dimension’s weight.
The two maximum scores that most distinguish ALTO are the subgrade dimension (10/10) and the greenfield land-acquisition dimension (5/5). The corridor traverses extensive Champlain Sea sensitive marine clay — Leda clay — across the Ottawa and St. Lawrence lowlands, a class named explicitly in the rubric’s top descriptor and associated with documented historical quick-clay failures. And the southern alignment is predominantly greenfield through actively farmed land, with property interests expected to number in the tens of thousands. The ecological dimension also scores at maximum: federally listed endangered species with designated critical habitat, a UNESCO biosphere reserve traversal, and significant wetland complexes.
An interaction the score does not capture
The composite treats dimensions as independent, but one coupling on ALTO deserves explicit attention: the interaction of maximum subgrade sensitivity (10/10) with elevated geohazard exposure (4/5). Ground-improvement works in sensitive clay can themselves destabilise marginally stable slopes — a failure mode with Canadian precedent. This is not reflected in any linear composite and should be treated as an explicit risk-register item, not a footnote.
The Comparison
Highest of fourteen corridors — and alone in the Extreme band
Ranked against the worldwide database, ALTO occupies the top position by composite engineering complexity, and is the only corridor of the fourteen to fall in the Extreme band. The seven-point gap to California HSR crosses the High–Extreme boundary — a more substantive difference than the raw number suggests, because it marks the line beyond which directly comparable delivery precedent runs out.
Corridor
Composite
Band
TGV Sud-Est, Paris–Lyon (1981)
44
Moderate
Madrid–Sevilla AVE (1992)
50
Moderate
Beijing–Shanghai HSR (2011)
56
Moderate
HS1, London–Channel Tunnel (2007)
61
High
HS2 Phase 1 (under construction)
63
High
Tokaido Shinkansen (1964)
66
High
Harbin–Dalian HSR (2012)
68
High
California HSR (under construction)
75
High
ALTO (proposed)
82
Extreme
Selected corridors from the fourteen-corridor reference class. Full thirteen-corridor table in CAPEX Note 2.
The comparison also shows why no single line is a clean match. California HSR’s complexity concentrates on seismic, topographic, and urban dimensions — factors well understood in California practice — but it does not face ALTO’s maximum subgrade and greenfield-integration scores. Harbin–Dalian is the nearest cold-climate reference, but it did not encounter sensitive marine clay. Ostlänken, in Sweden, is the closest analogue on ground conditions and climate, sharing the sensitive-clay and shield-bedrock profile — but not ALTO’s Extreme ecological footprint or the cold-climate severity of eastern Quebec. No reference corridor combines ALTO’s pattern of maximum subgrade, ecological, and greenfield-integration scores.
A Fair Reading
Concentrated, not uniform — the exposure-adjusted view
The Peak Severity composite of 82 treats a dimension as fully present wherever its worst severity appears. But ALTO’s complexity is not uniformly distributed: Leda clay occupies a majority of the corridor, while the hard-rock Frontenac Arch crossing is concentrated in roughly 40 km and urban engineering is confined to four metropolitan termini. The Exposure-Adjusted composite, which scales each dimension by the share of corridor length at which its peak severity is present, comes to 73 out of 100 — in the upper High band, nine points below the Peak Severity figure.
The gap between the two indices is itself the finding: it quantifies how much of ALTO’s complexity is concentrated rather than spread along the whole route. The dimensions with the largest downward adjustment — bedrock, urban engineering, and ecological — are real, significant engineering burdens, but ones concentrated in specific segments. Reported honestly, both numbers belong in any cost forecast: Peak Severity drives the design-capability case for independent peer review; Exposure-Adjusted informs the corridor-scale cost envelope.
The 82 is also presented as a conservative baseline, not a worst case. The scoring follows a stated conservatism principle — where evidence straddles two levels, the lower score is taken unless the higher is documentably met. Six dimensions are identified where fuller review could justify an upgrade; if all six conditions were met, the composite would rise to 92. The defensible range is therefore 82–92 — all of it within the Extreme band.
The Alternative
Where the High Performance Rail alternative changes the score
The complexity score is not a fixed property of the route — it is a property of this design choice for the route. The High Performance Rail (HPR) alternative is structured to avoid the most consequential maximum-score dimensions by design, and a parallel scoring of HPR against the same rubric is recommended as a companion exercise. Preliminary assessment places it in the Moderate-to-High transition, a range for which the database provides abundant delivery precedent.
Land acquisition (D9): 5/5 → toward 2/5
Greenfield land acquisition — ALTO’s maximum-score dimension — is substantially replaced by upgraded use of shared existing corridors, removing the tens-of-thousands-of-property-interests problem that places ALTO at the Extreme archetype.
Subgrade & ecology (D1, D7): materially mitigated
Following existing corridors means the sensitive-clay and critical-habitat crossings have, in large part, already been engineered or disclosed — rather than encountered fresh along a new greenfield alignment.
Urban engineering (D10): unchanged
HPR uses the same existing urban rail corridors into the same metropolitan termini, so urban engineering content stays at or below its current score — a useful reminder that the alternative is not a free lunch on every dimension.
The Honest Answer
What does an Extreme score oblige?
The rubric is explicit on this point, and it is not a matter of opinion: an Extreme-band project requires independent peer review and reference-class forecasting as mandatory, not discretionary. These are the mechanisms by which a frontier-engineering project is costed responsibly. They are not discharged by a public consultation, nor by a standard environmental assessment.
The primary governance finding of the scoring exercise is the absence of those mechanisms from the current procurement trajectory. That is not, in itself, a verdict that the corridor should not be built. It is a statement that the cost number attached to it cannot yet be relied upon — because the discipline that would make an Extreme-band forecast trustworthy has not been applied to it.
This is the same shape of argument the Initiative’s financial work makes elsewhere: the question is rarely whether a number is high or low, but whether the method behind it can be audited. A reader who knows the corridor scores in the Extreme band can ask, of any cost forecast presented for it, which comparators were used — and whether they were dimensionally matched, or merely favourable.
For the Next Cost Estimate
Three questions to ask of any HSR cost forecast
Each follows directly from the rubric. None presupposes opposition to any project. Each is the kind of question the method requires to be answered before a cost figure can be trusted.
1. Which comparators were used — and what do they score?
A forecast anchored on lines scoring in the 40s or 50s is borrowing the cost of a fundamentally less demanding corridor. Ask for the complexity score of each comparator, and whether any of them is dimensionally matched to the proposed corridor rather than simply convenient.
2. Has independent peer review and reference-class forecasting been done?
For an Extreme-band corridor these are mandatory, not optional. If they have not been performed, the cost estimate is provisional by definition, however precise the headline figure looks.
3. Have the interaction effects been costed, not just the dimensions?
The composite treats dimensions as independent; real corridors do not behave that way. For ALTO specifically, the subgrade–geohazard coupling — remediation works in sensitive clay potentially triggering slope failures — belongs on the risk register as an explicit line item.
None of these questions presupposes a view about whether the corridor should be built. Each is the kind of question a reasonable reader would ask before forming one — and each is a question the published cost materials have so far not been pressed to answer in the terms the method requires.
Sources
The two notes and their evidence base
This brief synthesises the two engineering-complexity notes produced by the Initiative. Both are available in full below, with the complete descriptors, weighting rationale, dimension-by-dimension evidence, exposure analysis, and sensitivity scenarios summarised here.
1.ALTO HSR Citizen Research Initiative, CAPEX Note 1: Engineering Complexity Rubric v1.0, April 2026 — the ten-dimension framework, five-level descriptors, weighting rationale, the Peak Severity and Exposure-Adjusted indices, and the illustrative application across thirteen reference corridors.
2.ALTO HSR Citizen Research Initiative, CAPEX Note 2: ALTO Engineering Complexity Scorecard, April 2026 — the rubric applied to the ALTO corridor, with dimension-by-dimension evidence, exposure-adjusted analysis, reference-class comparison, and the 82–92 sensitivity range.
3.Reference-class forecasting method — Flyvbjerg and colleagues on demand- and cost-forecast accuracy in transport megaprojects, and the reference-class forecasting procedure for disciplining comparator selection.
4.Primary evidence datasets — Ontario Geological Survey and Geological Survey of Canada (geology); Natural Resources Canada 2020 seismic hazard model (seismic); Species at Risk Public Registry (species); UNESCO MAB and Ontario Parks (protected areas), as cited per dimension in CAPEX Note 2.
5.ALTO HSR Citizen Research Initiative, Reading the Footnote (Cost Estimation Brief), May 2026 — the companion brief on the AACE Class 5 classification and what it implies for the $60–90 billion figure.
6.ALTO HSR Citizen Research Initiative, The Cost of Running the Train (Operating-Cost Brief), May 2026 — the recurring-cost companion to this capital-cost analysis.
The single equation every operating rail corridor has to balance — and what it tells us about ALTO.
ALTO HSR Citizen Research Initiative · Methodology Brief · Published May 2026
◆ Foundational Framework
Most public discussion of major rail projects gets lost in the detail of individual numbers — capital cost, ridership, ticket price, subsidy, projected GDP impact. Each is presented as a standalone claim, defended or contested on its own terms. The result is a debate that produces heat without resolution.
There is a simpler approach. Every operating rail corridor in the world, public or private, has to balance the same equation every year. The five terms in that equation are not negotiable; the equation is an accounting identity. What is negotiable is which terms are filled in, which are left implicit, and which are quietly set to zero by the proponent’s framing.
Critical Finding
Every operating rail corridor has to balance the same five-term equation every year. Choose any three of the four right-hand terms, and the fourth is fixed by arithmetic — not by political assertion. ALTO’s published materials supply numbers for some of the five terms, leave others implicit, and assume one — land value capture — is zero. The result, when written out, does not balance.
This brief sets out the equation, walks through what anchors each of its five terms, and applies it to ALTO. The point is not to settle the project on a single number. It is to give the reader a structure for reading any major rail project’s published materials and asking the simple question: do the numbers balance?
Download Full Methodology Paper
A Framework for Independent Evaluation of the ALTO HSR Project (PDF)
The annual fiscal ledger framework, the seven-stage analytical pipeline, and the supporting research notes underpinning each ledger term — the full apparatus this brief summarises
In words: the cost of running the corridor in a given year — debt service on the capital outlay, plus operations and maintenance, plus the periodic replacement of the train fleet — must equal the revenue collected from those who ride, plus the public subsidy required to close any remaining gap, plus whatever supplementary revenue is captured from land value uplift around stations.
The identity is an accounting truism. What makes it analytically useful is that each of its five terms is independently anchored. None can be set at will. Each has a defensible value that emerges from a specific empirical or engineering methodology, rather than from political assertion. A claim that does not specify all five terms is incomplete by construction.
The five terms group naturally into three sections. The cost side has two: capital service and operating cost. The earned revenue side has one: farebox. The gap-closing section has two: public subsidy and land value capture. Each section is anchored by a distinct methodology, and each gives a particular reader a particular handle on the project.
Section 01 · The Cost Side
What it costs to run the corridor each year
The two cost terms — capital service and operating cost — are anchored by entirely separate methodologies. Both have to be answered before any debate about ticket prices or ridership begins.
~$4.9B
annual capital service at the proponent-stated capex
$75B capex, 5% / 30-yr CRF
~$9.3B
annual capital service at the reference-class central capex
$143B central RCF estimate
~$2.15B
annual operating cost: O&M + fleet capital
Stage 4 bottom-up at MID service
Capital service (Capex × CRF) is the annual cost of paying back the capital outlay. It is the capital expenditure multiplied by the capital recovery factor, which reflects the cost of capital and the amortisation period. At the proponent-stated $75 billion capex and a representative 5% / 30-year CRF, this is approximately $4.9 billion per year. At the reference-class-adjusted central capex of $143 billion — derived from international cost-overrun patterns calibrated by the corridor’s engineering and community complexity — the same calculation produces approximately $9.3 billion per year.
Operating cost (O&M and fleet capital) is the annual recurring cost of running the corridor, built bottom-up from corridor asset inventory and service-level inputs across three streams: infrastructure maintenance and renewals, operating categories (traincrew, traction energy, station operations, network control, commercial, insurance, general overhead), and the periodic replacement of trainsets. At MID service intensity this produces approximately $2.15 billion per year — $1.27 billion in infrastructure maintenance, $700 million in operations, and $180 million in fleet capital recapitalisation. International comparators (SNCF Réseau, Network Rail HS1, California HSRA, Spanish ADIF) are used at the end of the build for cross-validation, not as the primary estimating method.
The crucial methodological point: operating cost is built independently of capital cost. The bottom-up engineering estimate of recurring annual cost does not depend on whatever capex figure the proponent adopts. It is therefore independent of the optimism bias that pervades capital cost estimation in the cost-overrun reference class.
Why this matters
A reader who is told only the capital cost has been given half the cost picture. A reader who is told operating cost will be covered by farebox has been given an answer that depends on the next section. Neither of these is a complete account of the cost side of the ledger.
Section 02 · The Earned Revenue
What the corridor can actually sell
The earned revenue side of the ledger has one term: farebox. It is the only revenue source that can in principle be raised by selling something to a willing buyer; everything else on the right-hand side is either a transfer from the treasury or a charge on third parties.
~$1.3B
annual farebox revenue at the welfare-efficient operating point
Regime B: ~8M riders at fare parity with air
5–12M
annual ridership envelope across the operating-regime spectrum
Stage 5 modal-shift frontier
24–43M
ridership figures in ALTO’s published materials
all sit outside the achievable frontier
Farebox revenue (Ridership × Fare) is the product of two variables that cannot be chosen independently. Raising fares reduces ridership along the air-rail and road-rail modal-shift S-curves; lowering fares reduces revenue per rider. The achievable combinations of ridership, fare, and corresponding subsidy lie on a one-dimensional frontier through a four-variable space. Choose any one variable, and the other three are fixed by the modal-shift relationships and the corridor’s demographics.
For ALTO, the modal-shift frontier produces three discrete operating regimes. Regime A (heavy subsidy, deep fare discount to air) lands at approximately 12 million annual riders, $5 billion annual operating subsidy. Regime B (welfare-efficient, fare parity with air) lands at approximately 8 million annual riders, $2 billion annual operating subsidy, with peak fare revenue of approximately $1.29 billion. Regime C (minimal subsidy, yield-managed premium fare) lands at approximately 5 million annual riders, $1 billion annual operating subsidy.
The Government’s published ridership figures — 24 million annually in some materials, 1.21 billion trips over the first 40 years (averaging approximately 30 million annually) and 43 million annually by 2084 in the Q-923 reply — all sit outside this achievable frontier. The reply’s $100 billion fare-revenue projection over the same forty-year window implies an average fare of approximately $83 per trip, a (fare, ridership) pair the modal-shift framework does not produce.
Why this matters
A claim that pairs a ridership figure with no specified fare, or a fare with no specified ridership, is not internally consistent. The two are linked by the corridor’s modal-shift mathematics. The frontier is the single-degree-of-freedom constraint that makes this so — and it is the analytical reason ALTO’s headline ridership figures cannot be defended on the modal-shift evidence.
Section 03 · The Gap Closers
What closes the gap between cost and earned revenue
If farebox revenue does not equal cost — and at every operating point on the modal-shift frontier for ALTO, it does not — the gap has to be closed by something. Two instruments are available.
$3.6–10.2B
implied annual public subsidy across the cost and operating-regime range
the residual that closes the ledger
5–15%
share of capital service typically funded by LVC in international comparators
HS1, Crossrail, MTR, Japan
$0
land value capture under ALTO’s currently published scope
no disclosed LVC instrument
Public subsidy is the dominant gap-closer in every operational HSR network in the world. Every HSR system except the four highest-density Japanese and Chinese trunks operates with a structural annual operating subsidy on top of capital service support. Even those four required the full capital outlay from public funding. Public subsidy is the residual term in the ledger: whatever closes the gap between annual cost and the sum of farebox plus LVC. It is bounded below by zero (the corridor cannot pay passengers to board) and above by total cost.
Land value capture is the only large-scale supplementary mechanism with an empirical track record. The known instruments — HS1’s station-area development uplift, Crossrail’s Business Rate Supplement, Hong Kong’s MTR Rail+Property model, Japan’s private-railway joint development arrangements — produce typically five to fifteen per cent of capital service requirements across these comparators. The remainder, in every case, closes through public subsidy.
ALTO’s published materials disclose no LVC mechanism. Bill C-15 (the High-Speed Rail Network Act) provides streamlined expropriation and right-of-first-refusal authority but no betterment levy, tax-increment financing district, special assessment district, joint development framework, or air-rights regime. The forecast 60,000 to 63,000 new residential units around stations is invoked as a downstream property-tax benefit accruing to municipalities — not as a financing source for the corridor. The Senior Director, Commercial and First Nations Financial Participation role addresses Indigenous equity in Alto itself, not station-area land value capture.
Under the current published scope, therefore, the LVC term is zero. The entire gap closes through public subsidy.
Why this matters
A claim that does not name a mechanism for closing the gap is implicitly claiming that public subsidy will close it. A claim that the corridor will be “self-sustaining” is a claim about a specific term — operating cost coverage by farebox — that says nothing about the much larger term of capital service. The reader who treats “self-sustaining” as a description of the project’s lifetime public cost is reading it against the narrowest available technical definition.
Side by Side · ALTO’s Ledger
The published numbers, written out
Plug ALTO’s published numbers into the equation. The result, in central-case figures for the full corridor at maturity, looks like this:
Ledger term
What ALTO has disclosed
Capex × CRF — annual capital service. At the proponent-stated $75B capex and a representative 5% / 30-yr CRF, approximately $4.9B per year. At the reference-class central capex ($143B), approximately $9.3B per year.
ALTO has disclosed the capex range ($60–90B, AACE Class 5), but has not disclosed the annual capital service figure or the amortisation assumption behind it. The Q-923 reply addressed in Reading the Answer describes operations as “self-sustaining”, a claim that is silent on capital service.
Term status:Capex disclosed, debt service not
O&M and fleet capital — annual operating cost, built bottom-up from corridor asset inventory at MID service: ~$2.15B per year.
ALTO refers in Q-923 to bottom-up O&M built from operational benchmarks and lifecycle profiles, but no figure has been published. The Stage 4 bottom-up engineering estimate in the methodology paper supplies a defensible ~$2.15B per year.
Term status:Method described, figure not disclosed
Ridership × Fare — annual farebox revenue. At the welfare-efficient operating point (Regime B), approximately $1.29B per year.
ALTO has disclosed multiple, non-reconciled ridership figures (24M annually, 30M average over forty years, 43M by 2084). Average implied fare of ~$83 per trip from the Q-923 $100B / 40-year revenue figure sits outside the corridor’s achievable modal-shift frontier.
Term status:Ridership figures non-reconciled and off-frontier
Land value capture — supplementary revenue from station-area land value uplift. International comparators fund 5–15% of capital service this way.
No disclosed mechanism. The forecast 60,000–63,000 new residential units around stations is invoked as a downstream property-tax benefit accruing to municipalities, not as a financing source. The LVC term is zero by default.
Term status:No mechanism disclosed
Public subsidy — the residual that closes the gap. With LVC at zero, this is approximately $5.76B per year at proponent-stated capex; approximately $10.16B per year at the reference-class central.
Not disclosed in any form. The Q-923 reply asserts operations will be “financially self-sustaining” and “eliminating the need for ongoing operating subsidies.” That framing speaks to the operating cost term, which is the smaller of the two cost terms. It does not speak to the capital service term, which is approximately twice as large.
Term status:Not disclosed; framed as zero
At the reference-class central capex of $143 billion, the implied annual subsidy rises to approximately $10.16 billion. At the proponent-stated capex but the high-ridership operating regime (Regime A), the implied subsidy is approximately $3.6 billion per year — lower than the welfare-efficient case because Regime A places a heavier subsidy directly on the operating account, with a larger fare-revenue base offsetting some of it.
None of these subsidy figures appears in ALTO’s published materials. None appears in the Government’s response to Order Paper Question Q-923. The framing speaks to the operating cost term, which is the smaller of the two cost terms. It does not speak to the capital service term, which is approximately twice as large.
The Honest Answer
Does the equation balance?
Not in any of the operating regimes the modal-shift frontier permits. The corridor at any defensible operating posture produces fare revenue substantially below the sum of capital service and operating cost. The gap, in central-case figures, is between $3.6 billion and $10.2 billion per year — corresponding to a 60-year present value, at standard social discount rates, of roughly $80 billion to $230 billion.
This is not, in itself, an argument against the project. Most large infrastructure projects in most countries close their gaps through public subsidy and have done so since the nineteenth century. The question is not whether the gap exists — the equation guarantees that it does — but whether the gap is being honestly disclosed and whether the public benefit justifies its size.
The first half of that question can be answered by reading the published materials carefully. The second half is the political-economy judgment that the institutional process is supposed to support.
What the methodology developed here does is make the first half answerable. The equation forces the disclosure. Every term is independently anchored, and a published claim that does not specify all five terms is incomplete by construction. A reader who knows what the equation looks like can ask, at every turn, what the missing terms are.
For the Next Federal Statement
Three questions to ask of any major rail project
Each question follows naturally from the ledger framework. None presupposes opposition to any project. Each is the kind of question the equation requires to be answered before any reader can form a judgment.
1. On the cost side
What is the annual capital service figure at the stated capex, and over what amortisation period? What is the annual operating cost figure at the planned service level? Are the two reported separately, or aggregated under a single label that conflates them?
2. On the revenue side
At what fare is the stated ridership achievable on the relevant modal-shift S-curves? Does the (fare, ridership) pair sit on the corridor’s achievable frontier, or does it require modal-shift behaviour the international evidence does not support?
3. On the closing terms
What is the implied annual public subsidy at the stated capex, operating cost, and farebox revenue? Is land value capture being assumed as a financing source? If so, through what disclosed instrument? If not, is the LVC term acknowledged to be zero, and the subsidy term enlarged correspondingly?
None of these questions presupposes a view about whether ALTO should be built. Each is the kind of question a reasonable reader would ask before forming a view. Each is also the kind of question the parliamentary record has so far not been pressed to answer in the terms the equation requires.
Sources
Methodology and supporting documents
This brief is a synthesis of the analytical methodology developed in the Initiative’s full methodology paper, A Framework for Independent Evaluation of the ALTO HSR Project (May 2026). The methodology paper contains the detailed derivations, reference-class calibrations, and stage-by-stage rubrics summarised here.
1.ALTO HSR Citizen Research Initiative, A Framework for Independent Evaluation of the ALTO HSR Project (Methodology Paper), May 2026 — the annual fiscal ledger framework, Section 2; the seven-stage analytical pipeline, Sections 3 through 7.
2.Capital service calibration — CAPEX Notes 1 through 4: Engineering Complexity Rubric; ALTO Engineering Complexity Scorecard; Community Friction and HSR Cost (international comparative analysis); Engineering Complexity and Community Friction as joint predictors of HSR cost.
3.Operating cost — O&M Notes 1 through 3: Infrastructure Maintenance Costs for HSR; Operating Costs for HSR; Combined Cost Recovery for ALTO HSR.
4.Modal-shift frontier — MS Notes 1 through 4: Air-rail modal-shift S-curve; Road-rail modal-shift S-curve; ALTO HSR ridership envelope 2035–2080; Subsidy frontier and optimisation.
5.Land value capture analysis — Methodology Paper, Section 2 (LVC paragraph); LVC Note 1 (assessing the $12 billion claim in the McGill TRAM financial model).
6.Order Paper Question Q-923, 45th Parliament, 1st session. Asked by Philip Lawrence MP (Northumberland–Clarke), March 5, 2026; answered by the Minister of Transport, April 22, 2026; reply signed by Mike Kelloway, Parliamentary Secretary. ourcommons.ca
7.ALTO HSR Citizen Research Initiative, Reading the Answer (Cost & Ridership Brief), May 2026 — the companion brief reading the three numerical claims in Q-923 against the academic record.
8.ALTO HSR Citizen Research Initiative, Reading the Footnote (Cost Estimation Brief), May 2026 — the companion brief on the AACE Class 5 classification and what it implies for the $60–90 billion figure.
9.ALTO HSR Citizen Research Initiative, The Report That Vanished (Parliamentary Process Brief), May 2026 — the parliamentary record into which the Q-923 reply was placed.