Tag: optimism bias

  • Procured and then

    ALTO HSR Citizen Research Initiative · Brief · September 2026

    Procured, and Then?

    ALTO commissioned the outside view. Whether it changed anything is the one question the record does not answer.

    In Plain Language

    The standard fix for over-optimistic infrastructure forecasts is to check them against what comparable projects actually cost and carried, rather than trusting the project’s own bottom-up numbers. That check is called reference-class forecasting, and ALTO commissioned one. It hired the firm founded by the researcher who developed the method.

    That is to ALTO’s credit. But commissioning a check and acting on it are different things, and only one document would show which happened: a comparison putting ALTO’s own published figures beside the ones the check produced. The Initiative asked for that record. The response was extended to 18 September 2026, with notice that a third party would be consulted — a step the Act provides for where an institution intends to release records that may contain a supplier’s commercial information.

    Meanwhile, in June 2026, ALTO published two studies putting large dollar values on the project’s benefits. Neither sets those benefits against what the line would cost. This brief looks at all three documents and asks what they show about how the project’s numbers are being assembled — and what a single unredacted release would settle.

    Download
    Procured, and Then? (PDF)
    The full brief, with sources
    Download PDF
    Related
    HPR Research Report, Chapter 1
    The forecasting framework this brief applies, set out in full
    Read Chapter 1
    01 · The Instrument

    ALTO commissioned the outside view

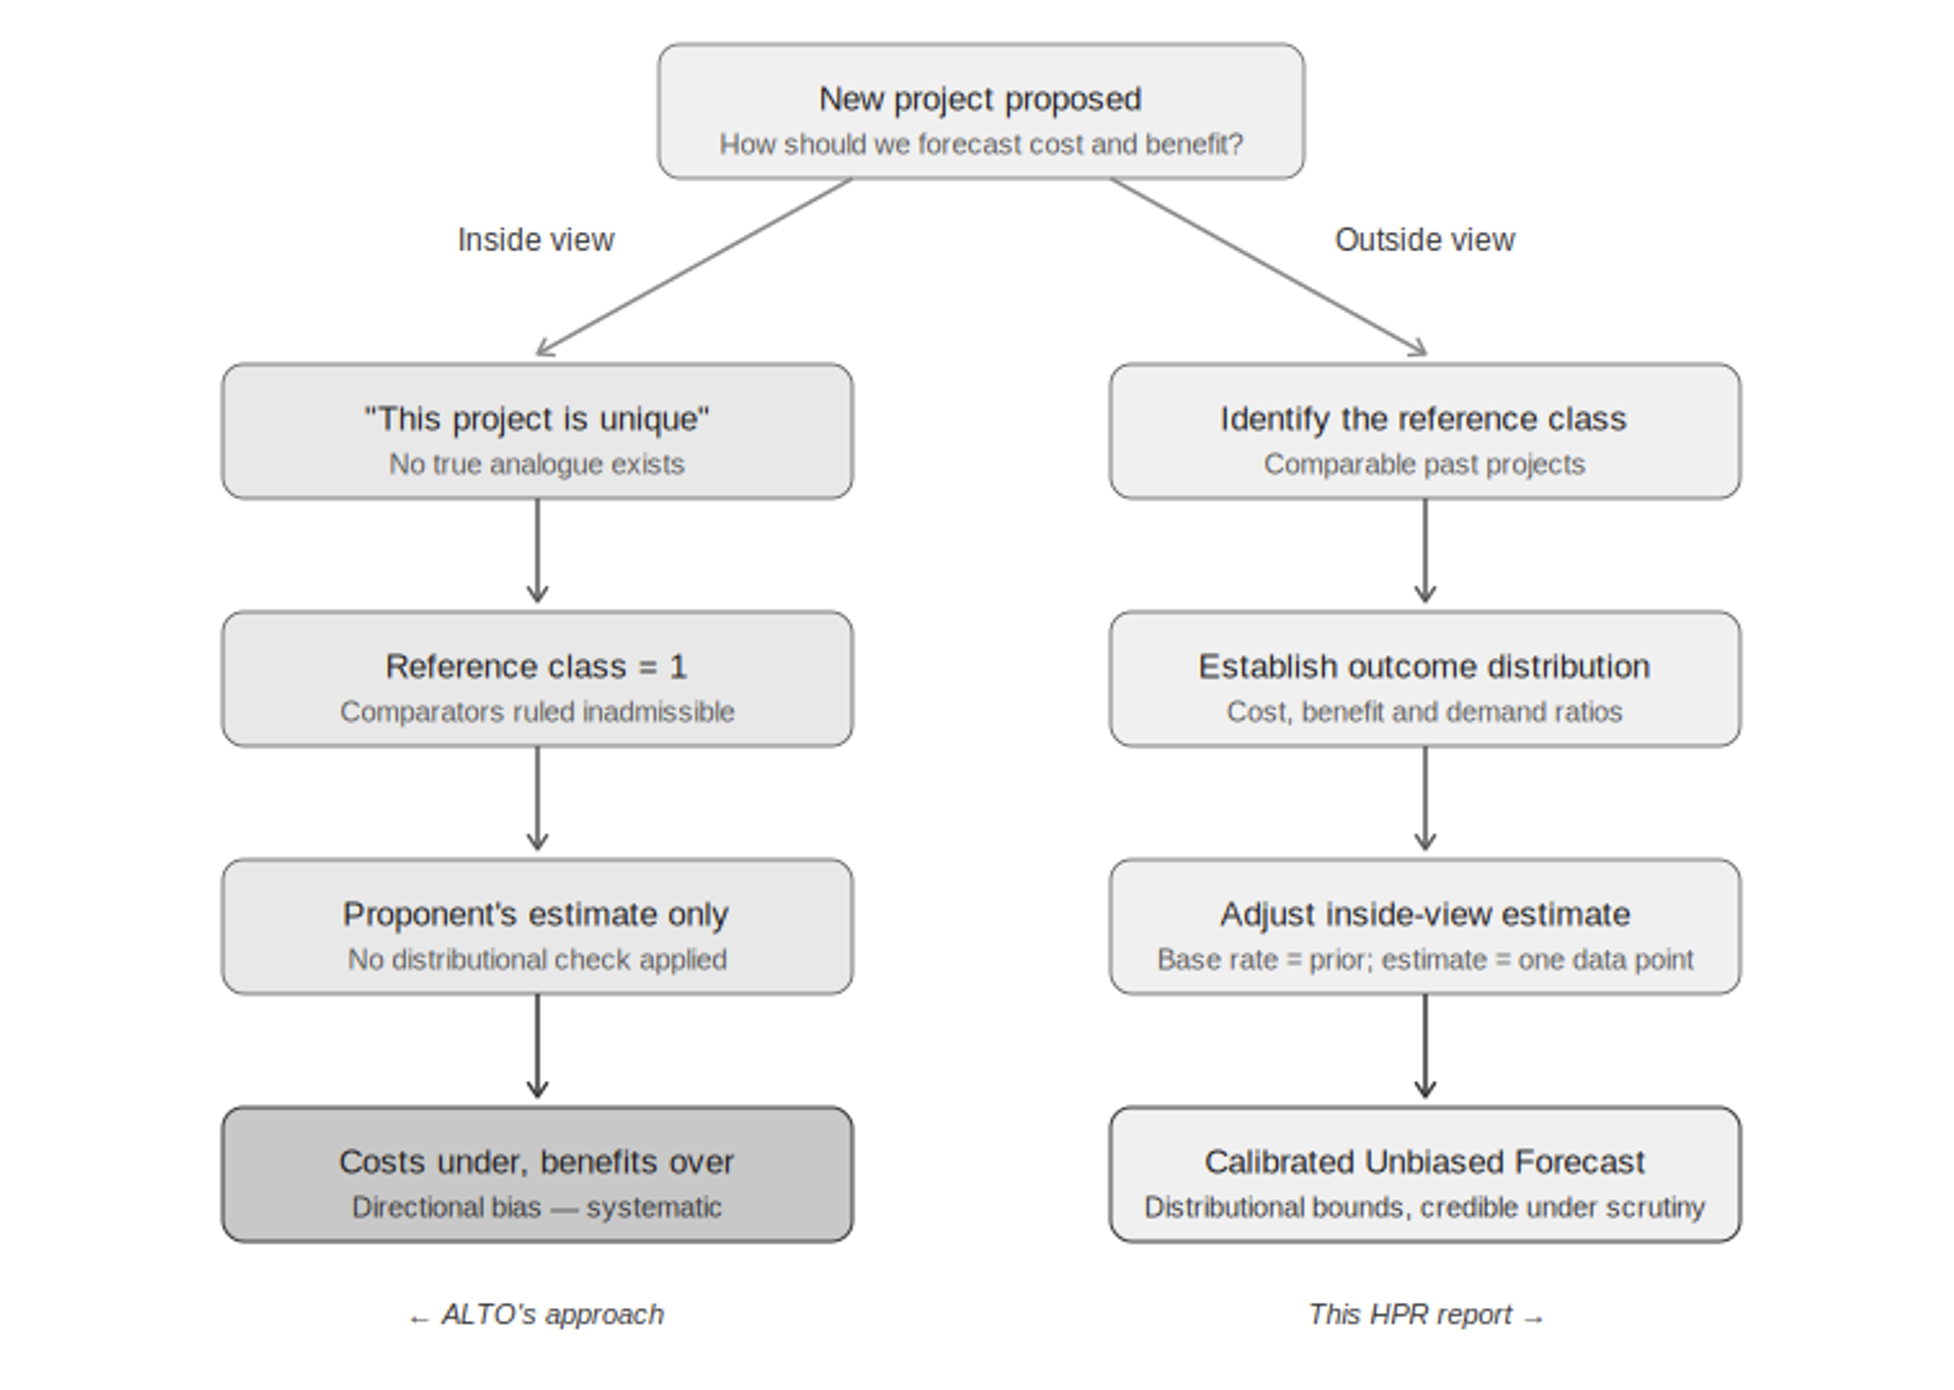
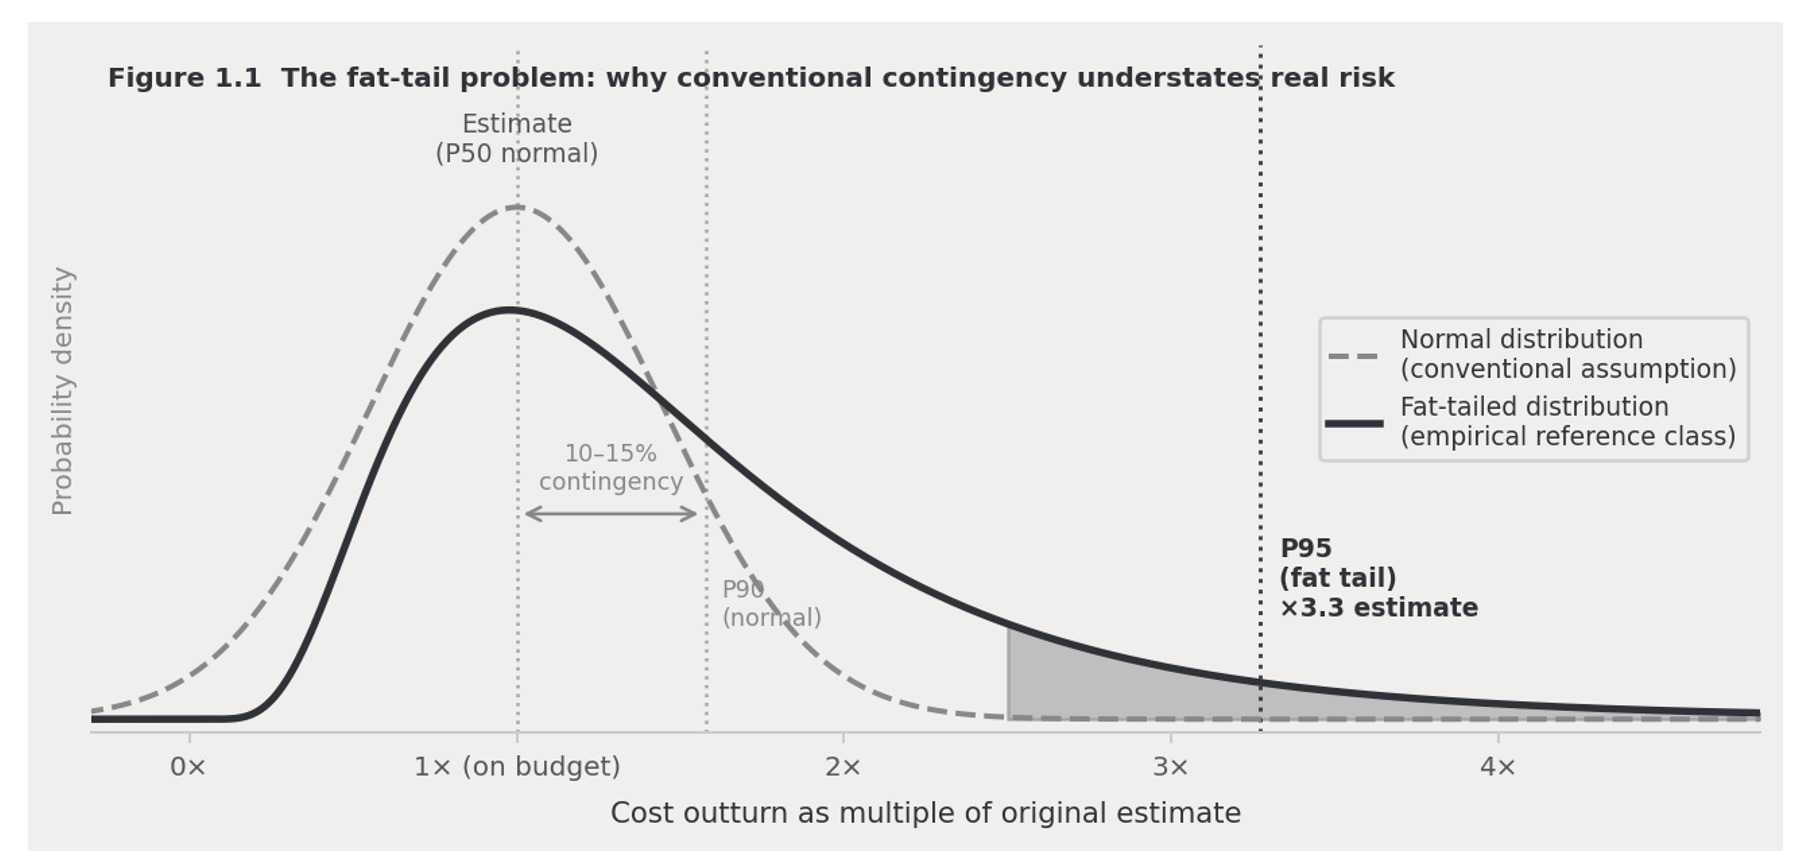
    Chapter 1 of the HPR Research Report sets out the method this brief relies on, so it is only summarised here. Large infrastructure forecasts miss in a consistent direction: costs come in high, benefits come in low. The established corrective is to stop treating a project as unique and instead compare it against the recorded outcomes of projects like it. The technique has a name — reference-class forecasting — and a literature behind it.

    In 2024 ALTO issued an advance contract award notice, PAS240625-002-00, for reference-class forecasting, should-cost and should-schedule modelling, and a series of Challenge Boards. An advance contract award notice is the instrument used when a department intends to award without competition, on the basis that only one supplier can do the work. The named supplier was Oxford Global Projects, the consultancy founded by Bent Flyvbjerg and Alexander Budzier.

    This is worth stating plainly, because it cuts against the easy criticism. ALTO did not ignore the outside view. It went out and procured it, from the people who developed it.

    02 · The Question

    Buying the instrument is not the same as letting it bind

    Reference-class forecasting corrects a forecast only if the number it produces is permitted to move the decision. A should-cost that is commissioned, delivered and then filed next to an unchanged inside-view estimate has not corrected anything. The method’s own literature is explicit that the failure mode is not the absence of the outside view but its subordination — the number produced, and then declined.

    So the decisive record is not the existence of the forecast. It is the comparison: does ALTO’s published capital cost reflect its own reference-class should-cost, or diverge from it? One document would answer that — the inside view and the outside view set side by side.

    A test, not an accusation

    This yields something better than a claim about anyone’s conduct: a prediction that can be checked. If the commissioned reference-class figures are more conservative than the numbers ALTO has published, the outside view was procured but not applied. If they match, the Initiative’s cost critique weakens accordingly.

    We do not know which. Nothing in this brief asserts that ALTO set the analysis aside. The point is that the question is answerable, that a single document answers it, and that the document exists.

    03 · The Clock

    The record will arrive after the decision has moved on

    The Initiative requested the reference-class records under access to information — the workbook, the should-cost and should-schedule outputs, and above all any document setting the inside view beside the outside view. Request A-2026-0004 was met in June 2026 with a ninety-day extension carrying the response to 18 September 2026, together with a notice invoking third-party consultation under section 27.

    Section 27 consultation is a routine step, and it is worth being precise about which way it points. The section applies where the head of an institution intends to disclose a record that may contain a third party’s commercial information: the notice tells that third party of the intention to release and gives it twenty days to make representations against disclosure, and invoking the section is what permits the response time to be extended. The notice on A-2026-0004 therefore records that Alto has turned its mind to releasing the reference-class records and has given Oxford Global Projects the opportunity to object. It is not a signal that the material will be withheld.

    What remains is a question of timing rather than intent. The third party may object and the institution may then withhold some of the figures; equally it may not. What can be said is the sequence: the record capable of testing the decision will arrive after further commitment has been made. What it contains, the disclosure itself will settle.

    Why timing decides this

    An outside-view check disciplines a decision only while the decision is still open. Once enough money is committed, the arithmetic changes: the cost of stopping is subtracted from the cost of continuing, and a project can show better value for money the more has already been spent on it. Britain’s High Speed Two reached exactly that point — the National Audit Office found in June 2026 that the ratio for completing the programme had risen even as the programme grew more expensive, because the estimated cost of cancelling had more than quadrupled.

    The cheapest moment to apply the test is before that crossover, not after it.

    04 · The Benefit Case

    Two studies, no cost side

    In June 2026, two months after the consultation closed, ALTO released two commissioned studies. A computable general equilibrium assessment by Aviseo Consulting reports a national real GDP gain of about $24.4 billion a year. A corridor tourism study by CPCS with HDR adds up to $3.9 billion in GDP and 43,000 jobs.

    Neither nets a cost. The macroeconomic study excludes construction and operating expenditure by design; the tourism study has no cost side to exclude. Both are benefit totals unaccompanied by the outlay required to obtain them. Both, to their credit, describe their outputs as illustrative and order-of-magnitude rather than forecasts, and make the largest figures conditional on tourism policy the railway itself does not deliver.

    The scenario range has a floor and no ceiling on the downside

    Each study is built as a fan of scenarios, from pessimistic to optimistic. In both, the entire fan sits above zero. The macro study reports welfare increasing in every scenario; the tourism study’s weakest case is still $177 million and two thousand jobs. The modelled question is how large the gain is, never whether there is a loss.

    Adverse mechanisms are identified but do not reach the total

    The tourism study acknowledges that faster trains shorten stays and convert overnight visits into day trips, and shows length of stay falling in several cities. The aggregate rises regardless.

    The two studies disagree, and each resolves the disagreement upward

    The macro study omits domestic tourism on the ground that it is largely substitution from other household spending, with little net effect on national output. The tourism study builds most of its $33.7-billion base, and most of its headline uplift, from precisely that in-corridor domestic travel — counted through gross multipliers that assume no such displacement. The two treatments diverge, and in each case the treatment adopted is the one that yields the larger figure for that study.

    The studies import the literature’s upside but not its realisation record

    Both studies draw their benefit magnitudes from the international high-speed rail literature — the same comparison set the Initiative uses. What they import is the size of the upside. What they do not import is that literature’s record on realisation: rail benefits arriving at about two-thirds of forecast, and passenger numbers overstated by roughly a hundred per cent.

    Each of the four observations above is a description of what the documents contain. Taken together they describe a benefit case in which every point of divergence has resolved in the same direction — which is the pattern the forecasting literature says to look for, and the reason an independent outside-view comparison matters more, not less, once numbers of this size are in circulation. The same two studies are examined in detail in the Initiative’s briefs Two Point Two Trillion and At Face Value.

    05 · The Ask

    Publish the comparison

    The Initiative’s recommendation is narrow and does not require anyone to accept a word of its own analysis.

    01
    Release the comparison in full. ALTO should publish its reference-class should-cost and should-schedule outputs alongside its published capital cost and benefit-cost figures, unredacted. The outside view was commissioned to be seen, not filed.
    02
    Publish the benefit studies against a cost. A $24.4-billion annual benefit figure is not interpretable without the outlay required to obtain it. The two June 2026 studies should be accompanied by an appraisal that nets one against the other.
    03
    Apply the test before further commitment. The window in which an outside-view check can still change a decision is open now. It narrows with every disbursement.

    It requires one document to be made public. The framework behind the request is set out in full in Chapter 1 of the HPR Research Report; what ought to be built instead is the subject of the chapters that follow it.

    How to read this brief

    Every figure attributed to Alto, Aviseo, CPCS, the National Audit Office or a published paper is quoted from the source listed below and can be checked there. Nothing else here is a calculation of ours: the argument rests on what the documents contain and on the sequence of dates, not on a competing estimate.

    Where a record has not been released, this brief says so rather than inferring its contents, and makes no claim about why any extension was taken or any figure was or was not published. The prediction in section 02 is stated in both directions and will be settled by the disclosure, not by us.

    Sources

    Documents relied on

    1
    Alto (VIA HFR – VIA TGF Inc.). Advance Contract Award Notice PAS240625-002-00 — project management and control expertise; pre-identified supplier Oxford Global Projects UK Limited. 2024.
    2
    Alto (VIA HFR – VIA TGF Inc.). Notice of extension, Access to Information request A-2026-0004. June 2026. On file with the Initiative.
    3
    Aviseo Consulting. An Overview of the Structural Economic Impacts of Alto: Computable General Equilibrium Modelling Approach to Assessing High-Speed Rail in the Toronto–Québec City Corridor. Prepared for Alto. June 2026.
    4
    CPCS, in association with HDR. Tourism in the Alto Corridor: Current Conditions and Potential Impacts. Prepared for Alto. June 2026.
    5
    National Audit Office. High Speed Two reset. Report by the Comptroller and Auditor General, Session 2026-27, HC 52. London: National Audit Office, June 2026.
    6
    Flyvbjerg, Bent. “Quality Control and Due Diligence in Project Management: Getting Decisions Right by Taking the Outside View.” International Journal of Project Management 31, no. 5 (2013): 760–774.
    7
    Flyvbjerg, Bent. “Top-Ten Behavioral Biases in Project Management: An Overview.” Project Management Journal 52, no. 6 (2021): 531–546.
  • At face value

    At Face Value

    Five numbers from ALTO’s economic report are now in wide circulation. Each one is either the top of a range or the middle of one. In every case the range exists. In every case it was not printed.

    ⚠ The numbers you will hear

    $49.5 billion in benefits · $24.5 billion in added GDP · 1.1 per cent of Canada’s economy · 50,000 jobs · 24 million riders a year

    None of these figures is invented. Every one comes from real modelling work by real economists, and each is accurate on its own terms. But each describes something narrower, or more conditional, than it sounds — and in every case the report prints one number where the work behind it reports a range.

    Critical Finding

    $49.5 billion is labelled an upper estimate — the good end of a range whose other end is nowhere in the document. $24.5 billion is a central estimate from a range its own modeller published as $14.8 billion to $41.0 billion. 24 million riders is prefixed “up to.” 50,000 jobs sits in a table headed “upper estimate” — and ALTO’s own appendix states those figures are not net economic gains.

    Meanwhile the report declines to publish a benefit-cost ratio — the single number that would tell you whether the benefits exceed the costs.

    The point of this brief is not that ALTO’s numbers are wrong. It is that they are being used as though they were settled, when the documents behind them show they are not.

    The document under examination
    Canada’s Moment: The Economic Opportunity of High-Speed Rail
    ALTO, August 2026 — 83 pages. All figures on this page are from that report or the studies it commissioned.
    Read ALTO’s report
    Number One

    “$49.5 billion in benefits”

    What you’ll hearWhat it actually is
    ALTO delivers $49.5 billion in benefits to Canadians. The upper estimate of benefits, added up over 60 years, adjusted downward for the fact that most of them arrive decades from now. Nearly four-fifths of it is saved travel time.
    In plain language — what “discounted” means

    Economists assume a benefit arriving in 2085 is worth less to us today than the same benefit arriving next year — the same reason $100 now beats $100 in twenty years. So future benefits get shrunk before they are added up. This is standard, required, and correct.

    It also does a great deal of work here, and the Initiative’s brief Hours Are Not Dollars sets it out in full. The report says ALTO saves 9.3 billion hours of travel time, and values an hour at $22.32. Multiply those together and you get $207.6 billion. The figure that appears in the benefit table is $38.4 billion. Discounting removes about 82 per cent of the face value, because most of those hours are saved by people who have not been born yet.

    In plain language — what “upper estimate” means

    The benefit table is headed “upper estimate.” Every narrative figure is prefixed “up to” — up to 24 million riders, up to 9.3 billion hours, up to 400 lives saved. An upper estimate is one end of a range. The other end does not appear anywhere in the 83 pages.

    There is one more thing about this number worth knowing. The report opens by making traffic congestion the problem — Highway 401, Pearson airport, journeys that are too slow and too unreliable. In the benefit table, easing congestion is worth $570 million out of $49.5 billion: about 1.2 per cent. Cleaner air is worth $27 million, roughly one part in two thousand.

    The problem the report leads with and the benefit the report counts are almost entirely different things.

    Number Two

    “$24.5 billion in added GDP”

    What you’ll hearWhat it actually is
    ALTO adds $24.5 billion to the Canadian economy. The middle of a range running from $14.8 billion to $41.0 billion, produced by a different model, in a different year’s dollars, and measured as an annual figure rather than a 60-year total.
    Can it be added to the $49.5 billion? No — the report says so on page 9

    The Initiative examined this figure in detail in Two Point Two Trillion. It is the number ALTO’s website states most confidently: the analysis “concludes that Alto will permanently uplift Canada’s GDP by 1.1%.” The study behind it is more careful, and it publishes its range.

    $14.8B
    the low end of the modeller’s published range
    Aviseo, Table 1
    $24.4B
    the baseline — the only figure that reached the public
    Aviseo, Table 1
    $41.0B
    the high end — nearly three times the low end
    Aviseo, Table 1
    In plain language — where this number comes from

    It comes from a computable general equilibrium model — a simulation of the whole Canadian economy that works out what happens to wages, prices, trade and output when you change one thing. These are legitimate, widely used tools. Governments run them all the time.

    The thing being changed here is a single assumption: that firms in Toronto, Montréal, Ottawa and Québec City become three per cent more productive because the train exists. That one assumption produces $21 billion of the $24.4 billion — 86 per cent of the total.

    In plain language — how three per cent was chosen

    The modellers say so openly, and deserve credit for it. Studies in Germany and Sweden found productivity gains of two to four per cent. So, they write, “it seems reasonable to consider a baseline scenario” of three per cent.

    They also tested two per cent and five per cent. Two per cent gives the $14.8 billion; five per cent gives the $41.0 billion. There is no scenario in which the productivity gain fails to appear at all — even the pessimistic case assumes a two per cent uplift across four city economies.

    One further detail. Because nobody yet knows where the stations will go, the modellers applied that productivity boost to the entire metropolitan areas of Toronto, Montréal, Ottawa and Québec City — standing in for the 30-kilometre radius around a station that the research actually supports. Peterborough, Laval, Trois-Rivières and Kingston appear nowhere in that calculation.

    Number Three

    “1.1 per cent of Canada’s GDP”

    What you’ll hearWhat it actually is
    ALTO raises Canada’s GDP by 1.1 per cent. 1.1 per cent of the Canadian economy as it was in 2019 — the last pre-pandemic year, used because 2020 and 2021 were distorted.

    The modeller says this plainly: the gain is “roughly 1.1% of Canada’s 2019 GDP.” Canada’s Moment drops the year. The website drops the year and adds the word “will.”

    Taken across the published range rather than the midpoint, the same calculation gives roughly 0.6 per cent at the low end and 1.8 per cent at the high end. One of those three numbers is in circulation.

    Number Four

    “50,000 jobs and $86 billion”

    What you’ll hearWhat ALTO’s own appendix says
    Building ALTO creates 50,000 jobs and adds $86 billion to GDP. These figures “represent spending-supported economic activity rather than net economic gains” and are “therefore not included in the benefit-cost ratio.”
    In plain language — why jobs numbers are not benefits

    If you spend $60 billion on anything — a railway, a bridge, a very large hole — people get paid to do it, and those people spend their wages locally. Counting that as a benefit of the project would mean any spending is a benefit, which cannot be right: the money had to come from somewhere, and would have employed someone else.

    ALTO’s appendix says this outright, and adds that the model used “does not account for potential constraints in the economy, such as labour shortages or capacity limits.” Most promoters present numbers like these as benefits and say nothing. ALTO explicitly refuses to — on page 80. The 50,000 jobs appear on page 5.

    The caveat is genuine and creditable. It sits in an appendix seventy-five pages behind the figure it qualifies, and it has not travelled with the number. The Initiative examines this figure in full in Where Do 50,000 Jobs Come From?, which rebuilds it from the annual spending and workforce figures HS2 and the Réseau express métropolitain both publish, and finds that roughly 18,000 of the 50,000 are people working on the railway.

    Number Five

    “24 million riders a year”

    What you’ll hearWhat it actually is
    ALTO will carry 24 million passengers a year. “Up to” 24 million a year by 2055 — the output of scenarios and sensitivity tests whose range the report describes but does not show.

    ALTO’s own methodology appendix explains exactly what it should have published. Sensitivity testing, it says, gives decision-makers “a range of plausible outcomes rather than relying on a single forecast.” The flowchart’s stated output is “a range of plausible ridership outcomes.”

    The report then prints one number.

    That number matters more than it looks, because four of the seven benefit lines depend on it — car running costs, road safety, congestion and greenhouse gases all flow from an estimate of 90.1 billion kilometres of driving avoided. And how much driving is avoided depends on who the new passengers are. Someone who switches from a car takes kilometres off the road. Someone who switches from a plane takes none. Someone making a brand new trip takes none. That breakdown is published nowhere.

    And One Number That Is Missing

    There is no benefit-cost ratio

    The standard test of whether a public investment is worth making is simple: divide the benefits by the costs. Above one, it pays. Below one, it does not.

    Canada’s Moment does not publish that number. Page 62 explains why: the cost estimate is too early-stage for the ratio to be meaningful. The same absence runs through ALTO’s public benefits page, examined in Many Benefits, One Missing Number.

    In plain language — what the cited manual says about early-stage uncertainty

    ALTO names a Metrolinx appraisal manual as the authority for two of its key figures — the subject of It Left the Rules Behind. That manual treats early-stage uncertainty as the reason to test and publish ranges — not as a reason to withhold them. Its instruction for the earliest project stage is to conduct sensitivity testing to understand the level of uncertainty.

    The same manual also requires early-stage rail costs to be marked up by 64 per cent before being compared with benefits, because rail megaprojects are systematically undercosted. That would put ALTO’s $60–90 billion into the comparison at roughly $98–148 billion. No such uplift is applied, and the concept is not mentioned.

    So the report does not divide the benefits by the costs, while placing $49.5 billion in benefits and $60–90 billion in costs on the same spread.

    It has been done before — on this corridor, at this stage

    In December 2021 the Joint Project Office — a body formed by VIA Rail Canada and the Canada Infrastructure Bank — completed a business case for High Frequency Rail, the slower and cheaper predecessor to ALTO along the same corridor. It was at a comparable point in its development.

    That document published a benefit-cost ratio.

    Project
    High Frequency Rail — the same Toronto–Québec City corridor, at a comparable stage of design
    Capital cost
    $27.71 billion in 2020 prices
    Benefit-cost ratio
    Approximately 0.13 — rising to about 0.4 on an expanded basis that also counts agglomeration effects and a resource correction
    Net present value
    −$21.1 billion over thirty years
    Public subsidy
    $37.1 to $42.2 billion over thirty years, under the delivery models assessed
    Parameters
    Drawn from Metrolinx and Ministère des Transports du Québec guidance — the same two sources Canada’s Moment cites five years later

    It was not published at the time. It became public in November 2025, when the Canada Infrastructure Bank released it under the Access to Information Act — almost four years after it was written.

    In plain language — what a ratio of 0.13 means

    A benefit-cost ratio of 1.00 means a project returns exactly what it costs. Above 1.00 it pays for itself in economic terms; below 1.00 it does not.

    A ratio of 0.13 means that for every dollar spent, about thirteen cents of measurable benefit came back. On the wider basis, which counts effects that are harder to measure, about forty cents. The Joint Project Office published those figures anyway, alongside the subsidy the project would need.

    Read this part carefully — these are not ALTO’s numbers

    0.13 is not ALTO’s ratio, and it is not an estimate of ALTO’s ratio. High Frequency Rail was a different project: slower, at $27.71 billion rather than $60–90 billion, assessed over thirty years rather than sixty. The Joint Project Office described its own results as preliminary. None of its figures transfers to ALTO by arithmetic, and this brief does not offer them as a forecast of anything.

    What the document establishes is narrower, and harder to answer: a benefit-cost ratio can be produced for a project on this corridor at this stage of design — because one was. Immaturity did not prevent it then, on a cost estimate roughly a third the size.

    There is one further detail worth recording. The same document, released under a different access request, comes back with one section withheld in full, the capital cost and revenue sentences cut off mid-clause, and the subsection headings of its Economic Case not shown in the table of contents. No exemption provision is marked against any of these.

    What Cannot Be Checked At All

    The benefit table cannot be audited by a reader

    Each row of the main benefit table gives you a quantity and a dollar value. The natural thing to do is divide one by the other and see what price has been put on an hour, a tonne of carbon, or a life. You cannot.

    The dollar figures are discounted. The quantities are not. And the prices that would connect them are referenced by source but never stated — only the $22.32 hourly value appears anywhere.

    One row does not appear to add up at all. The report says ALTO avoids up to 400 deaths and 26,000 injuries, valued at $610 million. Working backwards, that is roughly $1.2 billion before the time adjustment — which 26,000 injuries alone would exhaust at $50,000 each, a low figure by Canadian standards, leaving nothing for the 400 lives. Either the casualty counts and the money cover different periods, or the values placed on a life and an injury are far below what Canadian governments normally use. The report does not publish enough to say which.

    The Takeaway

    The same thing has happened to every number

    Top of a range
    $49.5 billion in benefits — the table is headed “upper estimate”; the lower estimate is nowhere in the document.
    Middle of a range
    $24.5 billion in GDP — the modeller published $14.8 billion to $41.0 billion. Only the midpoint travelled.
    Top of a range
    24 million riders — prefixed “up to,” from a process whose stated purpose is to produce a range.
    Top of a range
    50,000 jobs — in a table headed “upper estimate,” for figures the appendix says are not net gains.
    Not published
    The benefit-cost ratio — the one number that would put the others in proportion. The last time one was produced for this corridor, it took an access-to-information request to see it.

    This is the finding. Not that any figure is fabricated — none is. Not that the modelling is incompetent — the underlying studies are careful, and say so about their own limits. But wherever the underlying work reported a range, the document carries a single figure from the optimistic end of it, and it is that single figure which has reached councils, newspapers and the public.

    The ranges are not secret. Most of them are in ALTO’s own commissioned studies, sitting on ALTO’s own research page. They simply did not make it into the document that everyone reads.

    None of these figures should be repeated at face value, in either direction. They are the optimistic end of work that its own authors describe as uncertain — and anyone quoting them, for or against the project, should say which end of the range they are quoting.

    In Fairness

    What this brief is not saying

    Credit where it is owed

    The modellers were transparentThe economic study behind the GDP figure publishes its full range, states its assumptions, and explains how each was chosen. This brief is only possible because that work was published.
    ALTO refuses a claim it could have madeIts appendix states that the construction jobs and spending figures are not net economic benefits — a caveat most promoters simply omit.
    Some choices are genuinely cautiousThe value of an hour is held flat for 60 years rather than rising with incomes, which lowers the benefit total substantially. Safety benefits are capped after 20 years.

    And the limits of what we show

    Some arithmetic here is oursEvery figure attributed to ALTO, Aviseo, Metrolinx, the Joint Project Office or Transport Canada is quoted from the source listed below and can be checked there. Everything else is our own calculation from those published inputs: the $207.6 billion undiscounted time total, the 82 per cent that discounting removes, the 0.6 and 1.8 per cent at the ends of the GDP range, the $98–148 billion uplifted cost, and the casualty reconciliation. The reconciliations use assumptions about timing that ALTO does not disclose. They show the numbers cannot be reproduced from what is published — not that they are wrong.
    This is about disclosure, not competenceThe underlying modelling may be entirely sound. The objection is that a reader cannot tell, because the working is not shown.
    We do not say whyWhere a range or a caveat does not appear in the report, this page says so rather than inferring it. It makes no claim about why any particular figure was or was not published.
    A range is not a refutationThat the GDP figure could be $14.8 billion does not mean it will be. It equally could be $41.0 billion. The point is that one number is being presented as though the others do not exist.
    What To Ask

    Five questions for anyone quoting these figures

    1. Is that the top of the range, or the middle?

    For four of the five headline numbers, it is one or the other.

    2. What is the lower estimate?

    The benefit table is explicitly labelled an upper bound. Every range has another end.

    3. What is the benefit-cost ratio?

    Not published. It is the number that puts every other number in proportion — and one was produced for this corridor in 2021, so “too early” is a choice rather than a constraint.

    4. What price was put on a life, or a tonne of carbon?

    Referenced by source, never stated. Without them, no line of the benefit table can be checked.

    5. Where do the new passengers come from?

    Cars, planes, existing trains, or trips that would never have happened? A fifth of the benefits depend on the answer.

    Sources

    Primary documents

    1.
    ALTO, Canada’s Moment: The Economic Opportunity of High-Speed Rail, August 2026, 83 pp. Benefit table and value of time at p. 72; cost-benefit methodology at p. 73; GDP table and its “central estimate” note at p. 75; the roughly 100 simulations at p. 78; input-output caveat at p. 80; construction figures at Table A4, p. 81; ridership methodology at pp. 81–83; benefit-cost ratio at p. 62; non-additivity of the models at p. 9. altotrain.ca (PDF)
    2.
    Aviseo Conseil, An Overview of the Structural Economic Impacts of Alto: Computable General Equilibrium Modelling Approach, June 2026, 25 pp. Prepared on behalf of Alto. Published range at Table 1; productivity scenarios at Shock 1; labour-supply scenarios at Shock 2; geography assumption at p. 10. Available on ALTO’s research page.
    3.
    Metrolinx, Business Case Manual Volume 2: Guidance, August 2021, 222 pp. Cited by ALTO as the source of its discount rate and value of time. Sensitivity requirements at pp. 87–89; optimism-bias uplift at pp. 90–94; economic parameters at Table 5.8, p. 98.
    4.
    Joint Project Office (VIA Rail Canada and the Canada Infrastructure Bank), High Frequency Rail Project: Business Case Update, V.002, 10 December 2021, 150 pp. Released by the Canada Infrastructure Bank under the Access to Information Act, November 2025. Capital cost at p. 7; benefit-cost ratio, net present value and subsidy comparison at p. 8; appraisal parameters sourced to Metrolinx and MTQ guidance at p. 40; impact results and both ratios at Table 14, p. 43. The same document released as Annexe A to access request 22-2207 withholds section 9.7 in full, truncates the capital cost and revenue sentences mid-clause, and withholds the subsection headings of the Economic Case within its table of contents, with no exemption provisions marked.
    5.
    Transport Canada, Statistics on the social costs of collisions in Canada, and the underlying Ontario social cost model — used here as the comparison for standard Canadian casualty valuations. ALTO does not cite these and may have used others.
  • It left the rules behind

    ALTO Used the Rulebook’s Numbers. It Left the Rules Behind.

    ALTO’s new economic report takes two key figures from an Ontario appraisal manual and names that manual as its source. The manual attaches conditions to those figures. The report uses the figures and leaves the conditions out.

    ⚠ The Document Under Examination

    In August 2026 ALTO published Canada’s Moment: The Economic Opportunity of High-Speed Rail, an 83-page report setting out the economic case for the Toronto–Québec City high-speed rail corridor. Its central figure is $49.5 billion in benefits to travellers and society, set against a construction cost of $60 to $90 billion.

    To turn sixty years of future benefits into one number in today’s dollars, the report needs two things: a rate at which to shrink future benefits back to present value, and a price for an hour of a traveller’s time. For both, it names one source — a public appraisal manual published by Metrolinx, the Government of Ontario’s transit agency for the Toronto and Hamilton region.

    Critical Finding

    The Metrolinx manual does not simply publish those two numbers. It publishes them as part of a package. For any project over $500 million, the same manual requires that the numbers be re-tested at different values, that results be reported as a range rather than a single figure, that early-stage construction costs be topped up to correct for known optimism, and that the project’s benefit-to-cost ratio be published. ALTO’s project is roughly a hundred times larger than that threshold.

    None of those requirements appears in ALTO’s report. There is no test of the discount rate, no range around the $49.5 billion, no optimism adjustment to the cost, and no benefit-cost ratio. The two numbers were carried across. The conditions attached to them were not.

    This brief does not argue that ALTO used the wrong discount rate. The rate it used is a mainstream, defensible choice. The finding is narrower and, we think, harder to answer: the report presents a set of choices as though they were simply facts, and a reader has no way of knowing that anything was chosen at all.

    Download
    Two Parameters, None of the Conditions — Full Brief (PDF)
    Full research brief with page references, parameter tables, and sources
    Download PDF
    Start Here

    Why this matters

    Imagine a builder quotes you a price for an extension. Asked where the figures come from, they name the standard industry pricing guide. That guide does set those rates. It also says that on a job this size the quote must show a high and a low figure rather than a single number, must add a fixed percentage on top because early quotes are almost always too low, and must set the total against the value of what you are getting.

    The builder uses the guide’s rates and does none of the rest. The quote may well be sound. You have no way of telling — and nothing on the page tells you that anything was left out.

    That is the situation this brief describes. ALTO’s economic report takes two figures from a public appraisal manual and names that manual as its source. The same manual attaches a set of mandatory checks to those figures for projects of this size. The figures were used. The checks are absent, and their absence is not disclosed.

    It matters because of what rests on the result. The $49.5 billion benefit figure is the number now appearing in news coverage and public statements as the reason to build a railway costing $60 to $90 billion of public money, ahead of a federal decision in 2029. Presented as a single figure with no range, it reads as something measured. The report’s own tables call it an upper estimate.

    What the report gives you

    One benefit figure, $49.5 billion, built on a rate and an hourly value of time presented without explanation of where they came from or what else was possible. No range. No benefit-to-cost ratio.

    What its own cited source requires

    The same figures re-tested at different values, results published as a range with a confidence level, a 64 per cent top-up on early-stage construction costs, and the benefit-to-cost ratio reported.

    What that leaves a reader with

    No way to judge how firm the headline number is — and no indication in the document that this is a question worth asking.

    One thing this brief does not do: argue that the numbers ALTO chose are wrong, or that high-speed rail is a bad idea. The rate it used is a mainstream choice, and the one test the manual requires would, if anything, make the benefits look larger. The ask is simply that the tests be run and published, as the cited manual says they must be.

    The Two Numbers

    What the report borrowed, and from where

    3.5%
    the discount rate ALTO uses, taken from the Metrolinx manual
    Appendix A, footnote 65
    $22.32
    the value of one hour of a traveller’s time, the same figure for every trip
    justified as following Metrolinx method
    64%
    the top-up the same manual requires on construction costs at this stage of design
    not applied in the report

    The discount rate. A benefit that arrives in 2085 is not worth as much to us today as the same benefit next year. Economists handle this by shrinking future amounts back to a present-day value at a fixed annual percentage — the discount rate. ALTO uses 3.5 per cent a year, applied over a sixty-year period. The rate matters enormously: over sixty years, small changes to it move the headline benefit figure by billions.

    The value of time. Most of the $49.5 billion is not cash. It is hours — time that travellers would otherwise have spent on the road or waiting at an airport. To put a dollar figure on those hours, you have to decide what an hour is worth. ALTO uses $22.32, and applies the same figure to every trip: business or holiday, commuter or tourist. The report tells us its own ridership model did separate business from non-business travel, and that this distinction was set aside in favour of one blended figure.

    Where both come from. The footnote attached to the discount rate cites one document and one only: the Business Case Manual Volume 2: Guidance, published by Metrolinx in August 2021. The single blended value of time is defended on the grounds that it follows Metrolinx method. So a manual written for regional transit projects in the Toronto and Hamilton area is the published authority for how a national intercity railway has been appraised.

    Metrolinx guidance is not binding on a federal Crown corporation, and nothing here suggests otherwise. But a citation carries the terms of the thing cited. If you name a manual as your authority, it is fair to look at what else that manual says on the same page.

    The Manual’s Own Terms

    The numbers come as a set, not a menu

    The 3.5 per cent rate appears in a table of standard parameters. The text introducing that table is direct about their status: any departure from them has to be explicitly agreed during the work, with a clear justification recorded. It is a list of defaults you may leave, provided you say so. Below is how each of those defaults is treated in ALTO’s report.

    What the Metrolinx manual specifiesWhat ALTO’s report does
    Discount rate: 3.5 per cent. The rate at which future benefits are shrunk to present value.3.5 per cent. Adopted exactly as specified, and correctly footnoted to the manual.
    Status:Carried across
    Value of time: one blended figure. A single hourly value across all modes and all trip purposes, rather than separate values for business and leisure travel.One blended figure, $22.32. Adopted, and expressly justified by reference to the manual — in preference to the business and non-business split that ALTO’s own ridership model had already produced.
    Status:Carried across
    Growth cap: stop escalating benefits 30 years out. The manual caps growth in the inputs thirty years after the base year, expressly to reflect the fact that nobody can see that far ahead. User benefits are named as covered by the cap.Applied to two small lines, not the big one. Accident rates are capped after twenty years, and vehicle emission factors run to 2050. No cap is stated on travel-time benefits — which are 78 per cent of the total.
    Status:Applied selectively
    One price year throughout. All values discounted and escalated to a single common year, fixed at the start of the study, so that every figure in the document is in the same money.Two price years in one report. The appraisal and the capital cost are in 2024 dollars; the economy-wide GDP result is in 2019 dollars.
    Status:Not consistent
    Test the value of time at 0.75 per cent real growth. The manual’s base case assumes the value of an hour does not rise in real terms — but pairs that assumption with a required test of what happens if it does.Zero growth assumed; no test run. The assumption was carried across. The test that the manual attaches to the assumption was not.
    Status:Left behind

    One footnote on the money. Adjusting the manual’s 2021 value of time for inflation to 2024 gives roughly $21.40 — within a few per cent of ALTO’s $22.32. We are not claiming ALTO derived its figure that way, and ALTO does not say how it did. The point is simply that the figure sits where you would expect a Metrolinx-derived figure to sit, which makes the omission of the accompanying test harder to explain as an oversight.

    The Missing Tests

    What a project this size is supposed to publish

    The Metrolinx manual scales its requirements to the size of the project. Anything above $500 million is treated as large scale, and a specific list of tests and disclosures becomes mandatory. ALTO’s cost estimate is $60 to $90 billion — roughly a hundred times that threshold. Here is that list, and where each item stands in ALTO’s report.

    Re-run the numbers at a different discount rate

    The manual requires the calculation be repeated at 2.5 per cent so the reader can see how sensitive the answer is to the rate. Not done, and not mentioned. Note the direction here: the required test is at a lower rate, which would make the benefits look larger. Nothing in the manual supports an argument that ALTO’s rate is too generous. What it supports is the narrower point that the manual’s author expects the rate to be tested and the test to be shown.

    Re-run the numbers with a rising value of time

    Required at 0.75 per cent real growth per year. Not done.

    Run the costs and assumptions through a range analysis

    The manual requires costs and modelling assumptions be run thousands of times with the inputs varied, and the result reported as a range with a stated confidence level. Not done.

    Report the odds that the project is worth doing

    The manual asks specifically for the probability that benefits exceed costs. Not reported — the report publishes no benefit-cost ratio at all.

    Publish the standard indicators

    Net present value, benefit-cost ratio, capital utilisation, return on investment, internal rate of return. None published.

    Model low, medium and high growth scenarios

    Required, with the ridership growth rate stated for each. A ridership range is shown; the underlying growth scenarios are not stated.

    This is not a theoretical requirement

    The manual works the method through on a real example: an extension of the Yonge subway line in Toronto, at an early stage of design. A single cost estimate of $5.65 billion becomes a range of $6.16 to $6.84 billion, with the confidence level attached. The reader is shown a central figure, a spread, and how sure anyone is about it.

    That project is roughly one per cent the size of ALTO. On uncertainty, the manual ALTO cites tells its reader more about a subway extension than ALTO’s report tells its reader about a national railway.

    The Missing Lower Number

    The report concedes a range it never publishes

    The two tables carrying the entire $49.5 billion case are both headed with the words upper estimate. Every figure in the narrative is prefixed the same way: up to 24 million riders, up to 9.3 billion hours saved, up to 400 fatalities avoided, up to 39.1 million tonnes of emissions.

    An upper estimate is one end of a range. The other end does not appear anywhere in the document.

    The claim built on top of those figures goes further still. The report states that the benefits hold across a wide range of scenarios, and repeats the point in its conclusion. But demonstrating that a result holds across a range of scenarios is exactly what the missing sensitivity analysis does, and exactly what the cited manual requires be reported at this scale. The scenarios may well have been run. Their results are not shown.

    And the report clearly knows how to show them. Elsewhere in the same document, the ridership forecast comes with multiple scenarios and a published band around it. The economy-wide GDP figure rests on nearly a hundred separate model runs with the assumptions varied. Between a tested input and a tested output sits the largest single number in the report, presented as a single column of point estimates.

    The Optimism Adjustment

    A top-up the manual requires, and the report does not mention

    Early cost estimates for big infrastructure projects are, as a matter of record, too low. Not occasionally — routinely. The Metrolinx manual is explicit about the evidence behind this: in an international sample of 258 rail projects, ninety per cent were undercosted, by an average of forty-five per cent.

    The manual’s response is a mandatory top-up applied to the construction cost when it is compared with benefits, over and above whatever contingency is already in the estimate. The size of the top-up depends on how far the design has progressed. At the earliest stage — nought to ten per cent designed — it is 64 per cent.

    ALTO’s cost estimate is described in its own report as an AACE Class 5 estimate, which is the earliest and least developed class there is. Applied as the manual directs, a cost of $60 to $90 billion would enter the comparison at roughly $98 to $148 billion, before any comparison with benefits is attempted. That range is our own arithmetic on ALTO’s published estimate at the manual’s stated uplift; ALTO publishes no uplifted figure.

    The report applies no such adjustment and does not mention the concept. It is worth noting where this reasoning comes from: the manual grounds the adjustment in the research on transport megaproject cost overruns that this Initiative has drawn on since its first publication. That reasoning is already embedded in the appraisal manual ALTO chose to cite.

    The Central Inversion

    Too early to divide, but not too early to multiply

    The report declines to publish a benefit-cost ratio — benefits divided by costs, the single number a reader would most want. Its stated reason is that the cost estimate is too immature to support one.

    Under the framework ALTO cites, that reasoning runs backwards. The manual sets out what is required at each stage of a project’s life. At the earliest stage, the very stage ALTO is at, the requirement is a single line: conduct sensitivity testing to understand the key drivers and the level of uncertainty in each option.

    Early-stage uncertainty is not an exemption from testing. It is the reason testing is required. The report treats it the other way round: immaturity on the cost side is given as grounds for publishing nothing, while single-point figures are published on the benefit side of the same ledger. The same uncertainty is treated as decisive for one number and immaterial for the other.

    And a business case for this corridor has already done it. In December 2021 the Joint Project Office — VIA Rail and the Canada Infrastructure Bank — published a benefit-cost ratio for High Frequency Rail, the cheaper predecessor to ALTO, at a comparable stage of development: about 0.13, or roughly 0.4 on an expanded basis counting fare revenue and agglomeration as benefits. It published a net present value of minus $21.1 billion and a thirty-year public subsidy of $37.1 to $42.2 billion alongside it. Its economic parameters were drawn from Metrolinx and Ministère des Transports du Québec guidance — the same two sources ALTO cites. Immaturity did not prevent a ratio then. The companion explainer Hours Are Not Dollars sets out those figures in full, including why 0.13 rather than 0.4 is the anchor.

    A related point arises elsewhere in the report. In explaining why one set of results is excluded from the welfare account, it refers to those results as therefore not being included in the benefit-cost ratio — speaking of it as a thing with a settled boundary about what enters it. One page says a meaningful ratio cannot yet be produced. Another treats the ratio as already drawn up. The two are difficult to read together, and the report does not reconcile them.

    Limits of This Analysis

    What this brief does not say

    Stated here rather than left for others to find.

    On the analysis

    The rate is not wrong3.5 per cent is a defensible choice, used by the United Kingdom Treasury and by Metrolinx, and well supported for long-horizon public investment. This brief does not argue that ALTO’s rate is too low or too high.
    Metrolinx does not bind ALTOA provincial agency’s manual has no legal force over a federal Crown corporation. The argument is about the coherence of a citation, not about jurisdiction.
    One choice runs in ALTO’s favourThe 3.5 per cent rate is applied flat across sixty years. The UK Treasury, whose Social Time Preference Rate this figure matches, steps its rate down to 3.0 per cent after year 30. Applying that schedule would have made ALTO’s benefit total larger, not smaller.
    One cited source was not reviewedGuidance from the Ministère des Transports du Québec is cited separately for the value of time. The Initiative has not reviewed it and takes no position on what it requires.

    On the report and its source

    The report does apply conservatism in placesAccident reductions are capped after twenty years, and car emission factors are assumed to improve to 2050, which the report notes limits the emissions benefit. These are the two smallest monetised lines. No equivalent constraint is disclosed for travel time, which is 78 per cent of the total.
    The manual itself is datedMetrolinx said in 2021 that a revised version with updated values would follow in 2022. Five years on, it has not. That is a limitation of the source document, not a fault of ALTO’s — but a reader assessing where a federal appraisal input came from is entitled to know it.
    Which figures are whoseEvery figure attributed to ALTO, Metrolinx, the Joint Project Office, HM Treasury or Statistics Canada is quoted from the sources listed below and can be checked there. Three figures are our own arithmetic and are marked as such where they appear: the $98 to $148 billion uplifted capital range, the $21.40 inflation-escalated value of time, and the five per cent effect of the declining Green Book schedule. Where the report does not state something, we say so rather than inferring it, and we make no claim about why any requirement was or was not carried across.
    This is a public report, not a formal submissionA business case submitted to Cabinet in 2029 may well contain material this document does not. The claims examined here are the claims ALTO has chosen to put in public.
    What Would Settle It

    Two questions ALTO can answer without releasing a model

    Both are answerable from work ALTO has already done. Neither requires disclosure of a model, cooperation from staff, or agreement about what the correct discount rate for a national railway ought to be.

    1. Was the calculation ever run at a rate other than 3.5 per cent?

    And if so, what were the results? A negative answer is itself informative — it would mean the required test was never performed. An affirmative answer is the sensitivity table the report does not contain.

    2. Which parts of the cited guidance were applied, and which were departed from?

    The Metrolinx document requires that any variation from its parameters be agreed and clearly justified. The report records no variations at all — while, on the evidence above, departing from several.

    Where Things Stand · August 2026

    Summary ledger

    Measured against the requirements of the manual ALTO names as its authority:

    Carried across
    The 3.5 per cent discount rate, correctly cited to the manual.
    Carried across
    The single blended value of time, expressly justified by reference to the manual.
    Partial
    The thirty-year cap on benefit growth: applied to accident and emissions lines, not stated for travel time, which is 78 per cent of the benefits.
    Partial
    A single price year throughout: the appraisal is in 2024 dollars, the GDP result in 2019 dollars.
    Left behind
    Discount rate sensitivity test at 2.5 per cent.
    Left behind
    Value of time sensitivity test at 0.75 per cent real growth.
    Left behind
    Range analysis of costs and assumptions, reported with a confidence level.
    Left behind
    The probability that benefits exceed costs, and the benefit-cost ratio itself.
    Left behind
    The standard set of performance indicators: net present value, benefit-cost ratio, capital utilisation, return on investment, internal rate of return.
    Left behind
    The optimism-bias top-up on construction costs, 64 per cent at this level of design — not applied and not mentioned.
    Left behind
    The lower end of the range, on figures the report itself labels an upper estimate.

    ALTO names an appraisal manual twice — once for its discount rate, once to justify a single blended value of time — and leaves behind the testing, the ranges, the optimism adjustment and the benefit-cost reporting that the same manual attaches to those figures at this project’s scale. What remains is a column of numbers labelled an upper estimate whose lower estimate is never shown, resting on parameters presented as facts rather than as selections, in a report that declines to divide that column by the cost while describing the benefits as holding across a wide range of scenarios.

    Every document relied on here is public. Nothing in this analysis requires access to ALTO’s models, cooperation from its staff, or a view on what the correct discount rate for a national railway ought to be.

    Download Full Brief
    Two Parameters, None of the Conditions (PDF)
    Full research brief with page references, parameter tables, worked figures and sources
    Download PDF

    If the terms in this brief are unfamiliar — what a discount rate actually does, why a benefit figure is not money, and who ends up paying — the companion explainer Hours Are Not Dollars covers the same ground in plain language, and sets out the 2021 business case figures in full.

    Sources

    Primary documents

    1.
    ALTO, Canada’s Moment: The Economic Opportunity of High-Speed Rail, August 2026, 83 pp. Discount rate, appraisal period and price base in the Appendix A methodology box, sourced at footnote 65 to the Metrolinx Business Case Manual Volume 2; value of time and the single-parameter justification in the same appendix, with Ministère des Transports du Québec guidance at footnote 66. Direct-effects tables headed “upper estimate, $2024 CAD”; benefit-cost ratio discussion at p. 62 and reference to the benefit-cost ratio at p. 80; capital cost and AACE Class 5 at pp. 5 and 65; scenario-robustness claims at pp. 3 and 69.
    2.
    Metrolinx, Business Case Manual Volume 2: Guidance, August 2021, 222 pp. Economic parameters at Table 5.8; sensitivity requirements at Tables 5.1 to 5.3; optimism bias at Tables 5.4 to 5.6; worked range example at Table 5.7; Economic Case lifecycle requirements and key performance indicators; business case principles at pp. 11 and 13; guidance revision cycle at p. 4. metrolinx.com
    3.
    Metrolinx, “Business Cases — Resources,” accessed 21 August 2026. The Business Case Guidance link resolves to the Volume 2 file under an asset version token corresponding to 15 September 2022; no Volume 2 revision has been issued.
    4.
    B. Flyvbjerg, Procedures for Dealing with Optimism Bias in Transport Planning (UK Department for Transport, 2004), cited in the Metrolinx Guidance as the basis for the optimism-bias uplift.
    5.
    Statistics Canada, Table 18-10-0004-01, consumer price index, used for the 2021 to 2024 escalation of the Metrolinx value of time. The comparison is arithmetic and is not an attribution of method.
  • The wrong answer to the right question

    Coalition for Better Rail · ALTO HSR Citizen Research Initiative · The HPR Research Report

    The Wrong Answer to the Right Question

    The corridor genuinely needs better trains. What it got instead was a project that grew far beyond its original plan during procurement — and that can’t be fixed with tweaks, because its problems come from how it was chosen, not how it’s being built.

    This chapter doesn’t dispute that the Windsor–Toronto–Ottawa–Montréal corridor needs better intercity rail. It does. What it disputes is ALTO — on grounds that are about method and evidence, not politics. We trace how a modest upgrade of a largely existing, disused rail corridor turned into a 300 km/h greenfield megaproject during a competitive bidding process, lay out four structural problems with the project as designed, and explain why none of it can be patched from the inside.

    Source Note

    Much of this chapter draws on documents obtained through Access to Information requests — internal board and executive records, procurement files, and the independent fairness monitor’s final report — along with the Initiative’s own independent cost, ridership, and route-friction models. Specific releases are cited by their file numbers throughout. Some key documents, including the internal slide where the project’s scope was reframed, remain withheld.

    Download
    Chapter 2: The Wrong Answer to the Right Question (PDF)
    The full chapter, with footnotes and sourcing
    Download PDF
    2.1 · The Real Problem

    The corridor genuinely needs better trains

    The Windsor–Toronto–Ottawa–Montréal corridor connects Canada’s two largest metro areas and the national capital, and generates roughly half the country’s GDP. Despite that, intercity rail service on it is among the worst in any comparable wealthy country. VIA Rail shares track with CN freight, and freight trains get priority — when both need the same stretch of track, the passenger train waits in a siding. The result is slow, unreliable, and infrequent service.

    <64%
    VIA Rail’s on-time performance in 2023 — worse than Air Canada’s 63%, which itself ranked last among North America’s ten largest airlines
    4h+
    Scheduled Toronto–Montréal journey time — more than double a competitive flight, including check-in
    ~50%
    Share of Canada’s GDP generated in this corridor — the economic weight today’s rail service fails to serve

    Schedules are padded with hours of slack to absorb the delays that freight priority makes routine. The result isn’t competitive with driving or flying, and VIA can’t simply add more trains without bumping freight that has the contractual and legal right of way. So the question this report asks isn’t whether the corridor needs investment. It’s what kind of investment actually delivers it — at what cost, on what timeline, with what risk.

    2.2 · How This Happened

    A modest upgrade grew into a much bigger, much pricier project — during the bidding process

    ALTO’s cost and ambition problems didn’t come from ordinary planning drift. Records obtained through Access to Information show the project’s scope escalating in the middle of the bidding process itself — not through any public announcement or debate. Understanding how that happened explains why ALTO costs what it costs today.

    One thing to be clear about up front: this is not a claim that the procurement was run improperly. BDO Canada, the independent fairness monitor appointed in 2022, concluded in its final report of May 2025 that the process it observed was carried out in a fair, open and transparent manner, and recorded no fairness concerns at any stage. The problem is not that rules were broken. It is that a process run properly within its own terms produced a project no one had put to Parliament.

    What was on the table originally

    The project ALTO replaced was VIA Rail’s High Frequency Rail (HFR) plan: a dedicated-track plan running at up to 177 km/h, largely reviving a long-disused rail right-of-way through Peterborough, Havelock, and Smiths Falls — a separate, more direct route away from the CN Kingston Subdivision VIA still shares with freight today — delivered incrementally, segment by segment. Its own 2021 business case projected about 13.5 million riders a year, at a capital cost roughly a quarter to a third of what ALTO now proposes. That’s the baseline the public was never shown as a discrete choice against what came next.

    An open-ended bidding process

    The request for proposals went out in October 2023 without a settled route — internal records show the route was still being debated at the executive and board level as late as March 2024, five months after bidding opened. It also asked every bidder for two designs: one topping out at 200 km/h, and a second, more ambitious one with high-speed sections. The process then included 36 structured private meetings between the government and each bidder over eight and a half months.

    All three bidders proposed something bigger

    A Privy Council Office briefing note of 20 February 2025, released under access to information, records that as the bidding progressed all three shortlisted consortia put forward designs more ambitious than the high-frequency plan — new routes on largely new land, above 250 km/h. The jump in scope did not come from any one bidder. The winning consortium, Cadence — CDPQ Infra, AtkinsRéalis, Keolis, SYSTRA Canada, SNCF Voyageurs, and Air Canada — brings substantial experience in dedicated, higher-speed rail: its members built Montréal’s REM and operate France’s TGV network. What has never been published is the comparison the bidding process was set up to produce. The same briefing note credits an unnamed third party with concluding those bigger proposals would deliver greater benefits, and that analysis has not appeared in any release to date.

    Billions committed before the plan was finished

    The government committed $3.9 billion in the 2024 Fall Economic Statement before the business case was finalized and before a route was chosen. The internal slide that appears to document the scope escalation — titled “Level of Ambition Supported by Business Case” — remains withheld from public release. Once the funding commitment was public, there was effectively no way back to the smaller project.

    Selling the bigger, pricier version

    With the scope already locked in, the government faced a communications problem: a project that started as “VIA HFR” was now something much closer to European-style high-speed rail. Internal records show “high frequency” tested poorly with Ontario audiences, while the name “Alto” tested well with 18–34-year-olds and worked bilingually. A national ad campaign promoting the project’s benefits ran while the business case and route documents were still being withheld from information requesters.

    The pattern, stated plainly

    A project that entered the bidding process as a $9–12 billion, 177 km/h upgrade of a largely disused rail corridor came out the other side as a $60–90 billion (on the government’s own published figures — our independent estimate is materially higher), 300 km/h greenfield railway. That change in scope was never put to Parliament or the public as a choice. It emerged from the mechanics of the procurement itself.

    2.3 · Four Problems Built Into the Design

    Route, math, price tag, ridership — each one falls short

    Having won a mandate for a much bigger project than the one that went to bid, ALTO’s proponents faced four separate problems: a route through sensitive land, a business case that has to clear a federal investment bar, a cost estimate that has to hold up, and a ridership forecast that has to be believable. None of the four holds up well under independent scrutiny.

    2.3.1 · The route runs through some of the most sensitive land in the corridor

    ALTO’s proposed new corridor crosses the Frontenac Arch Biosphere Reserve — a UNESCO-designated ecological corridor — the Napanee Limestone Plain, habitat for several species at risk, and Leda clay deposits south of Ottawa with known engineering hazards at high speed. This wasn’t a routing choice made for technical reasons; it reflects a decision to build an entirely new, 300 km/h-optimized corridor rather than follow existing, already-disturbed infrastructure. In our Participant Experience Survey, only 2% of respondents received direct notification about ALTO, and 88% found the information they did get inadequate. Our Community Friction Index — which scores corridors on land conflict, municipal pushback, expropriation exposure, ecological sensitivity, and public mobilisation — puts ALTO’s corridor at 54 out of 100, in the high-friction range. That matters financially, not just politically: in our statistical model, community friction is a significant predictor of cost overruns.

    2.3.2 · The math doesn’t clear the government’s own bar

    The only published economic appraisal of this corridor is the December 2021 business case for the predecessor project. It puts the benefit-cost ratio at about 0.13 over a 30-year period — about thirteen cents of measured value for every dollar spent — rising to about 0.4 once two newer and less established benefit categories are added in. A separate calculation in the same document shows a net loss of $21.1 billion in present-value terms. These are the government’s own figures. A ratio of 1.0 is simply break-even, the point where benefits equal costs. Our independent analysis, which grounds every input in how comparable projects have actually performed rather than project-specific projections, finds the ratio is likely far worse still.

    ScenarioWhat it shows
    Published (Dec 2021 appraisal)
    30-year evaluation period
    Benefit-cost ratio ~0.13, or ~0.40 on the expanded basis
    Initiative reference-class estimate
    Cost assumed: ~$143B
    Benefit-cost ratio ~0.03–0.11
    Break-evenBenefit-cost ratio of 1.0 — benefits equal costs
    In plain terms

    ALTO fails its own government’s investment test on the government’s own numbers. Checking those numbers against how similar projects have actually performed makes the gap worse, not better.

    2.3.3 · The price tag is very likely too low

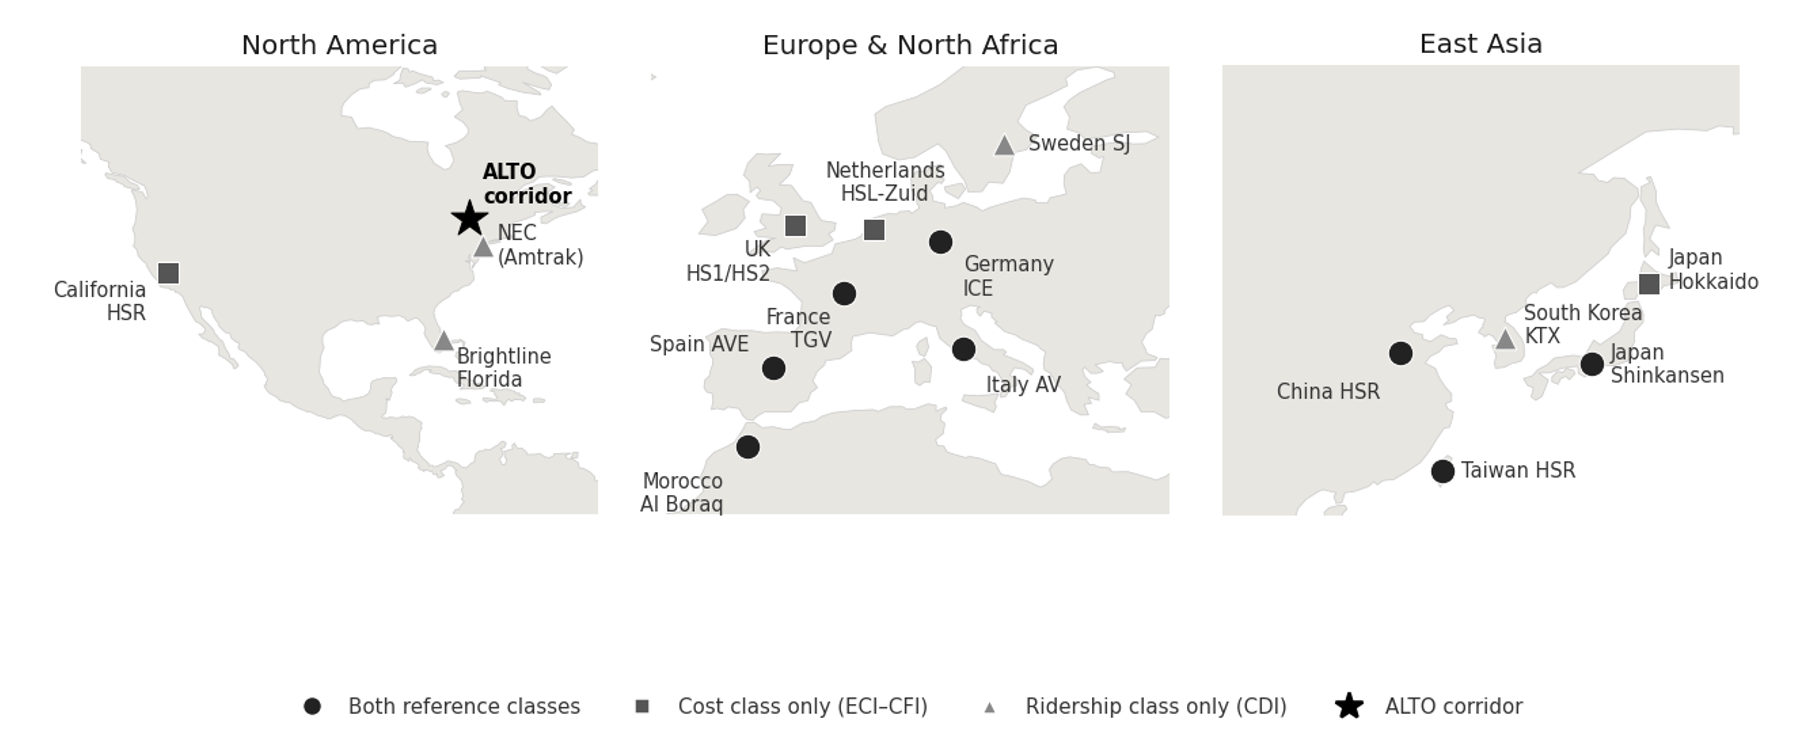
    ALTO’s published cost range of $60–90 billion comes from an early-stage estimate — the type quantity surveyors flag as accurate only to within roughly ±50%, which makes it a planning figure, not a firm commitment. Our own cost model, built from 16 comparable rail megaprojects worldwide and calibrated to those projects’ actual outcomes, puts ALTO’s realistic central cost at around $143 billion, with a worst-case scenario approaching $200 billion or more once cold-climate engineering risk (frost-susceptible clay, karst terrain, freeze-thaw cycles at high-speed tolerances) is factored in.

    2.3.4 · No independent study backs the ridership numbers

    ALTO projects 24 million riders a year by 2055. No car-dependent North American corridor without existing high-speed rail has ever come close to that. Research on transportation megaprojects generally finds ridership forecasts overstate actual results by about 51% on average. Our own bottom-up model — built from corridor population, trip-making patterns, and VIA’s own ridership data, tested under three different fare and subsidy scenarios — puts 2055 ridership at 3.7 to 17.2 million, with 9.2 million as the central estimate. ALTO’s 24-million target sits 40% above even our upper bound.

    Source2055 ridership estimate
    ALTO’s public target24 million
    ALTO’s internal Corporate Plan figure (by 2059)17 million — about 30% below the public figure
    McGill TRAM stated-preference study~19.7 million (year 50)
    Munk School (U of T) model18–19 million (year 30)
    Standard bias correction applied to ALTO’s own figure8.4 million
    Initiative bottom-up model, central case9.2 million (range: 3.7–17.2 million)
    The pattern here too

    Every independent forecast built from a published methodology lands within or close to our range. ALTO’s own public target is the outlier — and it’s the one figure whose methodology has never been disclosed.

    2.4 · Why Patching It Won’t Work

    These aren’t execution problems — they’re the project’s founding choices

    A different route doesn’t fix the business case. A revised ridership forecast doesn’t fix the cost problem. Tighter project management doesn’t undo the fact that funding was committed before the business case was finished, on a specification set by the bidding process rather than by public need. Four reasons why this can’t be corrected from within:

    It’s been treated as one-of-a-kind, so nothing gets checked against it

    ALTO’s documentation consistently describes the corridor as having no real comparator, which is exactly the reasoning pattern researchers have found opens the door to over-optimistic numbers. Every genuinely comparable project elsewhere in the world gets waved away as not relevant — leaving the project’s own estimate as the only “evidence” available.

    The most optimistic version of the numbers is the one that won

    In competitive funding processes, the most optimistic projection tends to win, because optimism produces a better-looking business case than realism does. A version built on our reference-class numbers — a benefit-cost ratio of 0.03–0.11 — could never have survived the funding decision. The optimistic version did, but only because the more realistic numbers weren’t available yet when the commitment was made.

    The first segment is too weak to stand alone — which is exactly the point

    The planned first segment, Ottawa–Montréal, is the corridor’s weakest market: roughly 98% of that travel is currently by road, and there’s barely any competing flight traffic for a speed premium to beat. It can’t pay for itself. Its economics only work if the network keeps extending toward Toronto — which locks in a public commitment to the rest of the corridor before its full price has ever been disclosed. Britain’s HS2 project shows how badly this can go if it doesn’t: two legs cancelled, leaving a line more than double its original budget serving less than half the original network. HS2 at least stranded into its strongest market. If ALTO’s later phases stall, it strands into its weakest.

    The alternative is quietly being closed off while this proceeds

    The report’s proposed alternative, HPR, would run alongside the existing Highway 401 corridor. Ontario’s ongoing 401 widening is already consuming the road margin that alternative would need, section by section. Every year ALTO’s planning phase continues is a year in which that door narrows further — a real cost that doesn’t show up in any of ALTO’s published figures.

    What’s Next

    What’s in the rest of this report

    This chapter has traced one argument in four parts: the corridor’s need is real (2.1); a modest upgrade became a much bigger project during procurement (2.2); the resulting project has four structural problems (2.3); and none of it can be fixed by refinement (2.4). The chapters that follow set out the alternative.

    Ch. 3
    The HPR alternative. How a passenger line built along the existing Highway 401 and rail corridor can free up freight capacity at the same time, instead of building an entirely new line elsewhere and leaving the freight problem untouched.
    Ch. 4
    Route and cost. Where the line would go and what it would cost, using the same cost model applied consistently to both ALTO and HPR.
    Ch. 5
    Environment and communities. How the two options compare on carbon emissions and disruption to the communities along the route.
    Ch. 6
    How many people would ride it. Ridership estimates built on the real-world pattern, checked four different ways.
    Ch. 7
    Running costs. The ongoing yearly balance between what it costs to operate and maintain the railway, and what fares plus any subsidy bring in.
    Ch. 8
    Is it worth it. A full cost-benefit and financial analysis across a range of scenarios, including the value of the freed-up freight capacity.
    Ch. 9
    Getting it built. How to phase construction, manage the risk of cost overruns, and keep the project accountable to the numbers in this report.
  • Deconstructing the Megaproject Playbook

    Coalition for Better Rail · ALTO HSR Citizen Research Initiative · The HPR Research Report

    Deconstructing the Megaproject Playbook

    Why big rail projects almost always cost more and carry fewer riders than promised — and how to check a project’s numbers against the real-world record, not just its own promises.

    This chapter explains the method behind every number in this report. It’s based on the work of Bent Flyvbjerg, an Oxford researcher who has spent decades studying how big infrastructure projects around the world actually turn out, compared to what they promised. His findings have been confirmed again and again, across many countries and many kinds of projects. We use his method for every forecast in this report — and we’re explaining it here first, before any of our own results, so you can see the rules before you see the numbers.

    Download
    Chapter 1: Deconstructing the Megaproject Playbook (PDF)
    The full chapter, with footnotes and sourcing
    Download PDF
    1.1 · The Track Record

    The iron law of megaprojects

    Here’s an uncomfortable fact: big public infrastructure projects almost always cost more, take longer, and carry fewer passengers than promised. This isn’t bad luck on any one project — it’s been true again and again, everywhere records have been kept, for decades. Researcher Bent Flyvbjerg calls this the iron law of megaprojects: over budget, over time, under benefits — over and over again, regardless of country, project type, or how sophisticated the planning was.

    1.40×
    What rail projects actually cost, on average, vs. what was first promised
    0.66×
    The benefits rail projects actually deliver, on average, vs. what was promised
    52%
    Average budget overrun for high-speed rail specifically
    106%
    How much rail projects overestimate rider numbers, on average
    9/10
    Rail projects that predicted more riders than they actually got
    +45%
    How much longer construction takes than planned, on average

    Our own analysis of ALTO finds the same pattern. The published benefit-cost ratio — a standard measure of whether a project’s benefits are worth its costs — is already far short of break-even. The December 2021 business case for the predecessor project put it at about 0.13 over 30 years, or about 0.4 once some newer and less established benefit categories are counted. A ratio of 1.0 is the point where benefits merely equal costs. Correct the cost and ridership numbers using the real-world track record, and that ratio falls further still. This doesn’t mean going over budget is inevitable. It means any assessment that ignores this well-documented pattern is starting from an unrealistic place — not by accident, but by leaving out the most relevant evidence available. ALTO’s risk profile isn’t an unlucky exception. It’s exactly what you’d expect from a project of this size, this type, and this level of political backing.

    1.2 · Two Reasons Forecasts Go Wrong

    Honest mistakes and strategic misrepresentation

    There are two different reasons a project forecast can turn out to be wrong — and it matters which one is at play, because they call for very different fixes.

    Optimism bias — the honest mistake

    Planners genuinely believe their numbers. They aren’t lying — they’re not even aware they’re being too optimistic. This is a well-documented pattern in psychology: people naturally focus on the details of their own project and forget to check how similar projects have actually gone in the past. It’s a fixable process problem — the fix is forcing real-world comparisons into every estimate.

    Strategic misrepresentation — telling people what they want to hear

    Costs get underestimated and benefits get overestimated on purpose, to get a project approved and funded. Writing about the research record as a whole, Flyvbjerg borrows a word from ethics and calls this what it is: lying. It’s an incentive problem — and it’s only fixed by changing what forecasters are rewarded and held accountable for.

    In real projects, both are usually present together, and the mix shifts with the stakes. For small, low-attention projects, honest mistakes tend to be the bigger factor. For large projects with strong political backing — the kind a minister or a Crown corporation needs approved — strategic misrepresentation tends to dominate, with honest optimism layered on top rather than absent.

    The pattern, stated plainly

    Underestimate the cost, overestimate the benefit, and you get funded. This isn’t random. It points in exactly the direction that wins the competition for a limited pool of money.

    1.3 · Structural Profile

    Where ALTO sits on the scale

    Flyvbjerg’s research lets us predict, in general terms, which kind of error is more likely for a given project — without needing to know what’s in anyone’s head. For small projects that don’t attract much political attention, honest mistakes are usually the bigger factor. For large projects with major political weight behind them, strategic misrepresentation usually is — with honest mistakes still layered on top.

    Diagram showing how the mix of honest mistakes and strategic misrepresentation shifts with project size and political pressure
    Figure 1.1. How the mix of honest mistakes and strategic misrepresentation changes as a project gets bigger and more politically important. Honest mistakes (dashed line) matter more for small, low-pressure projects and fade — but never fully disappear — as projects grow. Strategic misrepresentation (solid line) is close to zero for small projects but rises sharply and takes over for large, high-pressure ones. Large, politically backed projects competing for scarce funding sit at the right-hand end of this scale.

    ALTO checks every box that predicts heavy political pressure. It’s run by a federal Crown corporation with a multi-billion-dollar budget. It has had public backing from successive governments. And it’s competing against every other federal priority for a limited pot of money. By this framework’s own logic, projects in that position sit at the end of the scale where the research expects political pressure, rather than honest error, to account for most of the pattern across the class. The pressure to look good is strongest exactly where the numbers matter most for getting funded.

    Flyvbjerg calls this the survival of the unfittest: it isn’t necessarily the best projects that get built — it’s the ones that look best on paper. The approval process quietly rewards optimistic numbers over honest ones: a proposal with realistic costs and realistic ridership loses the funding contest to one that doesn’t. Seen this way, the fact that ALTO has survived several rounds of budget approval isn’t proof its numbers are wrong — but it is a reason to look at them carefully rather than take them at face value.

    To be clear

    None of this requires anyone at ALTO to be lying. An honest mistake would produce errors that go in both directions about equally — some projects under budget, some over. What actually happens, again and again, is that the errors all point the same way: costs come in higher, benefits come in lower. That one-directional pattern is the tell. It is why this report checks ALTO’s published figures against the real-world record instead of accepting them on their own terms. Nothing here identifies the cause of any particular number, and this report makes no claim about the honesty of any person or organisation.

    1.4 · The Uniqueness Trap

    Why “it’s different this time” doesn’t hold up

    One of the most common — and most costly — mistakes in big project planning is treating a project as one-of-a-kind, and therefore exempt from comparison with anything else. ALTO has been promoted as Canada’s first true high-speed railway, on uniquely Canadian geology, on an unprecedented corridor. That’s exactly the kind of claim researchers have found, again and again, opens the door to over-optimistic forecasting.

    Diagram contrasting a uniqueness claim, which leaves nothing to compare a project against, with the outside view, which checks the estimate against similar projects elsewhere
    Figure 1.2. The uniqueness trap. Claiming a project is unique (left) leaves nothing to compare it to, so all you can do is trust the project’s own estimate. Looking at similar projects elsewhere (right) means checking that estimate against real-world evidence instead. This report takes the second approach throughout.

    Here’s why the “unique” claim matters so much. If a project is truly one of a kind, there’s nothing to compare it to — which means the only evidence left is the very estimate you’re trying to check. Every comparable project, every real-world outcome from similar lines, gets waved away as not relevant. This report takes the opposite view: ALTO is one example of a well-studied category — high-speed and intercity rail megaprojects — and there’s plenty of real-world data on how that category actually performs. That data is the most relevant evidence available.

    What the disagreement is really about

    The disagreement between this report and ALTO’s own numbers isn’t really about any single figure. It’s about whether ALTO should be judged purely on its own terms, as a one-off case — or against how similar projects have actually turned out.

    1.5 · Risk of Bad Surprises

    Why standard contingency budgets fall short

    Standard project planning assumes cost risk is spread fairly evenly around a central estimate — like a bell curve — so a reasonable contingency budget can be calculated with simple statistics. The real-world data don’t support that assumption. Big infrastructure projects almost never come in significantly under budget, but they regularly come in massively over — by two or three times the original estimate in the worst cases. Statisticians call this a fat-tailed distribution: the chance of a very bad outcome is much higher than a normal bell curve would suggest.

    Chart comparing the real-world pattern of rail megaproject cost overruns to a normal bell-curve distribution, showing a much higher chance of large overruns
    Figure 1.3. The real pattern of cost overruns on rail megaprojects (solid line) has a much bigger chance of large overruns than a normal bell curve (dashed line) would predict. A typical 10–15% contingency budget looks safe against a bell curve — but against the real-world pattern, it may only cover half of projects, or fewer. The shaded area shows the range of bad outcomes a standard contingency budget doesn’t account for.

    This matters directly for how much money a project should set aside for the unexpected. A standard 10–15% buffer looks adequate if you assume a bell curve — but against the real-world pattern, it may only protect against half of possible outcomes, or fewer. That’s why this report carries three cost figures all the way through its financial model — the number as originally specified, a corrected central estimate based on similar projects, and a worst-case scenario — instead of relying on one confident number that history suggests is likely to be wrong.

    1.6 · The Fix

    Checking the numbers against the real-world record

    The standard fix for both problems above is simple in principle: find a group of similar past projects; look at how their costs, benefits, and ridership actually turned out compared to what was promised; then use that real-world pattern to sanity-check the new project’s own estimate, rather than taking that estimate at face value. This flips the usual burden of proof — the real-world pattern becomes the starting assumption, and anyone predicting something better has to explain why.

    World map showing the countries whose rail systems were used for comparison in this report's cost and ridership models, spanning Europe, East Asia, North Africa, and North America, with the ALTO corridor marked for reference
    Figure 1.4. Where the comparison projects are. They span Europe, East Asia, North Africa, and North America — different countries, different governments, different planning systems. That range matters: it shows the patterns we rely on aren’t specific to any one country’s way of doing things. ALTO’s corridor is shown for reference.

    What it costs

    We compared 16 real high-speed rail projects worldwideWe looked at what actually drove the final cost per kilometre on 16 comparable projects, and found two things matter most: how difficult the engineering is, and how much local resistance and land-use friction a project runs into.
    Local resistance is the stronger driver in our modelOf the two, local and political resistance is the stronger predictor of final cost per kilometre — carrying roughly twice the weight of engineering difficulty in the fitted model.
    What this means for ALTOBased on ALTO’s engineering difficulty and level of local resistance, this points to a realistic cost of around $142 million per kilometre, with a likely range of $76–264 million per kilometre.

    How many people would ride it

    We compared 12 real high-speed rail systems worldwideWe looked at how car-dependent a region is against how many people actually use rail there.
    No car-dependent region has high ridershipNot one of the 12 systems combines heavy car dependence with high rail ridership. ALTO’s corridor scores as heavily car-dependent.
    ALTO’s target vs. the realistic estimateALTO’s own target of 24 million riders a year by 2055 is far above what any comparable region has achieved. Three independent forecasts for this corridor instead cluster around 10 million riders a year.
    The standard this report holds itself to

    A forecast that looks better than the real-world pattern isn’t more accurate — it’s less accurate. This report’s numbers are, on purpose, less flattering than what a typical project pitch would produce for the same corridor. That’s the point: this report is built to hold up under tough scrutiny, which means accepting an honest, sometimes unwelcome, comparison to how these projects actually turn out.

    1.7 · Why Now

    Canada’s changed circumstances

    The case against ALTO isn’t only about method — it’s also about timing. ALTO was approved during a period of relative calm with the US, a stable trade agreement, extra federal money after the pandemic, low interest rates, and confident population-growth predictions that made ambitious ridership numbers easier to defend. Nearly all of those conditions have since changed. Today, Canada faces US tariff pressure, pressure to diversify trade away from the US, a tighter federal budget, and a public more focused on economic resilience than on amenity projects. A passenger project of this scale — on the Initiative’s reference-class estimates, $100–200 billion — has to clear a much higher bar today than it did when it was first approved.

    Line chart of Canada and United States income per person from 2000 to 2025, showing Canada nearly matching the US during the 2011-2012 resource boom then falling to roughly 61 percent of US income per person by 2025
    Figure 1.5. Canada’s income per person compared to the US, 2000–2025. Canada came close to matching US income per person during the 2011–2012 resource boom, then fell steadily as oil prices dropped. By 2025, Canada’s income per person is roughly 61% of the US level — a gap of about $35,000. ALTO was approved near the peak of Canada’s post-pandemic economic rebound, in conditions that have since tightened considerably. Sources: World Bank World Development Indicators 2000–2024; IMF World Economic Outlook, October 2025.
    The question this raises

    ALTO is a project built for good economic times. The question for Canada in 2026 isn’t whether high-speed rail would be nice to have. It’s whether this corridor is worth the cost — and whether this design is the right answer to the problem.

    The high-speed rail systems that have actually succeeded — in Japan, France, Spain, Taiwan, South Korea — share things the Toronto–Ottawa–Montréal corridor doesn’t have: low car use, dense cities at both ends, strong local transit, and a rail culture that already existed before high-speed rail arrived. What’s left, globally, are second-tier projects on car-dependent corridors where the ridership case relies on optimistic in-house projections rather than real-world evidence. California’s high-speed rail project is the best-known example: years behind schedule, billions over budget, and in political trouble, for exactly these reasons. On the real-world evidence, the Toronto–Ottawa–Montréal corridor shares that second-tier profile.

    What’s Next

    What’s in the rest of this report

    This chapter sets out the method. The chapters that follow apply it — to ALTO, and to the alternative this report proposes, HPR (High-Performance Rail).

    Ch. 2
    Why the current plan doesn’t add up. Checks the case for doing something about intercity travel on this corridor — which we don’t dispute — against whether ALTO’s specific design actually makes financial sense.
    Ch. 3
    The HPR alternative. How a passenger line built along the existing Highway 401 and rail corridor can free up freight capacity at the same time, instead of building an entirely new line elsewhere and leaving the freight problem untouched.
    Ch. 4
    Route and cost. Where the line would go and what it would cost, using the same cost model applied consistently to both ALTO and HPR.
    Ch. 5
    Environment and communities. How the two options compare on carbon emissions and disruption to the communities along the route.
    Ch. 6
    How many people would ride it. Ridership estimates built on the real-world pattern from this chapter, checked four different ways.
    Ch. 7
    Running costs. The ongoing yearly balance between what it costs to operate and maintain the railway, and what fares plus any subsidy bring in.
    Ch. 8
    Is it worth it. A full cost-benefit and financial analysis across a range of scenarios, including the value of the freed-up freight capacity.
    Ch. 9
    Getting it built. How to phase construction, manage the risk of cost overruns, and keep the project accountable to the numbers in this report.
  • Two point two trillion

    Two Point Two Trillion

    ALTO’s headline economic claim is true of the Canada that existed in 2019. It is presented to the public as today’s.

    ⚠ Two studies, two summaries

    ALTO has commissioned two economic studies and published both. Aviseo Consulting produced a computer model of the effect of high-speed rail on the whole Canadian economy. CPCS, working with HDR, produced a study of its effect on tourism. Both reports are careful. Both state their limits plainly. Both are free to download from ALTO’s website.

    This brief is not about those studies. It is about the difference between what they say and what ALTO says they say. That difference is where the public numbers come from — and it is what a travel trade article repeated to a wide audience on July 20, 2026, without opening either report.

    What we found, in one minute

    The famous 1.1 per cent is 1.1 per cent of Canada’s 2019 economy. The Aviseo report says so on page 13, in those words. ALTO’s public pages drop the year and call the money “today’s value.” Canada’s economy is now about a third bigger than it was in 2019, so the same claim in today’s money would be about $36.5 billion, not $24.5 billion — or, if you keep the dollar figure, about 0.74 per cent, not 1.1.

    Almost all of it is one assumption. Of the $24.4 billion the model produces, $21.0 billion comes from assuming businesses in and around Toronto, Montréal, Ottawa and Québec City become 3 per cent more productive. Change that one dial to 2 per cent and the answer is $13.8 billion. Change it to 5 per cent and it is $34.5 billion. ALTO publishes the middle figure and not the range.

    The two studies disagree with each other about tourism. Aviseo counts international visitors only and says domestic tourism is mostly people spending money they would have spent anyway. CPCS builds its headline on domestic travel within the corridor. The two use different methods that cannot be added together. Neither of ALTO’s summaries mentions the other study.

    And in the tourism study’s base case, the small towns get nothing at all. Under the scenario where no extra tourism policy is put in place, Peterborough and Trois-Rivières receive zero additional visitor spending and zero additional GDP. The blog post announcing that study is titled “How High-Speed Rail Will Boost Tourism from Big Cities to Small Towns.”

    The Arithmetic

    1.1 per cent of which year?

    ALTO’s website puts the claim in one line: a “1.1% increase in Canada’s GDP ($24.5 billion in today’s value)”. GDP means the total size of the economy — everything the country produces in a year.

    Work backwards from those two numbers and you can calculate how big the economy would have to be for both to be right at once.

    $24.4B
    the benefit the study actually reports
    Aviseo report, Table 1
    1.1%
    the share of the economy that represents
    Aviseo report, page 13
    $2.22T
    the size of economy where both are true
    $24.4 billion divided by 1.1 per cent

    Statistics Canada measures the economy every three months. In the first quarter of 2026 it came to $3,321,588 million — about $3.32 trillion. That is roughly $1.1 trillion more than the figure the two numbers imply. Statistics Canada

    Two notes on these figures. Nobody has claimed that Canada’s economy is $2.22 trillion. That number is our own division of the two figures ALTO publishes together, and it is here because it is what those two figures imply about each other. And the benefit appears on this page as both $24.4 billion and $24.5 billion: the first is the number in Aviseo’s own table, the second the rounded form ALTO uses on its benefits page. They are the same estimate.

    The study explains why, and it is not hiding anything. The Aviseo model is built on Statistics Canada’s 2019 picture of the economy, chosen because 2020 and 2021 were pandemic years and the data from them is not reliable. Page 13 then states the result carefully: the gain is about $24.4 billion, which is roughly 1.1 per cent of Canada’s 2019 GDP.

    That is the whole finding. The study says 2019. ALTO’s website says “today’s value.”

    If you use the 1.1 per cent

    Applied to today’s economy, the benefit would be about $36.5 billion a year. ALTO’s published dollar figure understates its own claim by roughly a third.

    If you use the $24.4 billion

    Measured against today’s economy, that is about 0.74 per cent — not 1.1. The headline percentage is too high for the dollar figure beside it.

    There is a further wrinkle worth knowing. The model is what economists call static. It does not project forward year by year. It asks a single question: what would 2019 have looked like if the railway had already been running? The report says so directly. That means there is no discounting and no present-value calculation anywhere in it — so the phrase “in today’s value” describes a piece of arithmetic the study never performed.

    Where The Number Comes From

    Almost all of it is a single dial

    The model adds up three separate effects. The report breaks them out, so we can see exactly how much each one contributes to the $24.4 billion.

    ChannelContributionShare of total
    Productivity — businesses getting more done because cities are better connected$21.0B86%
    Labour supply — people working more hours because commuting is quicker$2.7B11%
    Tourism — extra spending by international visitors$0.8B3%
    Total$24.4B100%

    Nearly nine tenths of the headline comes from the productivity line. So it is worth knowing exactly how that number was produced.

    The modellers picked a figure from the international research for how much more productive businesses become when a fast rail link arrives. The research offers a range. They chose 3 per cent for their middle case, then applied it to the economies of four metropolitan areas: Toronto, Montréal, Ottawa and Québec City.

    Those four metros produce roughly a third of Canada’s economy. Three per cent of a third is about one per cent. The headline is close to being arithmetic from the assumption rather than a discovery about railways.

    What happens when you move the dial

    The report tests three settings. At 2 per cent, the total is about $13.8 billion. At 3 per cent, it is $24.4 billion. At 5 per cent, it is $34.5 billion. Across everything the report tests, the full range runs from $14.8 billion to $41.0 billion. ALTO’s blog post and website give one number from the middle of that range and no range at all.

    And note which places are in the calculation

    Toronto, Montréal, Ottawa and Québec City. Not Peterborough. Not Trois-Rivières. Not Laval. The model gives the productivity benefit — nearly nine tenths of the whole claim — to the four largest cities on the line and to nowhere else.

    The research the modellers drew on says these effects concentrate within about 30 kilometres of a station. Because nobody knows yet where the stations will be, the study used each city’s whole metropolitan area as a stand-in for that 30-kilometre circle. The report is open about this. It means the 3 per cent boost is applied to every business in those metros, including the great many that will never go near the train.

    Study Versus Summary

    What the reports say, and what the blog posts say

    Both studies are honest about their limits. Both blog posts announcing them are not. This is the pattern at the centre of this brief.

    What the report saysWhat ALTO’s summary says
    Aviseo: the gain is roughly 1.1 per cent of Canada’s 2019 GDP.ALTO’s blog: the analysis concludes ALTO will permanently uplift Canada’s GDP by 1.1 per cent. No year. ALTO’s benefits page: $24.5 billion in today’s value.
    Not carried:The base year
    Aviseo: results run from $14.8B to $41.0B depending on which assumptions are used.One figure, from the middle. The range appears in neither the blog post nor any public ALTO page.
    Not carried:The range
    Aviseo: the study deliberately excludes construction and operating costs, looking only at long-term effects.Presented as the economic case for building the railway. A study that excludes costs cannot tell you whether a project is worth its price.
    Not carried:The scope limit
    CPCS: the scenarios are illustrative, order-of-magnitude, and “should not be interpreted as forecasts.”ALTO’s blog: CPCS developed forecasts, and the report includes tangible projections giving real-world, objective results.
    Contradicted:The report’s own caution
    CPCS: three scenarios — $177M, $1.0B, $3.9B in added GDP, depending on how much tourism policy is coordinated.The middle figure only. The low scenario, roughly six times smaller, is not mentioned.
    Not carried:The low case
    Both reports: commissioned and paid for by ALTO. Aviseo’s cover states the work was undertaken on ALTO’s behalf. CPCS notes the opinions are the authors’ own.Both blog posts describe the consultants as independent — in the same passage that says ALTO engaged them.
    As stated:The word “independent”

    To be clear about who did what

    Neither consultancy has done anything wrong here. Aviseo tested six different sets of economic assumptions and two labour-market conditions, ran close to a hundred simulations, reported ranges throughout, and stated its base year. CPCS labelled its scenarios illustrative and warned against reading them as forecasts. The reports are the careful part. The summaries are where the caution disappears.

    Two Studies, One Question

    The two reports disagree about tourism

    Both studies estimate how much extra economic activity tourism would bring. They arrive at similar-looking numbers by opposite routes, and the two cannot simply be added together or compared.

    Aviseo — $0.8 billionCPCS — $1.0 billion
    Counts international visitors only. The report says domestic tourism is largely people spending money they would have spent somewhere else in Canada anyway, so it has limited effect on the national total.

    Uses a model of the whole economy, which subtracts activity drawn away from elsewhere.
    Its middle scenario is driven mostly by travel within the corridor — exactly the domestic tourism Aviseo set aside.

    Uses a simpler method that adds up ripple effects through suppliers and wages without subtracting what was displaced. This produces larger figures by design.
    Result:Two numbers that cannot be combined

    There is a third figure in circulation. ALTO’s FAQ page advertises $800 million a year in tourism revenue. That matches Aviseo’s contribution-to-GDP figure, which is not the same thing as revenue — and it matches no revenue figure in either report.

    So ALTO’s public materials carry a tourism benefit that is variously $0.8 billion of national output, $1.0 billion of national output, and $800 million of revenue, drawn from two studies using incompatible methods, one of which discounts the category the other relies on. Neither blog post mentions that the other study exists.

    The Small Towns

    In the base case, two station cities get zero

    The CPCS tourism study models three futures. The railway is identical in all three. What differs is how much extra tourism policy governments put in place around it — last-mile transit, regional shuttles, coordinated visitor information. The low coordination scenario is the one where the railway gets built and nothing else changes.

    CityLow coordinationHigh coordination
    Toronto$37Mup to $1,500M
    Québec City$50Mup to $500M
    Montréal (incl. Laval)$44Mup to $900M
    Ottawa-Gatineau$21Mup to $560M
    Trois-Rivières$0up to $25M
    Peterborough$0up to $35M

    Zero. Not a small amount — nothing. The report’s GDP table records the same: Peterborough unchanged at $475 million, Trois-Rivières unchanged at $318 million.

    Even under full corridor-wide coordination, Peterborough reaches up to $35 million against Toronto’s $1.5 billion — roughly 43 to 1. The blog post announcing this study is titled “How High-Speed Rail Will Boost Tourism from Big Cities to Small Towns.”

    The Initiative has examined this study in full elsewhere — its scope, the conditions attached to its scenarios, the rural corridor regions left outside its frame, and the cost side it does not count. Benefits for Stations, Costs for the Corridor

    The Missing Side

    A study that cannot tell you if it is worth it

    The Aviseo report states in its introduction that it deliberately leaves out construction and operating costs, in order to focus on long-term effects. That is a reasonable choice for the study. It has a consequence.

    A benefit figure with no cost beside it cannot answer the only question that matters: is this worth building? The report never claims to answer it. ALTO’s summary presents it as though it does, and the trade coverage went further still, running the entire economic case without a single dollar of cost anywhere in it.

    The cost side is not a mystery. It is simply somewhere else. ALTO’s published figure is $60 to $90 billion — a range its own chief executive has described as a working assumption rather than an estimate, with real numbers not expected until 2027 or 2028, after the route is chosen. The Initiative’s analysis of the full ledger puts ALTO’s central benefit-cost ratio at about 0.11, against the 1.0 that marks a project paying its way. Financial Analysis

    The shape of the published record

    The benefit is modelled in detail by two consultancies, published to two significant figures, and repeated by every outlet covering the project. The cost is a range spanning $30 billion, described by the proponent as an assumption, and resolvable only after the decision it is meant to inform has been taken. That asymmetry is the finding, not the individual numbers.

    This is the pattern the Oxford researcher Bent Flyvbjerg documents across large infrastructure projects worldwide: benefits arrive early, precisely, and in dollars; costs arrive late, as ranges, after commitment.

    The Chain

    Six weeks, and the reports were not cited

    The article that prompted this brief promised readers what others are missing about ALTO’s economics, and led on tourism. Here is what had already been published.

    2019
    The year of the economy the Aviseo model is built on. Everything downstream is expressed in this year’s terms.
    2024
    Aviseo runs the model. ALTO supplies its passenger forecasts in May and June.
    June 8, 2026
    ALTO publishes “How High-Speed Rail Will Boost Tourism from Big Cities to Small Towns,” with the full CPCS tourism report attached for download.
    June 2026
    The Aviseo report is uploaded to ALTO’s website.
    July 13, 2026
    ALTO publishes “How Alto Will Reshape Canada’s Economy,” with the full Aviseo report attached for download. It states the 1.1 per cent without the year, the range, or the cost exclusion.
    July 20, 2026
    A travel trade site publishes a long article on ALTO’s economics and tourism benefits under a headline promising what others are missing. Its two themes are the two blog posts. It cites neither report, calls the analysis independent, and contains no cost figure of any kind.

    Seven days after one blog post and six weeks after the other. The tourism angle presented as the overlooked discovery had been the subject of an entire ALTO blog post and a 42-page commissioned report, both freely available, for a month and a half.

    Why this matters more than one bad article

    Each outlet in a chain like this can be cited by the next as confirmation. A figure that has never been independently checked ends up looking like something everybody agrees on, purely because it has been repeated. In this case the answer was not hidden. It was a click away from the two blog posts the article’s themes are drawn from.

    What the article contains, and what it does not

    The article cites neither report. It describes the analysis as independent. It contains no cost figure of any kind. Its two themes are the subjects of two ALTO blog posts published seven days and six weeks earlier, each with the full commissioned report attached for download on the same page.

    Summary · July 2026

    Where things stand

    Wrong year
    “$24.5 billion in today’s value.” The study says 1.1 per cent of Canada’s 2019 GDP. In today’s economy the same claim is either $36.5 billion or 0.74 per cent, not $24.5 billion and 1.1 per cent.
    Wrong kind
    “Today’s value” describes a calculation the study never did. The model is static and contains no discounting. Its results are annual, not a one-time total.
    Not carried
    The range. Aviseo reports $14.8B to $41.0B. CPCS reports $177M, $1.0B and $3.9B. ALTO publishes one figure from the middle of each.
    Not carried
    The scope limit. Aviseo excludes costs by design. The study is presented as the economic case for a project whose price it never considered.
    Contradicted
    “Should not be interpreted as forecasts.” CPCS’s words. ALTO’s summary calls the same scenarios forecasts, tangible projections and objective results.
    At odds
    Benefits for small towns. Under the scenario where only the railway is built, Peterborough and Trois-Rivières receive $0. The blog announcing that report is titled “from Big Cities to Small Towns.”
    Unreconciled
    Two tourism figures. $0.8B from one study counting international visitors, $1.0B from another counting domestic travel, by methods that cannot be combined — plus $800M of “revenue” on the FAQ that matches neither.
    As stated
    “Independent.” Both consultancies were engaged and paid by ALTO. Both blog posts state this in the same passage that calls the firms independent, so a reader who takes the word to mean “not commissioned by the proponent” is reading it in a sense the passage itself rules out.
    Fragile
    Eighty-six per cent of the claim rests on one assumption — a 3 per cent productivity gain applied to four metropolitan economies. At 2 per cent the total is $13.8B; at 5 per cent, $34.5B.
    Sound
    The studies themselves. Both are careful, both state their limits, both are published in full and free to download. Our argument is with the summaries, not the analysis.

    What we are and are not saying

    We are not saying high-speed rail cannot bring economic benefits, and we are not criticising the consultants who did this work.

    We are saying that ALTO commissioned two careful studies and then published summaries that removed the base year, the ranges, the scope limits and the warnings — and that the resulting figures now circulate as settled facts. On the arithmetic, the position is narrow and easy to check: 1.1 per cent and $24.5 billion cannot both describe today’s Canada, and the study says which year they describe.

    ALTO could correct this in a sentence. Adding the words “of 2019 GDP” to its benefits page would make the claim accurate.

    How to read the numbers on this page

    Every figure attributed to Aviseo, CPCS, ALTO or Statistics Canada is quoted from the source listed below and can be checked there. Every other figure is our own calculation from those published inputs: the $2.22 trillion implied economy, the $36.5 billion and 0.74 per cent restatements in current terms, the observation that 3 per cent of roughly a third of national output is about 1 per cent, the 43-to-1 Toronto-to-Peterborough ratio, and the benefit-cost ratio of about 0.11, which comes from our own financial analysis and not from either commissioned study.

    Where a study or a summary does not state something, we say so rather than inferring it, and we make no claim about why any particular qualification was or was not reproduced.

    Download
    Two Point Two Trillion — Full Brief (PDF)
    The complete analysis, with all figures, tables and sources
    Download PDF
    Sources

    Where our figures come from

    1.Aviseo Consulting, An Overview of the Structural Economic Impacts of Alto: Computable General Equilibrium Modelling Approach, June 2026. Prepared on behalf of ALTO. Source of the 2019 calibration, the $24.4 billion figure, the 1.1 per cent of 2019 GDP statement (page 13), the $14.8B–$41.0B range, the channel breakdown, and the productivity settings of 0.02, 0.03 and 0.05. altotrain.ca (PDF)
    2.ALTO, “How Alto Will Reshape Canada’s Economy,” blog post, July 13, 2026. States the 1.1 per cent without the base year or range, and describes the commissioned report as independent. Links the Aviseo report. altotrain.ca
    3.CPCS, in association with HDR, Tourism in the Alto Corridor: Current Conditions and Potential Impacts, June 2026. Prepared for ALTO. Source of the three coordination scenarios, the per-city spending and GDP tables, the statement that the scenarios should not be interpreted as forecasts, and the finding on business spending declines. altotrain.ca (PDF)
    4.ALTO, “How High-Speed Rail Will Boost Tourism from Big Cities to Small Towns,” blog post, June 8, 2026. Reports the medium scenario only, and describes the scenarios as forecasts and tangible projections. Links the CPCS report. altotrain.ca
    5.ALTO, “Discover Alto’s Many Benefits,” project benefits page. Source of the “$24.5 billion in today’s value” phrasing and the construction and operational jobs figures. altotrain.ca
    6.ALTO, “Answering your questions.” Source of the $800 million annual tourism revenue claim. altotrain.ca
    7.Statistics Canada, Gross domestic product, income and expenditure, first quarter 2026, released May 29, 2026. Table 1 gives gross domestic product at market prices, seasonally adjusted at annual rates, of $3,321,588 million for the first quarter of 2026. Underlying series: Table 36-10-0103-01. Table 1  ·  Table 36-10-0103-01
    8.Rituparna Dutta Choudhury, “Canada’s Toronto–Québec City High-Speed Rail Could Unlock GDP Growth: What Others Are Missing About Alto’s Billion Dollar Economic Transformation,” Travel and Tour World, July 20, 2026. travelandtourworld.com
    9.ALTO HSR Citizen Research Initiative, ALTO Financial Analysis. Source of the benefit-cost ratio of approximately 0.11, the cost-per-kilometre model, and the achievable ridership frontier of 5 to 12 million annual trips against ALTO’s 24 million target. citizenresearch.ca
    10.ALTO HSR Citizen Research Initiative, Tourism Study brief, June 2026. Examines the scope of the CPCS study, including the exclusion of rural corridor regions. citizenresearch.ca
    11.Bent Flyvbjerg, on optimism bias and reference-class forecasting in the appraisal of large infrastructure projects.
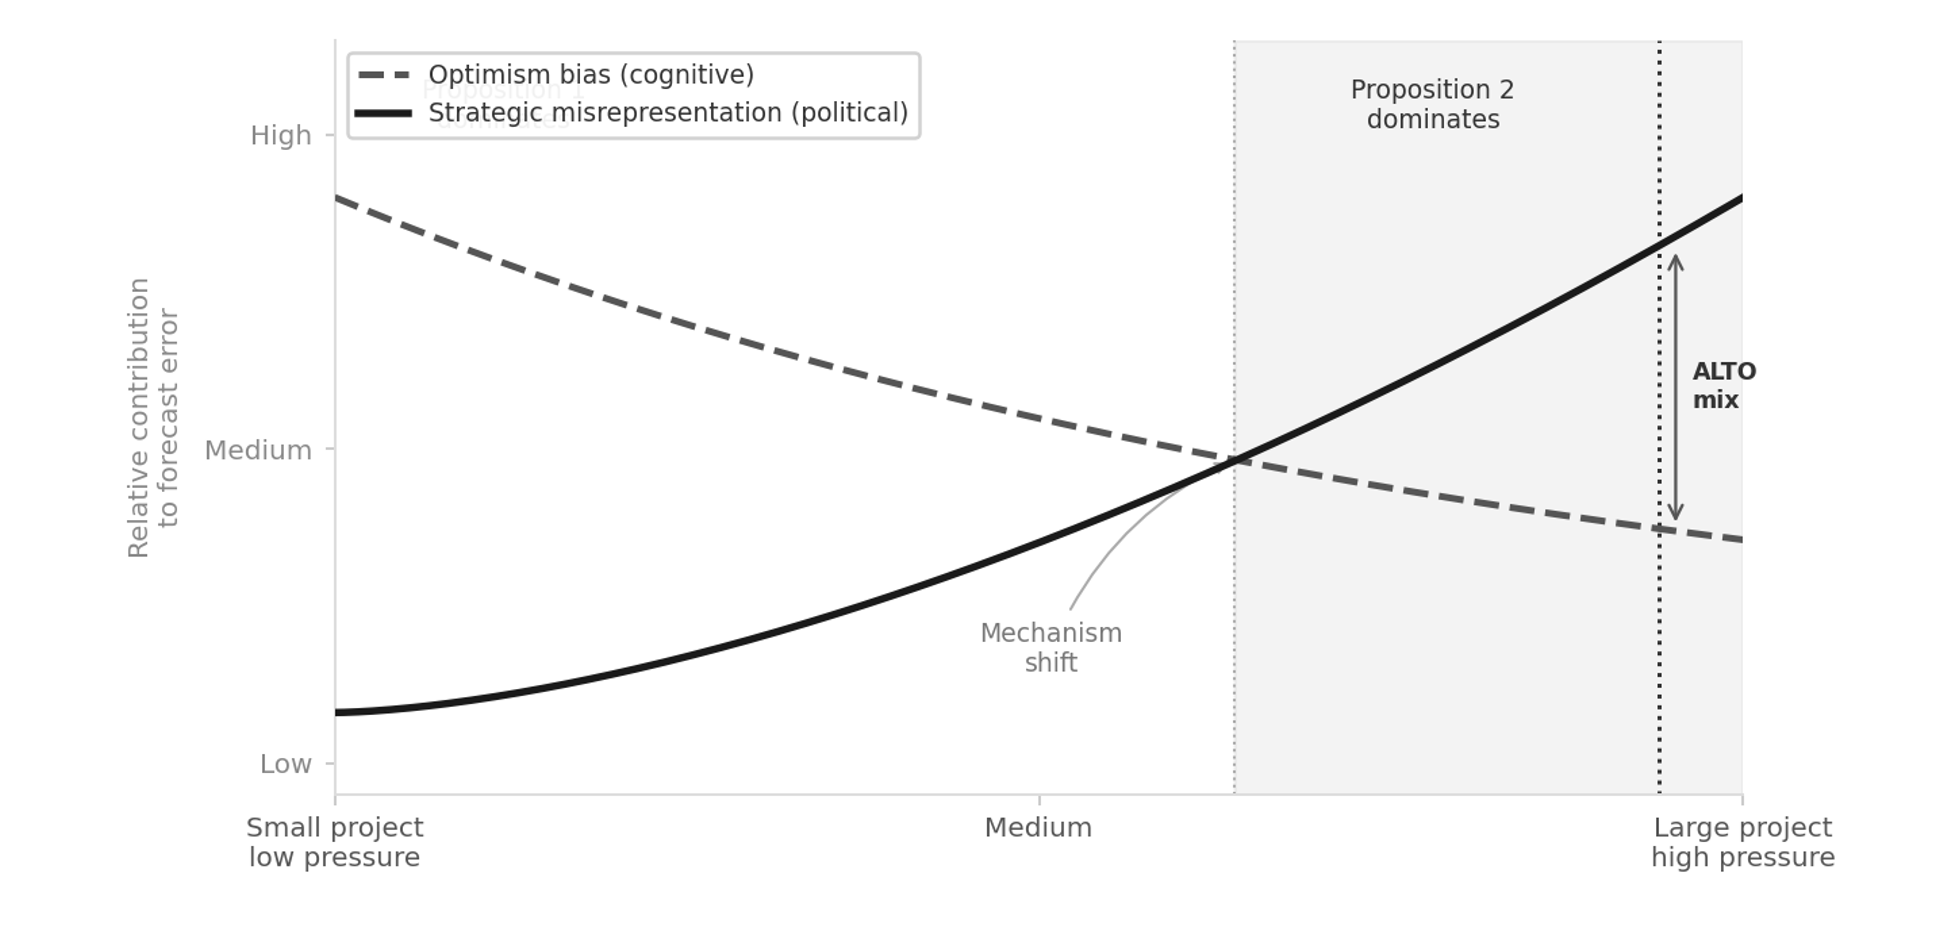
  • One missing number

    Many Benefits, One Missing Number

    ALTO’s benefits page, set against independent estimates for the corridor — and against the cost figure it never states.

    ⚠ What the page does not say

    ALTO’s “Discover Alto’s Many Benefits” page presents at least nine distinct benefit figures — GDP, jobs, tourism, road decongestion, emissions avoided, and annual ridership. It states no capital cost, no operating subsidy, and no benefit-cost ratio anywhere on the page. ALTO benefits page

    Every figure on the page is a numerator. The one number that would let a reader judge whether the benefits are worth the spending — the cost of the project — appears nowhere on it.

    Critical Finding

    The page is built on a single asymmetry: benefits are presented gross, and the cost side is absent. Restore the denominator and the picture inverts. On ALTO’s own official $60–90 billion cost the benefit-cost ratio is only about 0.1; on the Initiative’s higher independent estimate, about 0.06 — against roughly 0.44 for the lower-speed HPPR alternative. Whichever cost figure you use, the benefits recover a dime or less on the dollar, far short of the 1.0 a project needs to break even; the page asks readers to evaluate the project on numerator alone.

    On the page’s own headline figures, the ridership claim of up to 24 million passengers by 2055 is roughly 2.6 times the Initiative’s central estimate, and the sustainability claim inverts under full-lifecycle carbon accounting: the Initiative finds ALTO a net emitter of about 15 million tonnes CO₂e over fifty years, while HPPR is a net carbon sink.

    This is the standard presentation pattern of optimism bias documented in megaproject appraisal: gross benefits foregrounded, costs and risks kept off the page, and ceiling figures — “up to” — offered as though they were expectations.

    The Frame

    Benefits gross, cost absent

    The GDP line is the clearest instance. The page reports a 1.1 per cent increase in Canada’s GDP, valued at $24.5 billion “in today’s value” — a figure discounted to the present without disclosing the capital sum it is being discounted against. The Initiative’s ECI/CFI cost model puts ALTO at approximately $143 million per kilometre central; over a corridor of roughly one thousand kilometres, the capital envelope is an order of magnitude larger than any single benefit line quoted on the page. The HPPR spine, by contrast, is modelled at roughly $28–40 million per kilometre. ALTO’s own official figure, stated elsewhere, is $60–90 billion for the corridor; the conclusion here does not turn on whose estimate you take, since even on that lower number the benefit-cost ratio is only about 0.1, and on the Initiative’s estimate about 0.06.

    Presented this way, the benefits cannot be wrong — only incomplete. A gross benefit is a real quantity; it simply says nothing about whether the project earns it back. That judgement requires the two numbers the page withholds: the cost, and the ridership assumption most of the other benefits depend on.

    Comparison

    The page’s claims against the corridor’s numbers

    Each row sets a figure as ALTO states it beside the corresponding finding from the Initiative’s modelling.

    ALTO’s ClaimThe Initiative’s Finding
    Ridership. Up to 24 million passengers annually by 2055. The Initiative’s central estimate is approximately 9.2 million in 2055, rising to about 12.5 million by 2080 — roughly 2.6 times lower than the page’s figure. “Up to” marks a ceiling, not an expectation, and the figure coincides exactly with the page’s own 2041 corridor population of 24 million, inviting readers to conflate people in the corridor with trips captured.
    Emissions. 100% electric — the equivalent of removing about 100,000 cars from the road each year. “100% electric” describes operational emissions only. Counted over its full lifecycle — the embodied carbon of a 300+ km/h greenfield build, against a ridership that is itself overstated — the Initiative finds ALTO a net emitter of roughly +15 Mt CO₂e over fifty years. The lower-speed HPPR alternative, built largely on existing alignment, is a net carbon sink.
    Economic impact. 1.1% increase in Canada’s GDP ($24.5 billion in today’s value). A gross benefit stated with no cost and no netting, discounted to present value without disclosing the capital figure behind it. Set against the Initiative’s cost model, the corresponding benefit-cost ratio is approximately 0.06.
    Jobs. Over 50,000 during construction; a further 5,000 once operational. Construction employment is a project input — a cost — not a benefit. Counting it on the benefit ledger is double-counting, among the most reliably flagged errors in megaproject business cases. The 5,000 operational jobs are a genuine recurring effect; the 50,000 construction jobs are not a benefit at all.
    Road decongestion. Valued at $570 million. The figure scales directly off ridership. If the 24 million capture is roughly 2.6 times high, the decongestion benefit is proportionally overstated. Induced demand refilling freed road capacity is not addressed.
    Tourism. Approximately $800 million in revenue each year. A gross figure with no displacement netting — spending that would have occurred anyway, or shifted from elsewhere in the corridor, is not removed.
    Travel times. Toronto–Montréal ~3h; Ottawa–Montréal ~1h; Montréal–Québec City ~1h30. These times are the payoff of the 300+ km/h greenfield alignment that drives both the ~$143M/km cost and the community disruption the page does not mention. HPPR achieves competitive times at 180–240 km/h for a fraction of the cost.
    Cost of the project. Stated nowhere on the page. ALTO’s own official range, given elsewhere, is $60–90 billion; the Initiative’s independent estimate is higher, at roughly $143 million per kilometre. This is the number against which every benefit above would have to be weighed — and the one the benefits page omits.
    Three Inversions

    Where the page’s strongest claims turn over

    The sustainability claim inverts under lifecycle accounting

    The page’s environmental case rests on ALTO being “100% electric.” That describes how the trains are powered, not what building the line costs in carbon. A 300+ km/h greenfield corridor — concrete, steel, tunnelling, geofoam, land conversion — carries a large embodied-carbon debt that operational electricity does not offset, particularly once the offset is recomputed against realistic rather than headline ridership. The Initiative’s finding is a net carbon deficit of roughly +15 Mt CO₂e over fifty years, while the lower-speed HPPR alternative is a net sink. The single most quotable line on the page — sustainability — is the one the accounting reverses.

    “Up to 24 million” is a ceiling offered as an expectation

    The headline ridership number does the persuasive work of the page, and “up to” is doing the work inside it. The Initiative’s central estimate is about 9.2 million passengers in 2055. Systematic overstatement of rail ridership at the appraisal stage is one of the best-documented patterns in the megaproject-forecasting literature, and this figure fits it squarely. The Initiative’s brief The Anatomy of an Optimistic Forecast sets out the mechanism in full.

    Construction jobs are counted on the wrong side of the ledger

    The page presents “over 50,000 jobs during construction” as a benefit. In a proper appraisal, construction labour is an input the project pays for — part of its cost, not part of its return. Presenting it as a benefit counts the same money twice. This is standard in the appraisal literature, and it is one of the easier errors for a general reader to check.

    Three Numbers

    What restoring the denominator shows

    2.6×
    the page’s 2055 ridership claim over the Initiative’s central estimate
    Initiative ridership modelling
    +15 Mt
    net CO₂e over fifty years — ALTO as emitter, not saver, on a lifecycle basis
    Initiative lifecycle carbon analysis
    0.06–0.1
    benefit-cost ratio for ALTO — on the Initiative’s estimate and on ALTO’s own $60–90B; both far below 1.0 (HPPR ~0.44)
    Initiative cost & benefit model

    None of these three figures appears on ALTO’s benefits page. Each is derived from the page’s own claims once the cost and the ridership assumption are made explicit.

    Where things stand · July 2026

    Summary ledger

    Against the benefit claims as the page presents them:

    Overstated
    Ridership — “up to 24 million by 2055” is roughly 2.6 times the Initiative’s central estimate of ~9.2 million.
    Contradicted
    Emissions — the “100% electric” sustainability claim reverses to a net +15 Mt CO₂e deficit once lifecycle carbon is counted.
    Omitted
    Benefit-cost ratio — no BCR is stated anywhere; the Initiative’s central case is ~0.06.
    Omitted
    Capital cost — no cost figure appears on the page; central estimate ~$143M/km.
    Miscounted
    Construction jobs — presented as a benefit; they are a cost input, and counting them double-counts.
    Overstated
    Decongestion and tourism — gross figures that scale off the overstated ridership, with no netting for displacement or induced demand.
    Omitted
    Land and community impact — the disruption the 300+ km/h alignment requires is absent from the benefits page entirely.

    The page is titled “Discover Alto’s Many Benefits.” The benefits are real as gross figures; what the page withholds is the cost against which they would have to be set, the ridership assumption most of them depend on, and the lifecycle accounting that reverses its environmental claim. Read with those three restored, the case the page makes for the project is substantially weaker than the case it appears to make.

    Sources

    Documents and analysis

    1.
    ALTO, “Discover Alto’s Many Benefits,” altotrain.ca, page reviewed July 2026. altotrain.ca
    2.
    ALTO, “Fast Forward: Shaping Canada’s Future with a High-Speed Train,” the explanatory document referenced from the benefits page.
    3.
    ALTO HSR Citizen Research Initiative, ridership envelope modelling — central estimates: ALTO ~9.2M (2055) / ~12.5M (2080); HPPR ~8.2M (2055) / ~10.4M (2080).
    4.
    ALTO HSR Citizen Research Initiative, lifecycle carbon analysis — ALTO net +15 Mt CO₂e over fifty years; HPPR net sink.
    5.
    ALTO HSR Citizen Research Initiative, ECI/CFI cost model (ALTO ~$143M/km central; HPPR spine ~$28–40M/km) and benefit-cost analysis (ALTO ~0.06 on the Initiative’s cost and ~0.1 on ALTO’s own $60–90B; HPPR ~0.44).
    6.
    ALTO HSR Citizen Research Initiative, “The Anatomy of an Optimistic Forecast” and “A Straighter Line,” citizenresearch.ca.
    7.
    Bent Flyvbjerg, on optimism bias and reference-class forecasting in the appraisal of major infrastructure projects.
  • By their own standard

    Research Brief · Methodology

    By Their Own Standard

    Build Canada’s case for high-speed rail, measured against the megaproject method the memo itself invokes.

    ⚠ The Document Under Review

    Build Canada’s February 24, 2025 memo, Let’s Show the World How Canada Builds, was published one week after the federal high-speed rail announcement. It endorses high-speed rail in the Toronto–Quebec City corridor and names ALTO directly, while contesting only how the project is delivered — not whether the demand exists or whether the benefit–cost case closes. This brief takes the memo’s argument on its own terms, and holds it to the analytical standard the memo itself sets. Build Canada · original memo

    Critical Finding

    The memo reaches for exactly the right tools. It quotes Bent Flyvbjerg, the leading scholar of megaproject cost overruns; it calls for reference-class benchmarking against comparable lines; it demands contingency discipline; and it warns that without these, ALTO becomes another HS2 or California High-Speed Rail. On the diagnosis, the Initiative agrees.

    The memo then abandons each principle at the moment it matters. It caps contingency at the level that, on its own logic, guarantees overrun. It imports foreign unit costs from a reference class that is not comparable. And it promises true high-speed rail at a unit cost that, in Canadian conditions, only high-performance rail can plausibly reach. Applied honestly, the memo’s own method points away from its conclusion.

    The evidence produced since the announcement confirms the diagnosis the memo made and refutes the targets it set. The corridor is still being fundamentally re-routed in the project’s second year; the friction the memo proposed to legislate away has surfaced exactly where the method predicts. The case for caution on ALTO does not require rejecting Build Canada’s framework. It requires applying it.

    The Argument’s Shape

    What the memo contests, and what it does not

    The memo’s argument has a particular structure. It accepts ALTO’s entire benefit case without examination — 40 per cent of the economy, 18 million people connected, up to $35 billion a year in added GDP, travel times halved — and contests only whether the project can be built cheaply and quickly. Every one of those headline figures is the proponent’s own number, repeated approvingly. The memo never asks whether the ridership exists to fill the trains, or whether the benefits exceed the costs.

    It asks one question: can Canada build it the way France, Spain, and Japan did? To answer, it reaches for the right instruments — Flyvbjerg’s work on megaproject overruns, reference-class benchmarking, contingency discipline, and the cautionary record of HS2 and California. That choice of tools is what makes the memo worth engaging seriously, and what makes its conclusion fail. The same tools, applied with honest inputs, do not support the case the memo builds on them.

    Held To Its Own Standard

    Three flaws, by the memo’s own method

    On three load-bearing claims, the memo prescribes the opposite of what the method it cites requires. The left column states the memo’s own prescription; the right column applies the memo’s own standard to it.

    What the memo prescribesHeld to its own standard
    1. Cap contingency, including inflation, at 10 per cent. Presented as following global best practice, alongside meticulous benchmarking against French and Japanese lines.Reference-class forecasting — the very method the memo invokes — requires a larger uplift the less design is complete, because the unknowns are still unpriced. The memo itself concedes Canadian projects sit at 1–10 per cent design maturity. At that maturity, the honest uplift is routinely 40 per cent or more; a 10 per cent cap is defensible only near design completion. The prescription specifies the precise conditions under which budgets break, and calls it discipline.
    Verdict:Self-contradictory
    2. $25–40M per km; a corridor for under $50B; payback within two years. Drawn from the cost record of France, Spain, and Japan.A reference class works only if the cases are comparable, and these are not. The cited figures come from older lines, on flatter and cheaper terrain, in earlier cost eras, with no adjustment for what this corridor crosses: the granite of the Canadian Shield, the Frontenac Arch, the wetland and karst of eastern Ontario, and dense urban approaches at both ends. Importing an unadjusted foreign unit cost is exactly the non-analogous-reference-class error Flyvbjerg’s method exists to catch — committed in the section that cites him. The Initiative’s complexity-adjusted estimate runs several times higher, with a central benefit–cost ratio far below the break-even the memo treats as obvious.
    Verdict:Wrong reference class
    3. True high-speed rail at that same unit cost. Dedicated track, full electrification, grade separation, 300 km/h — delivered for $25–40M per km.In Canadian conditions, $25–40M per km is not a high-speed-rail figure at all. It is roughly the cost of a high-performance rail upgrade — incremental improvement of existing alignments, the option the memo dismisses in a single line. The memo promises high-speed performance at high-performance-rail prices. The headline product and the headline number belong to two different projects; you cannot buy the performance of one at the price of the other.
    Verdict:HSR promise, HPR price
    $25–40M
    per km — the memo’s claimed unit cost, from France / Spain / Japan
    Build Canada memo
    ≈ $143B
    reference-class capital for the corridor delivered as high-speed rail
    CRI reference-class analysis
    ≈ 0.06
    central benefit–cost ratio — against the memo’s implied two-year payback
    CRI NPV / BCR matrix

    “Payback in two years” implies a project that returns many times its capital. The reference-class evidence points to one that returns a small fraction of it. The gap between the memo’s number and the comparable record is not a rounding difference; it is the entire argument.

    What Has Happened Since

    The diagnosis confirmed, the targets refuted

    More than a year on, events have tested the memo’s promises against reality. They vindicate its diagnosis of Canadian megaproject failure and dismantle the targets it set against that diagnosis.

    A corridor still being re-routed in year two

    The memo set a target of a high-value section carrying passengers within five years, on standardized, locked-in designs, at 10 per cent contingency. Yet the corridor is still being fundamentally re-aligned — a southern-corridor study, a conditional new station at Kingston, an alignment still unchosen between north and south. That is direct evidence of the planning immaturity the memo flagged on its first page — and it makes the memo’s own targets incoherent. You cannot run trains in five years on frozen designs while you are still deciding where the line goes.

    Friction exactly where the method predicts

    The memo’s prescriptions — sever environmental review from planning, legislate automatic approvals, reduce municipalities to suggesting where infrastructure is placed rather than whether — were aimed at the precise constraints this corridor turns out to be full of: two UNESCO designations, species at risk, organized community opposition, and rural-character concerns that public consultation surfaced in volume. The Initiative’s Community Friction Index has risen from 43 to 54 since consultation began and is projected to climb further. The memo’s answer to friction is not to resolve it but to override it — and on this corridor, that is neither lawful nor likely.

    The memo’s own number makes the HPR case

    The memo dismisses improving existing rail as insufficient, insisting dedicated high-speed track is the only way. But its own affordability figure, $25–40M per km, is a high-performance-rail number — and the consultation recorded clear public appetite for improving VIA service first and preserving existing Kingston and eastern-Ontario connections. Strip the rhetoric and the memo makes the affordability case for the alternative it rejects.

    Conclusion

    The antidote that recreates the disease

    The memo casts ALTO as Canada’s escape from the HS2 and California failures. Trace its logic, though, and the resemblance runs the other way. “We will build it cheaply and quickly like France and Japan — just cap the contingency and clear the obstacles” is not the cure for optimism bias. It is the textbook expression of it, almost word for word how California began.

    The memo’s real service is that it concedes the entire framework. Flyvbjerg, reference classes, contingency discipline, planning maturity: take those tools, feed them honest inputs, and the conclusion does not survive. The case for caution on ALTO does not require rejecting Build Canada’s method — it requires applying it. Done honestly, it points not toward a sprint to high-speed rail at imported prices, but toward a high-performance upgrade of the corridor Canadians actually use, at a cost the country can defend.

    Where The Method Lands

    Summary ledger

    The memo measured against the standard it sets for itself:

    Sound
    Diagnosis — planning-maturity gap. Correctly identifies that Canadian projects enter procurement at 1–10% design versus 30–70% abroad.
    Sound
    Delivery authority. Rightly prefers a strong, technically competent public authority over dependence on a consultant consortium.
    Sound
    Reference-class benchmarking. Rightly names it as the antidote to optimism bias.
    Violated
    10% contingency cap prescribed at 1–10% design maturity — manufactures the overrun the memo warns against.
    Violated
    $25–40M/km imported from non-comparable lines without adjustment for terrain, era, or urban approaches.
    Violated
    HSR promised at HPR price. The headline product and the headline cost belong to two different projects.
    Violated
    Override of environmental review and municipal consent — aimed squarely at the corridor’s real, documented constraints.
    Refuted by events
    Five-year passenger target on frozen designs — incompatible with a corridor still being re-routed in the project’s second year.

    The memo is at its strongest where it agrees with the Initiative — on method. It is at its weakest where it abandons that method to reach a predetermined answer. Applied honestly, Build Canada’s own framework makes the case for high-performance-rail realism, not for a high-speed sprint at imported prices.

    Sources

    Primary documents and references

    1.
    Build Canada, “Let’s Show the World How Canada Builds” (memo), February 24, 2025 — the document under review. buildcanada.com/memos/how-canada-builds
    2.
    Alto, Public Consultation Report, June 22, 2026 — corridor framing, southern-corridor and Kingston-station feedback, community and environmental concerns.
    3.
    Bent Flyvbjerg, “What You Should Know About Megaprojects and Why: An Overview,” Project Management Journal (2014) — the megaproject-overrun research the memo cites.
    4.
    ALTO HSR Citizen Research Initiative — reference-class forecasting, Engineering Complexity Index regression, and de-biased cost analysis for the Toronto–Quebec City corridor.
    5.
    ALTO HSR Citizen Research Initiative — NPV / benefit–cost matrix and Community Friction Index (post-consultation update).