The Ridership Envelope for the ALTO Corridor, 2035–2080
What can the corridor actually carry? Population times trips-per-resident times modal share, scaled by a realistic phased opening — and measured against ALTO’s published 24-million target and every other independent forecast.
This note builds a 45-year ridership envelope from three multiplicands — corridor population, per-capita intercity trips, and ALTO’s modal share under three fare-and-subsidy regimes — using the modal-shift machinery from the two companion notes on rail–air and rail–car substitution, and scaling the result by ALTO’s announced three-phase opening.
The resulting envelope is then compared against ALTO’s published forecasts, the McGill TRAM stated-preference projection, the Munk School GEPL model, the C.D. Howe scenario analysis, and the federal government’s own 2021 Joint Project Office business case.
The corridor population baseline is about 14.9 million across the directly-served CMAs in 2025. The 2024–25 federal cap on non-permanent residents produced a structural inflection — Toronto’s CMA shrank by ~1,000 people in 2024–25 after gaining 269,000 the year before — creating a credible lower trajectory (0.5%/yr) that did not exist in pre-2024 forecasts and bounding the upper trajectory (1.6%/yr) below pre-2024 expectations.
Three regimes span the policy envelope: heavy subsidy ($2.5–4.5B/yr, ~38–42% capture), moderate subsidy at parity with air ($1.5–2.5B/yr, ~28–32% — the canonical business-case configuration), and minimal subsidy under P3 yield management ($0.5–1.5B/yr, ~20–23%). The combined envelope at mature operation runs from 6.1 to 25.7 million by 2080, central case 12.5 million. The 2055 reading — ALTO’s headline year — is 3.7 to 17.2 million, central case 9.2 million; the corridor is not yet at mature operation in 2055 under the announced phasing.
ALTO’s published 24-million-by-2055 figure sits ~40% above the upper bound for 2055 and is incompatible with the announced phasing under any plausible ramp curve. Every forecast built from a disclosed methodology — TRAM, Munk GEPL, the federal JPO — sits within or close to the CRI envelope. ALTO’s published targets are the outlier against every other forecast for the corridor.
Three multiplicands
ALTO’s annual ridership in any year is the product of three quantities: the corridor population served, the average number of intercity trips each resident makes per year across air, rail and car, and ALTO’s share of those trips. Forecasting ridership therefore means forecasting each multiplicand and combining their realistic ranges into an envelope of outcomes.
The two companion notes supply the modal-share machinery. Note 1 derives the air-substitution S-curve and locates the corridor’s three rail scenarios on it at travel time and price. Note 2 extends the framework to road–rail under a North American calibration anchored on VIA’s 13% rail share against road, and develops the price-ratio, group-size, gas-price and reliability sensitivities. What the two notes do not provide is the population denominator that converts share into absolute volume, the per-capita trip generation that scales the market with demographic change, the temporal phasing that distinguishes opening-year from mature ridership, and the explicit fare-and-subsidy regimes. This note adds those four pieces.
The baseline and the 2024 demographic break
ALTO directly serves CMAs from Toronto to Québec City. The 2025 baseline is about 14.9 million — Toronto (7.10M), Montréal (4.62M), Ottawa-Gatineau (1.55M), Québec City (0.86M), plus the smaller served centres (~0.8M combined).
The 2024–25 demographic year produced a structural inflection. The federal Immigration Levels Plan announced in October 2024 was the first to cap temporary residents, requiring a multi-year drawdown. The effect on the two largest CMAs was immediate: Toronto’s CMA shrank by ~1,000 people in 2024–25, following a gain of 269,000 the year before, and Greater Golden Horseshoe growth collapsed from ~313,000/yr to ~40,000. This is a structural break from the baseline pre-2024 forecasts assumed — it invalidates the linear extrapolation of the 2022–24 surge.
| Trajectory | Annual growth | 2050 | 2080 | Driver |
|---|---|---|---|---|
| Lower | 0.5% | 16.9M | 19.6M | NPR drawdown is structural; aging accelerates |
| Central | 1.0% | 19.1M | 25.7M | NPR drawdown is one-off; immigration normalises |
| Upper | 1.6% | 22.2M | 35.6M | Pre-2024 pace partly resumes after political cycle |

The trajectories are anchored on Statistics Canada’s official projections (released 27 January 2026), with a ~0.4-point corridor-CMA growth premium reflecting the directly-served CMAs’ historically faster growth — population-weighted ~1.8%/yr over 2000–2025 against the national 1.23%, moderated for Quebec’s projected demographic-weight decline and the Western redirection of interprovincial migration. The 0.4-point premium is a deliberately conservative reading, chosen so the envelope is not vulnerable to the argument that it underweights the corridor’s growth advantage.
Per-capita intercity trips
The three principal pairs together carry ~19.9 million annual person-trips across air, rail and car (Note 2). Adding the secondary pairs and intermediate-station traffic brings the addressable market to about 25 million annual person-trips — against a 2025 population of 14.9 million, a per-capita rate of about 1.68 trips per resident per year.
Over a 45-year horizon, competing effects roughly cancel. Hybrid work has structurally reduced corridor business travel below the pre-pandemic baseline, and AI-mediated meetings continue to erode marginal demand for in-person business travel — the literature consistently finds business travel adjusts more elastically to communication technology than leisure travel does. On the supporting side, urbanisation, economic concentration into the corridor, and rising affluence in the secondary centres lift demand. The net effect is roughly stable to mildly declining; this note uses a range of 1.6 to 1.8 trips per capita, central case ~1.7.
Three fare-and-subsidy regimes
ALTO’s share of the addressable market is the third multiplicand — and the dimension on which the corridor decision turns most directly. The aggregate share is a weighted blend across air, current rail and car markets on the three principal pairs, with realistic group composition (a mix of solo, couple and family travellers) rather than the solo-traveller readings that anchor the time-and-price geometry.
Heavy operating subsidy — low fares
Fares at VIA-equivalent levels (rail-to-air ratio 0.4–0.5; per-person rail-to-car ~1.0 solo), capital absorbed into the public account. Annual subsidy $2.5–4.5 billion. Captures ~85% of the air market, ~100% of existing VIA demand, ~22% of the rail+car market on a group-weighted basis. Aggregate share: ~38–42%.
Moderate subsidy — parity with air (canonical)
Fares at parity with air (rail-to-air ratio ~1.0; per-person rail-to-car ~2.0–2.4 solo). Annual subsidy $1.5–2.5 billion. Captures ~70% of air, ~95% of existing VIA demand, ~9–11% of rail+car. Aggregate share: ~28–32%. This is the configuration under which the 24-million headline is implicitly framed.
Minimal subsidy — P3 yield management
Fares above air parity (rail-to-air ratio 1.1–1.4; per-person rail-to-car 3–4 solo, above 12 for a family of four). Annual subsidy $0.5–1.5 billion — still positive, because the fully self-funded P3 model is not survivable arithmetic at any modal share consistent with the framework. Captures ~50% of air, ~80% of existing VIA demand, ~4% of rail+car. Aggregate share: ~20–23%.
| Regime | Fare structure | Annual subsidy | Air capture | Car capture | Aggregate share |
|---|---|---|---|---|---|
| A — Heavy | T–Mtl ~$80–130; rair ≈ 0.4–0.5 | $2.5–4.5B/yr | ~85% | ~22% | 38–42% |
| B — Moderate | T–Mtl ~$150–220; rair ≈ 0.9–1.0 | $1.5–2.5B/yr | ~70% | ~9–11% | 28–32% |
| C — Minimal | T–Mtl ~$220–350+; rair ≈ 1.1–1.4 | $0.5–1.5B/yr | ~50% | ~4% | 20–23% |
Opening-year is not mature-year
Ridership in any specific year depends on three timing variables: the construction schedule, the segment opening sequence, and the ramp curve on each opened segment. The 2026–2034 period is consumed by consultation, environmental assessment, expropriation, design, P3 negotiation and enabling works — none of it revenue service. Canadian P3 megaproject experience (Eglinton Crosstown, Confederation Line, Ontario Line) suggests timelines slip rather than compress; the earliest plausible phased opening is ~2038, central scenario closer to 2040.
Phase 1 — Montréal–Ottawa
Opens first: shortest (~190 km), simplest engineering, but the smallest pair. Serves only the Ottawa–Montréal demand pool (~20% of corridor) — it cannot draw Toronto flows because Toronto isn’t connected yet. Early-year ridership is structurally small.
Phase 2 — Toronto extension
The demand inflection point. Adds ~450 km and unlocks Toronto–Ottawa and Toronto–Montréal — ~60% of corridor demand. Cumulative Phase 1+2 coverage is ~80%: the full Toronto–Ottawa–Montréal triangle. Plausible window 2042–2046.
Phase 3 — Québec City extension
The most schedule-vulnerable: the St-Lawrence crossing, Leda clay risk, an unsettled routing, and an unresolved federal-provincial cost-share with Québec. Adds the final ~20%. Window 2047–2052, with a credible permanently-deferred scenario.
The ramp curve in the North American context is meaningfully slower than European comparators. Madrid–Barcelona took ~4 years to decisively overtake the air bridge, under conditions far more favourable to rail than ALTO faces; Brightline Miami–Orlando remains in financial ramp-up with bond ratings downgraded to CCC+. The envelope is calibrated against the Brightline profile for the lower and central cases and Madrid–Barcelona for the upper case.
| Years post-opening | Lower (Regime C) | Central (Regime B) | Upper (Regime A) |
|---|---|---|---|
| Year 1 | 15% | 25% | 35% |
| Year 3 | 35% | 50% | 65% |
| Year 5 | 55% | 70% | 80% |
| Year 8 | 75% | 85% | 92% |
| Year 10+ | 90% | 95% | 100% |
| Scenario | Regime | Phase 1 (Mtl–Ott) | Phase 2 (Ott–Tor) | Phase 3 (Mtl–QC) |
|---|---|---|---|---|
| Lower | C — minimal | 2042 | 2048 | 2055 |
| Central | B — moderate | 2040 | 2045 | 2050 |
| Upper | A — heavy | 2038 | 2042 | 2046 |
Under the central scenario, the corridor is at ~29% of mature potential in 2045, ~65% in 2050, and ~88% in 2055 — genuine full-corridor maturity is not reached until around 2060. ALTO’s 24-million-by-2055 figure is incompatible with the announced phasing under any plausible ramp curve: the corridor cannot be mature in 2055 if Phase 3 only opens in 2050. If Phase 3 is permanently deferred but Phases 1–2 complete, mature ridership is ~4.9 to 20.5 million across regimes — the more credible of the downside readings given Québec’s negotiating position.
Ridership, 2035–2080
Combining population, trip generation, regime and phasing produces the envelope below. The lower bound combines Regime C with the lower population trajectory and 1.6 trips/capita; the central case combines Regime B with the central trajectory and 1.7; the upper bound combines Regime A with the upper trajectory and 1.8 — each paired with its corresponding ramp curve and opening schedule.
| Year | Status | Lower (M) | Central (M) | Upper (M) |
|---|---|---|---|---|
| 2035 | Construction; no revenue service | 0 | 0 | 0 |
| 2040 | Phase 1 (Mtl–Ott) opening years | 0 | 0.4 | 1.8 |
| 2045 | Phase 1 maturing; Phase 2 opens | 0.5 | 2.8 | 9.2 |
| 2050 | Phase 1+2 maturing; Phase 3 opens | 1.9 | 6.7 | 14.8 |
| 2055 | Phase 1+2 mature; Phase 3 ramping | 3.7 | 9.2 | 17.2 |
| 2060 | All phases near-mature plus growth | 4.8 | 10.2 | 18.7 |
| 2070 | Mature plus sustained growth | 5.8 | 11.3 | 21.9 |
| 2080 | Mature plus full forecast growth | 6.1 | 12.5 | 25.7 |
Figures 2a–2c plot the year-by-year trajectory under each regime separately. Within each figure, the three lines are the demographic trajectories; the spread within a figure shows demographic uncertainty, and the spread across the figures shows the fare-and-subsidy choice — a policy decision, not an infrastructure one. The 24-million target is marked on each as a reference.

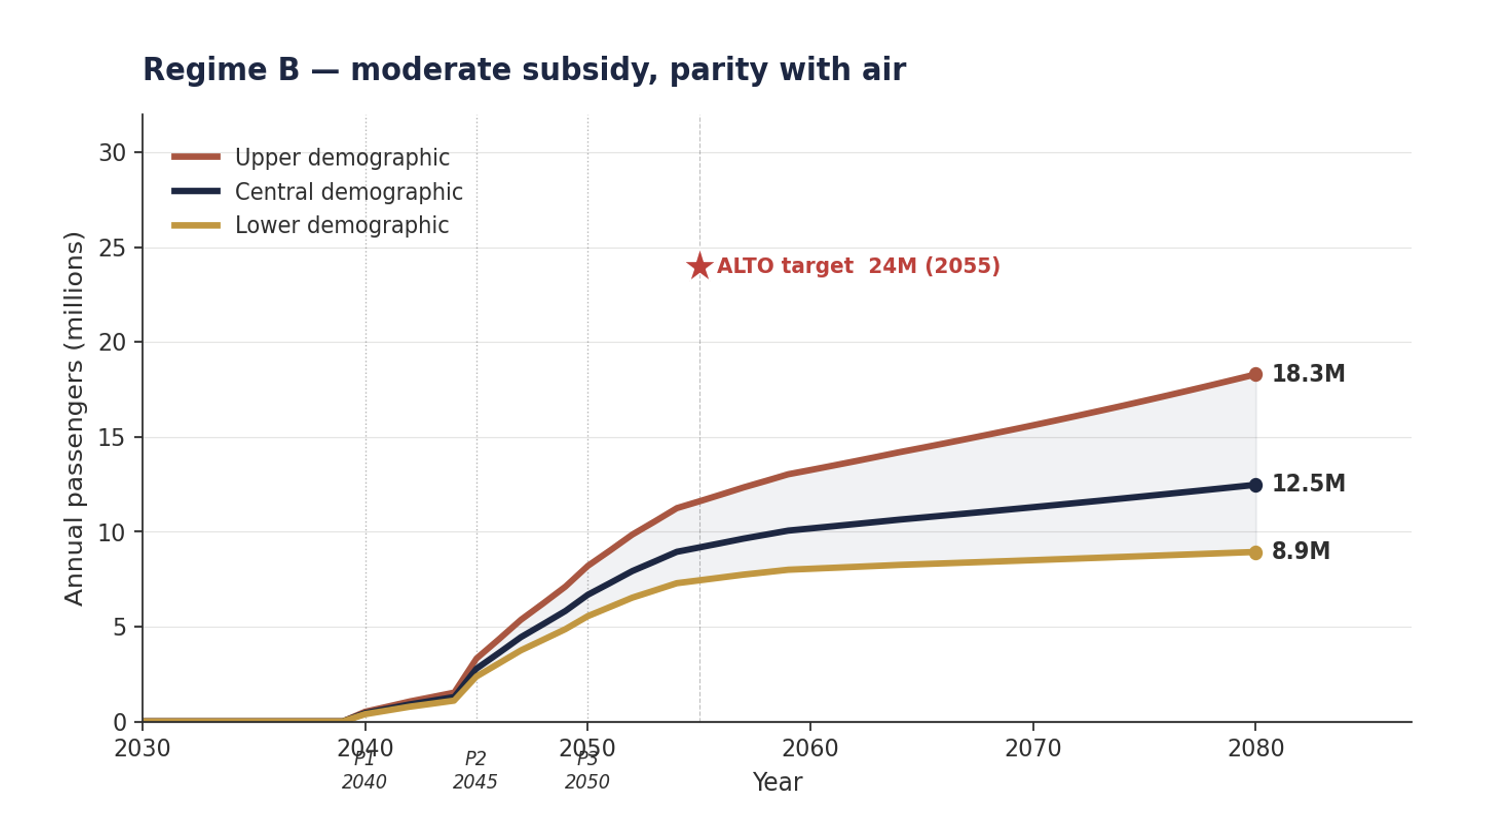
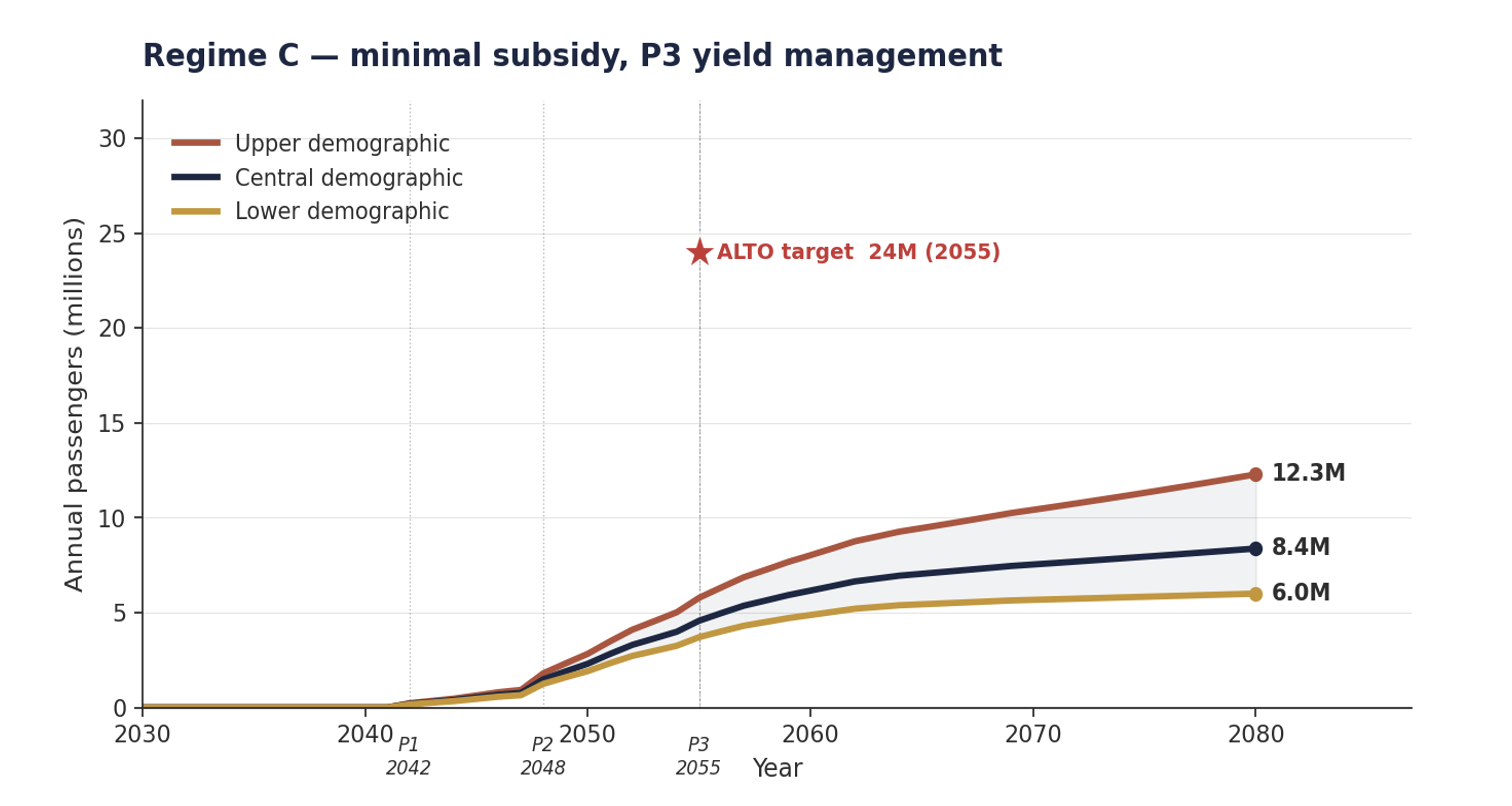
Three patterns emerge. The regime choice (a policy lever) shifts 2080 central ridership by a factor of ~2 — 17.5M (A), 12.5M (B), 8.5M (C). The demographic choice shifts it by another factor of ~2 — 12.5M (lower) to 25.7M (upper) under Regime A. And the 24-million target sits above every plausible 2055 trajectory in every figure: the closest reading, Regime A with upper growth, produces 17.2M — 28% below the target. Reaching 24M by 2055 requires the most favourable regime, a demographic trajectory above the upper case, and a corridor fully mature by 2055 — three conditions that cannot all hold under the announced phasing. The Regime A upper trajectory does reach the 24M neighbourhood — but a full quarter-century later, in 2080.
ALTO’s target is the outlier
The CRI envelope can be placed alongside the other published forecasts for the same corridor. The pattern is unambiguous: every forecast built from a disclosed methodology clusters near the CRI envelope, and ALTO’s public targets stand alone above all of them.
| Source | Method | By 2050 | By 2055 | By ~2080–85 |
|---|---|---|---|---|
| ALTO public targets | Not disclosed | — | 24M (2055) | 43M (2084) |
| ALTO Corporate Plan | Treasury Board filing (incl. Local Services) | — | 17M (2059) | — |
| McGill TRAM | Stated-preference survey, n ≈ 8,300 | 10.5M | — | ~19.7M (yr 50) |
| Munk School GEPL | Disclosed logit with induced demand | ~16–17M | ~18–19M | — |
| C.D. Howe | Scenario analysis on VIA’s forecasts | 12–21M | — | — |
| Federal JPO 2021 | Pre-procurement business case (HFR spec) | ~13.5M | — | — |
| Flyvbjerg adjustment | ALTO −65% reference class | — | 8.4M (from 24M) | 15M (from 43M) |
| CRI envelope | Modal-shift × population × regime | 1.9 / 6.7 / 14.8 | 3.7 / 9.2 / 17.2 | 6.1 / 12.5 / 25.7 |
The dispersion among the disclosed-methodology forecasts is narrow — TRAM at 10.5M by 2050, Munk GEPL at 16–17M corridor-equivalent, the JPO 2021 at 13.5M, and C.D. Howe’s 12–21M range all sit in the same zone. The CRI central case sits on the conservative side of this cluster; the CRI upper bound sits centrally within it. The dispersion between the cluster and ALTO’s public targets, by contrast, is wide: the 24-million figure is ~40% above the CRI upper bound for that year, more than double the TRAM number, and 14% above the top of the C.D. Howe range. Notably, ALTO’s own Corporate Plan figure of 17M by 2059 — filed with Treasury Board — is ~30% below its public 24M figure and closer to the CRI upper bound; the reconciliation of the two ALTO figures is not publicly disclosed.
Why the CRI envelope sits below the cluster
The CRI central case sits below the disclosed-methodology cluster, and its upper bound sits centrally within it. This is not a forecasting error in those studies — they were built for different purposes, finalised on different timelines, and applied different assumptions where the modal-shift literature offers latitude. Six factors account for the bulk of the divergence, in roughly descending order of impact.
1. The 2024 demographic inflection is post-cutoff for every other forecast
The single largest source. Every published forecast was finalised before the federal NPR caps produced observable effects. The January 2026 StatCan data was not available to any of them. ~15–25% of the gap, before any other consideration.
2. North-American modal-shift recalibration
The comparators use European-anchored elasticities. Note 2 recalibrates the rail–car curve against VIA’s ~13% road share, shifting the inflection from τ₀ = 0.65 to 0.46. ~15–25% of the gap, largest on the road-substitutable share.
3. Explicit phased opening
The CRI envelope models each phase’s own opening date and ramp; the comparators assume an implicit step-change to maturity. ~30–40% of the gap at the 2050–2055 horizon specifically, converging by 2070–2080.
4. Group-composition weighting
Family and 3+ travel essentially cannot be captured by rail at any defensible fare. Most models use an average traveller; the CRI weights across realistic solo/couple/family proportions. ~5–15% of the gap, largest on the car-substitutable share.
5. Canadian P3 vs European open-access pricing
Madrid–Barcelona’s gains came from open-access competition (25–50% fare cuts). The Cadence monopoly concession, with Air Canada’s equity stake, eliminates that mechanism. ~10–20% of the gap, largest on the lower-end scenarios.
6. Bottom-up vs top-down or stated-preference
ALTO’s targets are top-down (subject to the Flyvbjerg ~65% optimism bias); TRAM is stated-preference (overstates realised behaviour). The CRI is built bottom-up from observed VIA shares. ~5–15% of the gap, operating as a multiplier on the rest.
Taken together, the six factors are not independent surprises pushing the same way — they are mostly visible to the other forecasts too, but each embedded different assumptions where the literature offers latitude. The CRI envelope’s central case sits below the cluster because it applies all six defensible positions at once; its upper bound, by construction, relaxes the unfavourable end of each while staying internally consistent, and sits centrally within the cluster. By 2080, when the demographic, phasing and ramp factors have all played out, the CRI upper bound of 20.7M sits in the centre of the published cluster’s mature-state range. None of the comparators is wrong; each answers a different question. The CRI envelope answers a sixth: what realised annual ridership is consistent with current empirical evidence, the announced phasing, and the modal-shift literature applied to the Canadian context.