Tag: HSR economics

  • A straighter line

    A Straighter Line

    Three ways to connect the same cities — and what the government’s own yardstick says about each.

    ⚠ Companion to “Sixth in North America”

    The 2020 ministerial briefing released under A-2022-005 contains two yardsticks the federal government chose for itself: slide 2.5, a checklist of where high-speed rail works best, and slide 2.6, a benchmark table of selected HSR systems. This brief runs ALTO’s eight proposed stations through both — then tests two other ways of connecting the same anchor cities. Read the companion brief →

    The finding in brief

    On the government’s own benchmark, ALTO as planned is the longest corridor and the least demand-dense of any system in the briefing — about 14,600 people per kilometre of new track, below every benchmarked line that reports a population.

    Straightening the Toronto–Montreal spine helps only a little. The real lever is dropping the two stations that sit on no existing line, and reaching Ottawa and Quebec City on upgraded track rather than new build. Do that and the new build falls to a 540 km High Performance Passenger Rail (HPPR) spine — about 40 per cent less new track than ALTO — while demand density on new build climbs by roughly two-thirds, to mid-pack above Spain, without losing a single anchor city.

    The Yardsticks

    Two tests, chosen by the government

    Slide 2.5 lists what makes high-speed rail work: large metropolitan populations, strong local transit, an optimal corridor length between economic centres, and dense city pairs.
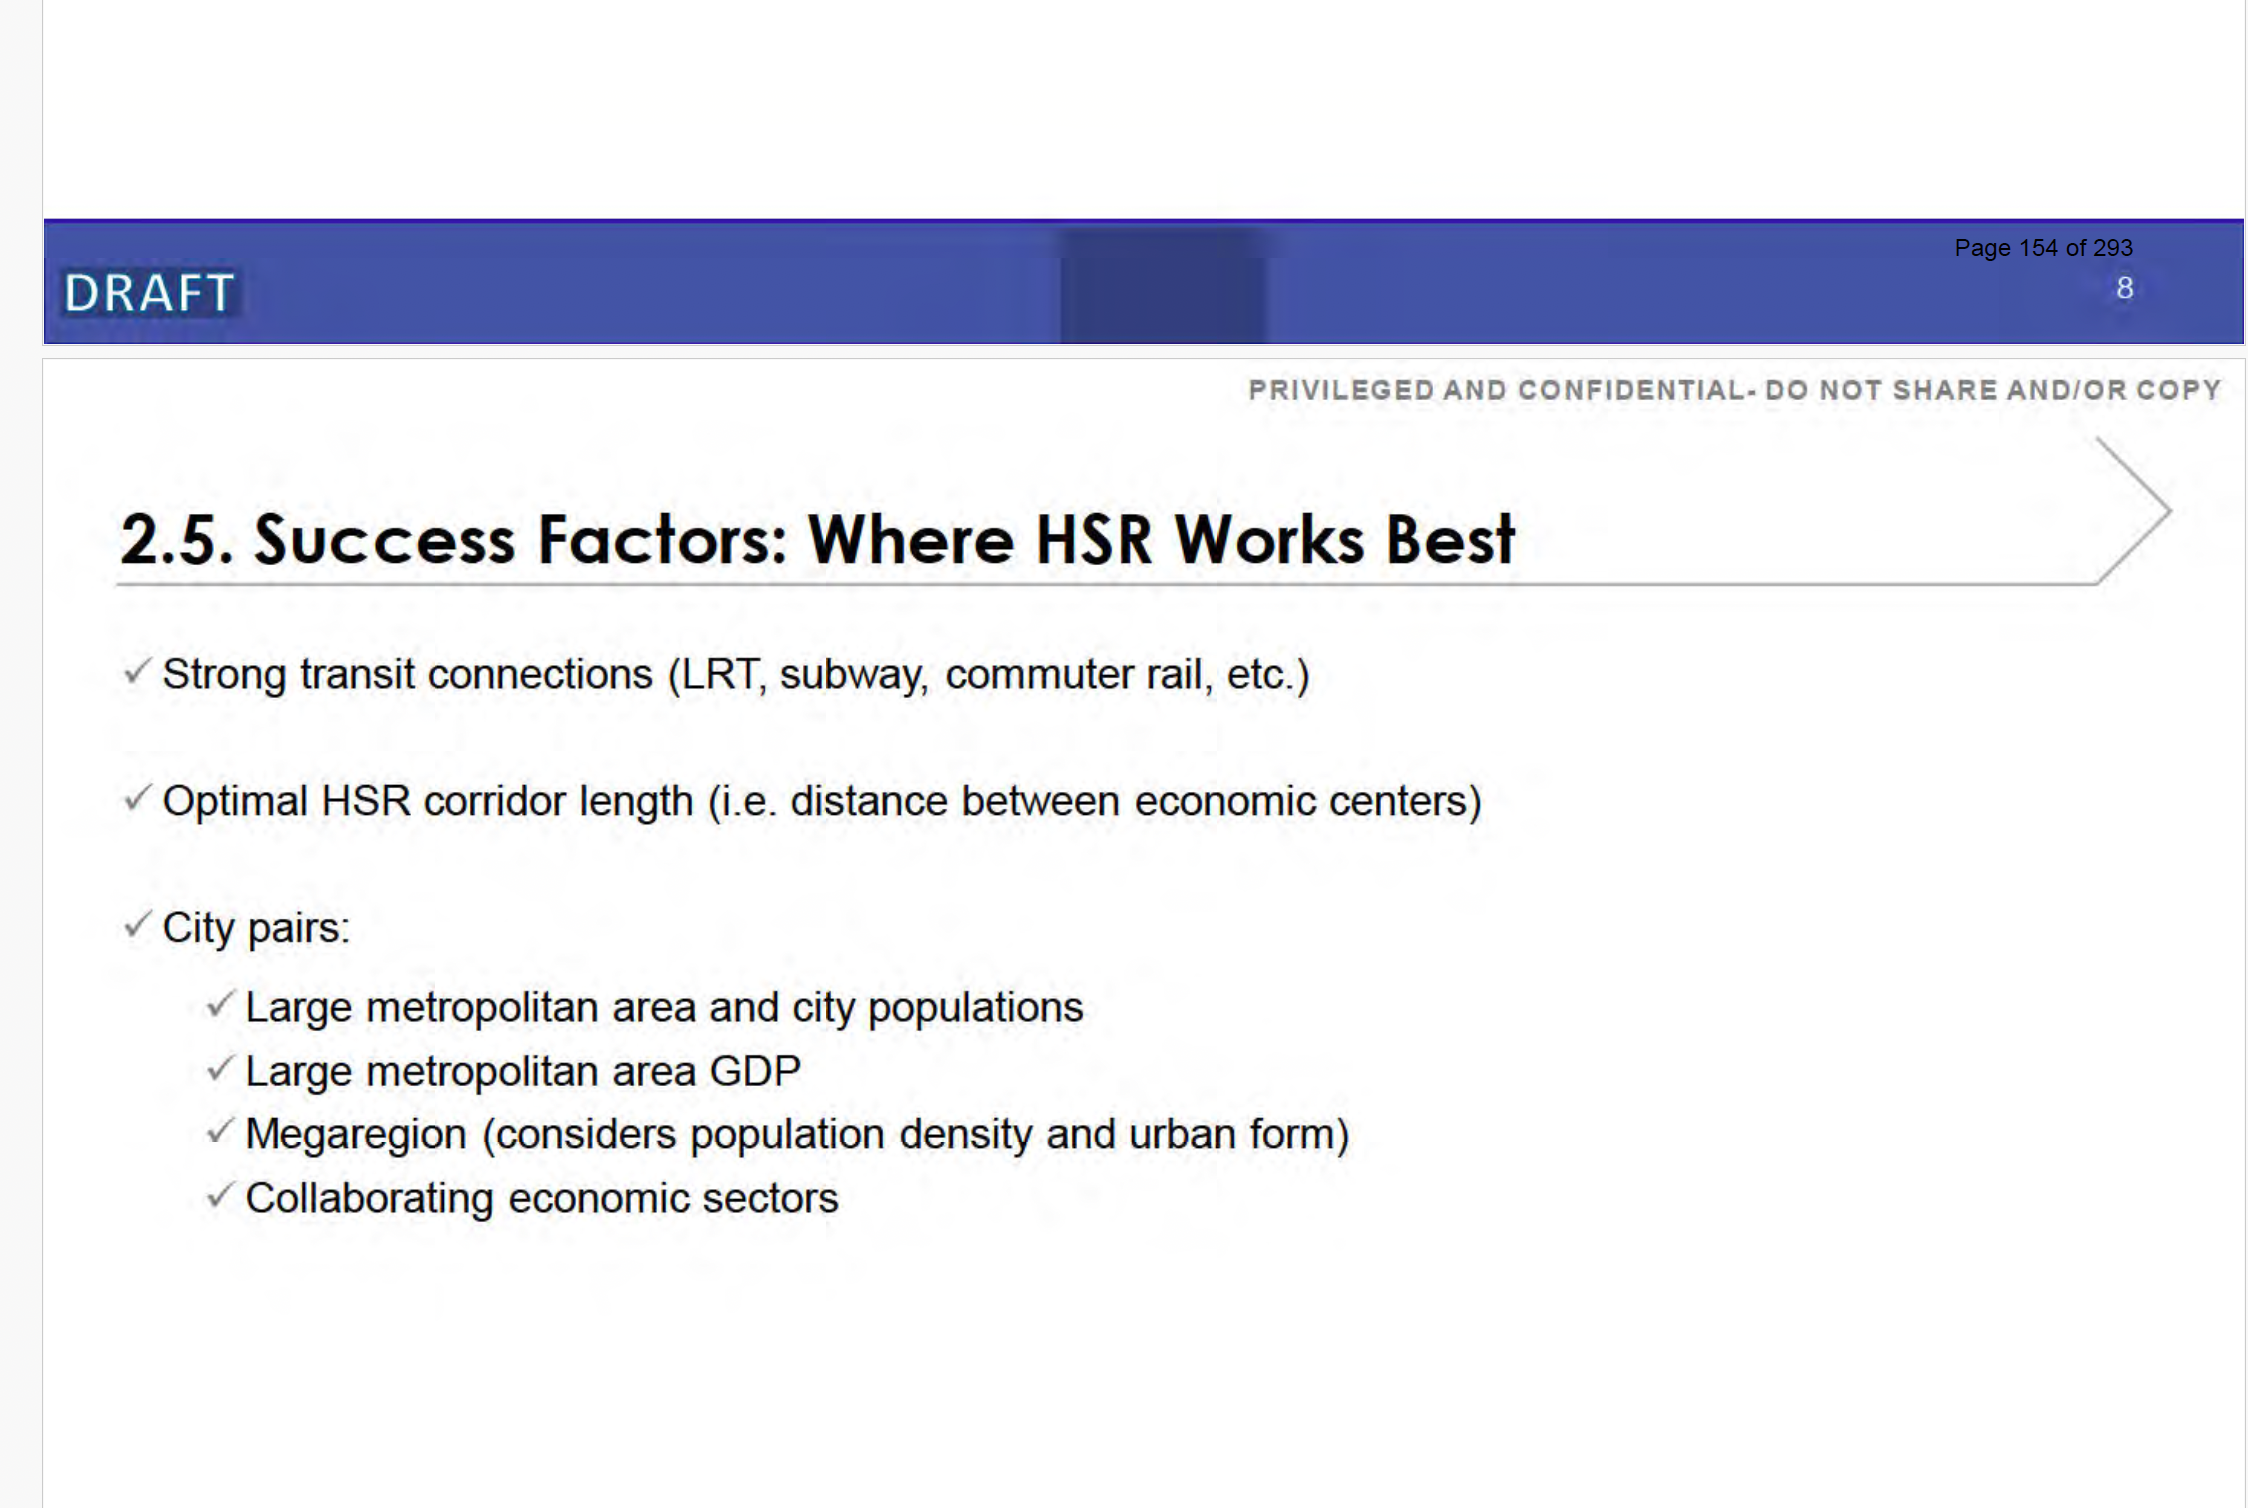
    Ministerial briefing slide 2.5, Success Factors: Where HSR Works Best, listing strong transit connections, optimal corridor length, and city-pair criteria including metropolitan population, GDP, density and collaborating economic sectors
    Slide 2.5, “Success Factors: Where HSR Works Best.” Page 154 of the Canada Infrastructure Bank release, A-2022-005 (disclosed in part; marked DRAFT) — the federal checklist of where high-speed rail succeeds.

    Slide 2.6 then benchmarks selected systems on capital cost, length, and the combined population they serve. Together the two let us score any route on the government’s own criteria — not ours.
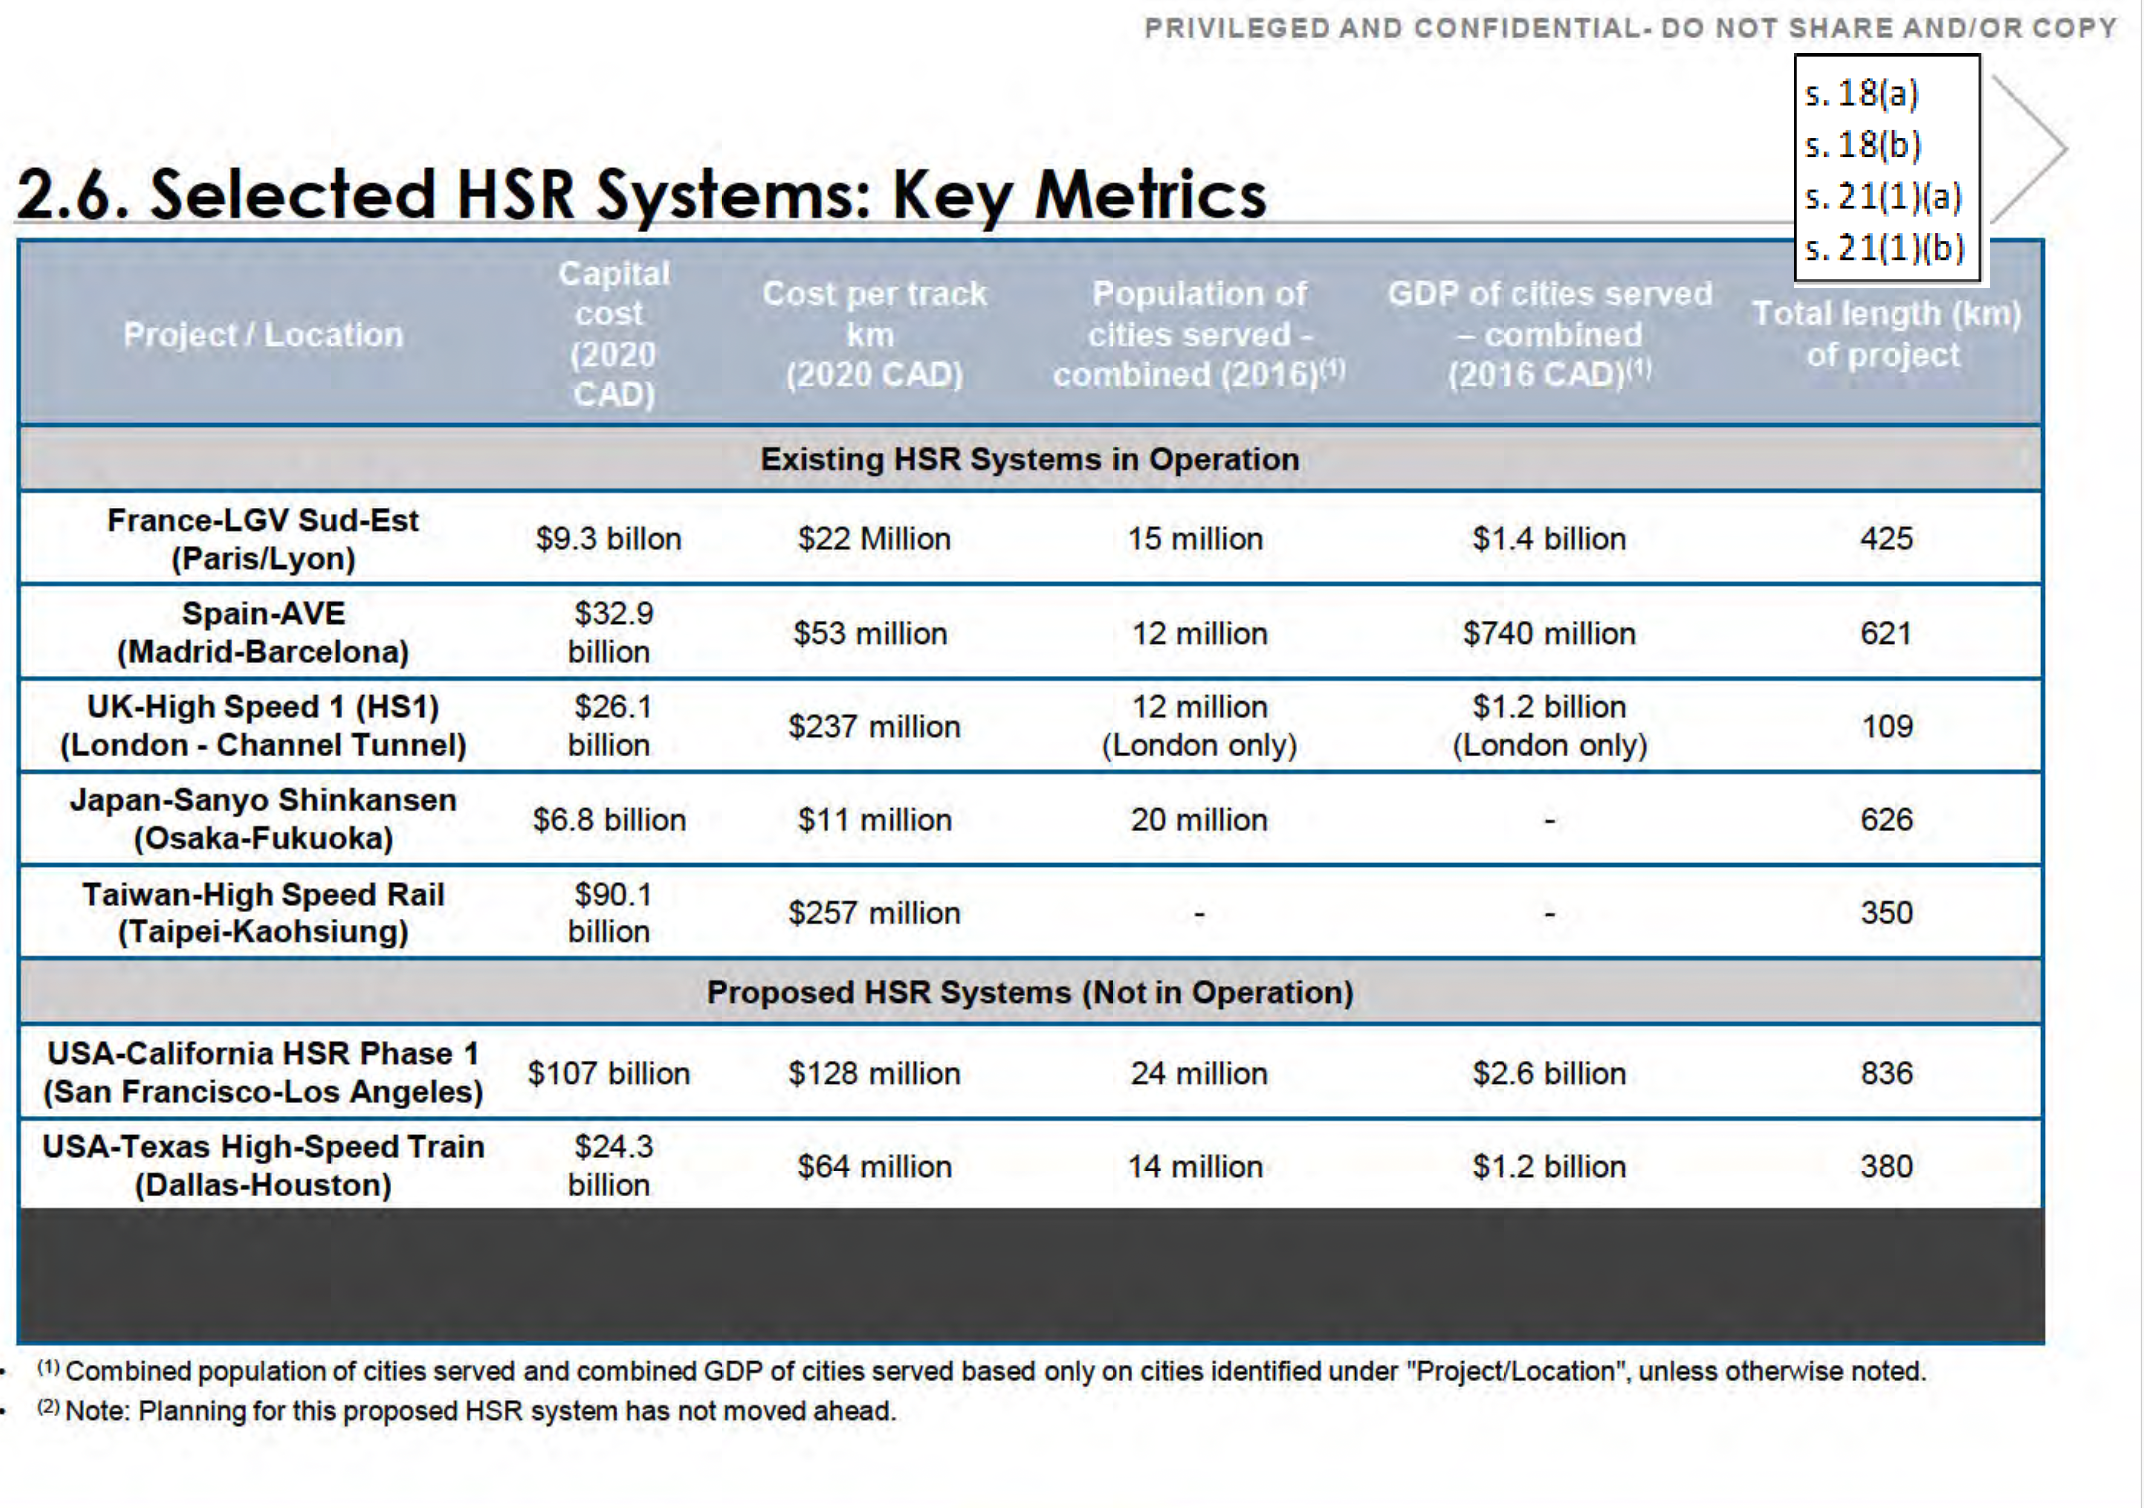
    Ministerial briefing slide 2.6, Selected HSR Systems: Key Metrics, a table of capital cost, cost per track-kilometre, population served, GDP and total length for seven HSR systems including France, Spain, the UK, Japan, Taiwan, California and Texas
    Slide 2.6, “Selected HSR Systems: Key Metrics,” from the same release (A-2022-005, disclosed in part; marked DRAFT) — the benchmark systems against which the corridor is measured below.

    Run ALTO’s eight stations through slide 2.5 and they sort cleanly into three tiers:

    Anchors — pass outright

    Toronto, Montreal, Ottawa, Quebec City: large metros with real or near-real rapid transit, at HSR-friendly distances. These are the cities the corridor exists to connect.

    Good intermediate — earns its place

    Kingston: small, but it sits on the direct Toronto–Montreal path, so it adds riders without adding distance. The methodology rewards exactly this.

    Weak — cost without a base

    Peterborough and Trois-Rivières are small and sit on no existing passenger line; reaching either means building all-new track. Laval is redundant — it is inside the Montréal CMA.

    The Ladder

    Three ways to connect the same anchors

    Hold the four anchor cities constant and change only how they are linked. Option ① is ALTO as planned. Options ② and ③ are the High Performance Rail (HPR) alternative: a new-build HPPR spine — the High Performance Passenger Rail line — on the direct Toronto–Montreal lakeshore, plus upgraded existing track for the secondary connections. ② keeps all eight stations, reaching Ottawa on the existing line and the small cities by new spur; ③ keeps Kingston on the spine, reaches Ottawa and Quebec City on upgraded existing lines, and drops the two off-corridor cities.

    Metric① ALTO as planned② Direct HPPR spine + spurs (keep all 8)③ Direct HPPR spine + Ottawa link (drop 2)
    Stations886
    Toronto–Montreal routing~650 km (detour via Peterborough/Ottawa)~540 km direct lakeshore (HPPR spine)~540 km direct lakeshore (HPPR spine)
    Ottawa connectionon the new mainlineupgraded existing (Smiths Falls–Brockville)upgraded existing (Smiths Falls–Brockville)
    Montreal–Quebec City legnew build (north shore, via Trois-Rivières)new build (north shore, via Trois-Rivières)upgraded existing (south-shore VIA line)
    New-build track~910 km~850 km~540 km
    Upgraded existing track—~80 km~350 km
    People served~13.3 M~13.3 M~13.0 M
    Demand density, new-build track~14,600 / km~15,600 / km~24,100 / km
    Position on the slide 2.6 benchmarklastbelow Spainmid-pack (above Spain)
    Off-corridor cities needing new trackPeterborough, Trois-RivièresPeterborough, Trois-Rivièresnone

    The Montreal–Quebec City leg is the pivot between ② and ③: ② builds it as new north-shore track to keep Trois-Rivières on the line, while ③ drops Trois-Rivières and serves Quebec City on the existing south-shore line, upgraded — about 260 km of the gap in new build between the two. In both ② and ③ the Ottawa connection is upgraded existing track (VIA’s Smiths Falls–Brockville line), not new build. Distances are approximate planning-level estimates; full workings with live formulas are in the reference-class workbook.

    What the Numbers Say

    Reading the ladder

    ① ALTO is the longest, least-dense option

    At roughly 14,600 people per kilometre of new track, ALTO sits below every system on slide 2.6 that reports a population — the most track for the least demand per kilometre.

    ② Straightening the spine helps only a little

    Keep all eight cities but run Toronto–Montreal direct on the HPPR spine and reach Ottawa on the existing line: new build falls to ~850 km (from ALTO’s ~910) and density edges up to ~15,600 per kilometre. Better — but still near the bottom of the benchmark, because it keeps building new track for Peterborough and the north-shore line to Trois-Rivières. The off-corridor cities, not the spine, are what hold it down.

    ③ Dropping the two off-corridor cities is the lever

    Removing Peterborough and Trois-Rivières — and reaching Ottawa and Quebec City on upgraded existing track — cuts new build to just the 540 km HPPR spine, about 40 per cent less than ALTO, while losing fewer than 0.3 million people. Most of the saving is the Quebec leg: with Trois-Rivières gone, Montreal–Quebec reverts from ~260 km of new north-shore track to the existing south-shore line, upgraded. Demand density on new build climbs from ~14,600 to ~24,100 per kilometre — from worst on the benchmark to mid-pack, above Spain. The route gets stronger by building less, because the dropped legs were costing more length than they were adding demand.

    The Kingston Test

    Same city, opposite effect

    Kingston is the cleanest illustration, because every option serves it. On the direct line it sits on the shortest Toronto–Montreal path, so it adds riders at almost no added distance — density goes up. On ALTO, reaching the same city means a southern dogleg off the northern route — the same population bought with extra kilometres, so density goes down. One stop, two outcomes, set entirely by the alignment rather than the city. Keeping Kingston while dropping Peterborough is precisely the discrimination the federal criteria imply: reward the intermediate that sits on the path, decline the one that pulls the line off it.

    In plain language

    The problem was never which cities to serve. It is the line drawn to reach them. Run the strong Toronto–Montreal market on the direct lakeshore route, branch to Ottawa, serve Quebec City on the line that already exists, and keep Kingston where it naturally sits — and the corridor moves from worst on the government’s own benchmark to the middle of the pack, on far less new track.

    The two stations that drag it down, Peterborough and Trois-Rivières, are the two that sit on no existing line and would each need new track built to reach them. Serving them may be a worthy regional goal — but it should be argued and costed as that, openly, not folded into a national corridor whose headline case rests on Toronto–Montreal.

    Method

    How this was scored

    “People served” is the combined metropolitan population of the named cities — a scale proxy, not modelled ridership, and the same crude basis slide 2.6 uses. Demand density is people per kilometre of new-build track. The alternative configurations are High Performance Rail (HPR): a new-build HPPR spine on the direct Toronto–Montreal lakeshore, plus upgraded existing lines for the Ottawa connection (VIA’s Smiths Falls–Brockville route) and, in ③, the Montreal–Quebec leg. ALTO and both alternatives are high-performance (≤200 km/h), not the 300 km/h HSR of the slide 2.6 benchmark systems, so the density comparison is conservative. Distances are approximate planning-level estimates and should be checked against ALTO’s published alignment before any figure is cited. Populations are 2021 StatCan census-metropolitan-area figures; slide 2.6 is on a 2016 basis. Trois-Rivières has had no passenger rail since 1990 and is not on VIA’s south-shore Montréal–Québec line, so serving it requires all-new track. Full workings, with live formulas, are in the reference-class workbook.
  • Sixth in NA

    Sixth in North America

    What the ranking actually measures — and the route it does not describe.

    ⚠ Source: Disclosed under the Access to Information Act

    The slide below is page 206 of a 294-page record released by the Canada Infrastructure Bank under access request A-2022-005 — a request for all studies, analyses, and reports related to the federal government’s high-frequency and high-speed rail file, disclosed in part. The briefing deck it belongs to is stamped “Privileged and Confidential — Do Not Share and/or Copy,” and its own footer marks it “DRAFT.” Adjacent pages were withheld under the Act’s economic-interest and advice exemptions (s. 18 and s. 21). The deck, as disclosed, is posted in full here: Ministerial Briefing — HFR and HSR (PDF).

    The marking is part of the point: this is a draft analysis the department preferred not be seen, and it is the evidence being used to vouch for the corridor.

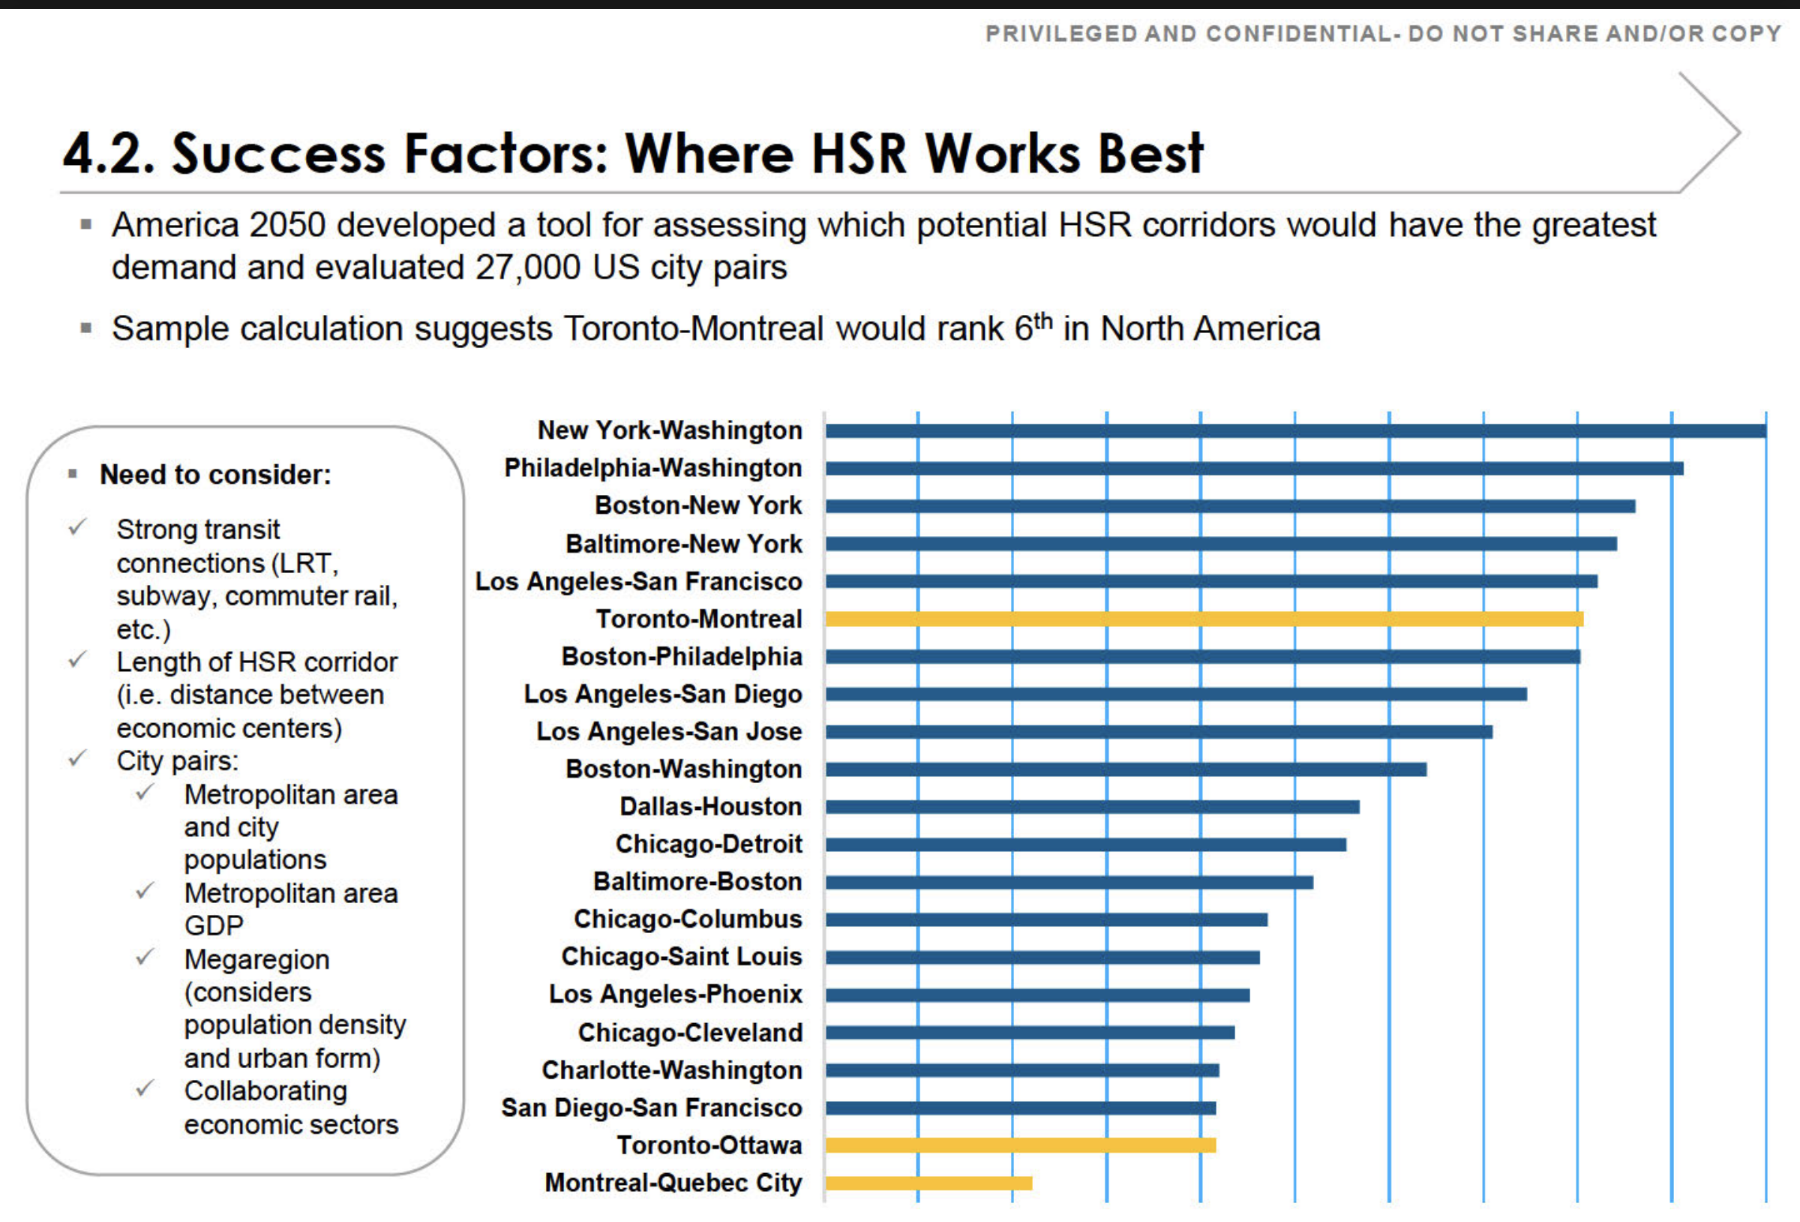
    Briefing slide: Success Factors, Where HSR Works Best, ranking North American city pairs by high-speed rail demand
    Section 4.2, “Success Factors: Where HSR Works Best.” Page 206 of the Canada Infrastructure Bank release, A-2022-005 (disclosed in part; marked DRAFT). The three highlighted bars are Toronto–Montreal, Toronto–Ottawa, and Montreal–Quebec City.
    The finding in brief

    The slide ranks Toronto–Montreal sixth among North American city pairs for high-speed rail demand. The ranking is real. What it measures is the market between two endpoint metros — not the route now being built.

    The number describes the direct Toronto–Montreal corridor. The alignment taking shape runs Toronto–Peterborough–Kingston–Ottawa–Montreal — a longer, meandering route. On the very methodology the slide cites, every one of those detours lowers the score rather than raising it. And the segment actually proceeding first, Ottawa–Montreal, does not appear on the chart at all.

    The Methodology

    What the ranking measures

    The “sixth in North America” figure comes from America 2050’s screen of tens of thousands of city pairs, a methodology published in full by the Regional Plan Association. It scores the market between two endpoint metros: downtown employment, population density, transit reach, and the existing air and road travel between them. On those inputs Toronto–Montreal scores well. The endpoints are large, dense, and already heavily travelled.

    Two features of that method decide everything that follows, and both are explicit in the source.

    It is calculated per mile. Adding distance without adding a major generator pulls a corridor’s score down, not up. The screen normalizes precisely so that longer routes cannot coast on length.

    Intermediate stations only help when they are themselves large. The report is clear that longer corridors out-rank shorter ones only when the cities in between are medium or large generators. Otherwise the additional miles are a penalty. The top-ranked corridor on the chart, New York–Washington, scores as it does because the dense intermediate cities of Philadelphia and Baltimore sit directly on the shortest path between the endpoints.

    The Route

    The corridor on the chart is not the corridor being built

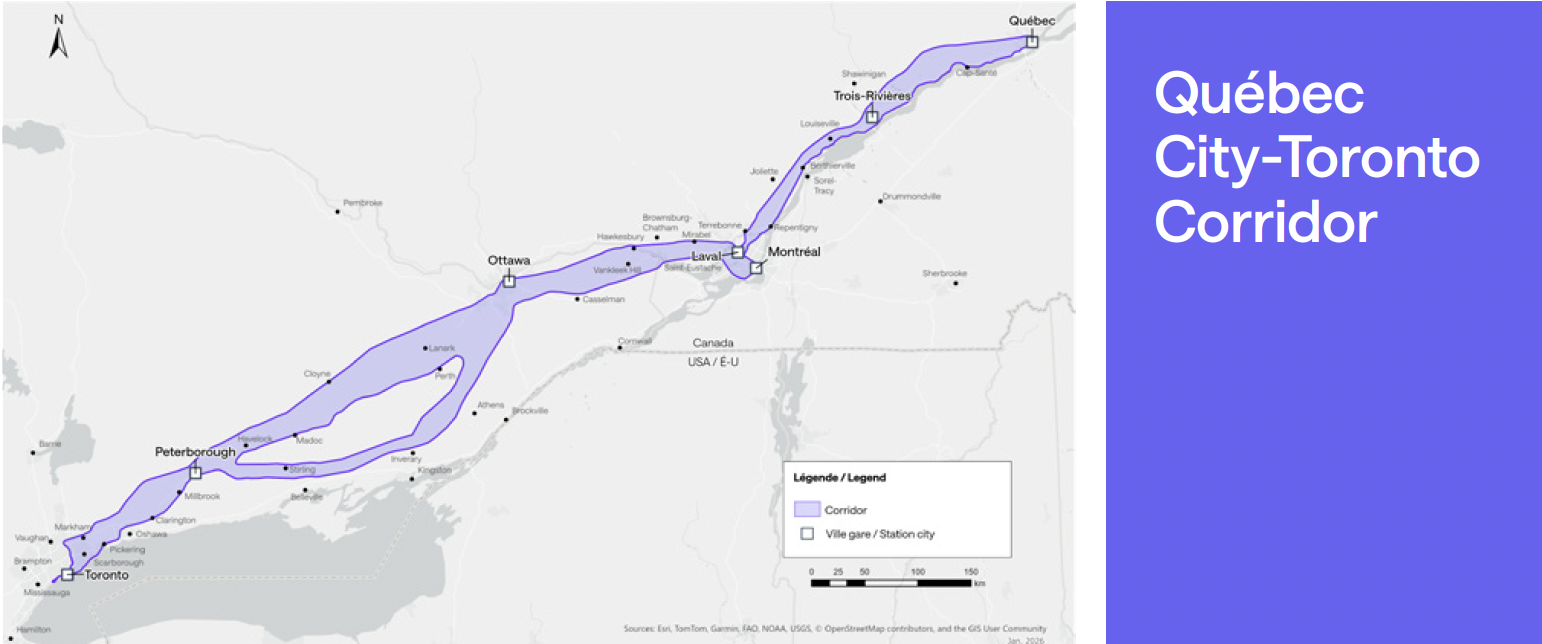
    The favourable score belongs to the direct Toronto–Montreal market — the existing lakeshore line, the shortest path, with a dense string of intermediate communities along it. The alignment now taking shape is the opposite of that. From Toronto it runs north to Peterborough; then — assuming the Kingston stop and southern routing the federal government added to its consideration in June 2026 come to pass — it doubles back south to Kingston, climbs north again to Ottawa, and drops south once more to Montreal. The result is a corridor that zigzags between its cities rather than running directly between its endpoints.

    Map of the projected Toronto to Quebec City corridor showing the route meandering north and south between cities rather than following a direct line
    The projected Toronto–Quebec City corridor. Rather than following the direct lakeshore line, the alignment meanders — north to Peterborough, south to Kingston, north to Ottawa, south to Montreal, and on toward Quebec City.
    The direct corridor (what the bar scores)The alignment being built
    Toronto–Montreal, direct. The existing Lake Ontario lakeshore line, on the order of 540 km — the shortest path between the two endpoints. Toronto–Peterborough–Kingston–Ottawa–Montreal. Roughly 610 km via Ottawa — about 13 per cent longer for the identical endpoints, and longer still with a Kingston dogleg. (This path assumes the Kingston stop and southern routing added to federal consideration in June 2026 proceed.)
    Dense intermediate string. Oshawa, Cobourg, Belleville, Kingston — population and employment added steadily along the path. Sparse flanks, weak axis. Peterborough is small and the stretches on either side of it are thinly populated; reaching Ottawa means importing the Toronto–Ottawa axis the same chart ranks near the bottom.
    Highest possible per-mile score for these two endpoints. A lower per-mile score: more kilometres, less density per kilometre, and a low-scoring leg folded in.

    There is a particular irony in Kingston. It is the natural intermediate city on the direct corridor — precisely the stop that would have helped the Toronto–Montreal score. The chosen alignment runs north to bypass it. Now it is being considered for re-inclusion, bolted back onto a route designed to avoid it.

    On the Method’s Own Terms

    What each detour does to the score

    Re-run the published methodology on the alignment actually on the table, and the per-mile score falls below the sixth-place bar. Each of the route’s defining choices works against it:

    Length is a straight penalty

    Per-mile normalization spreads the same Toronto and Montreal endpoint demand over more kilometres. A longer, more circuitous route scores lower for the identical endpoints — that is what the normalization is designed to do.

    Peterborough adds miles faster than density

    Intermediate stops only lift the score if they add population and employment per kilometre faster than the corridor’s average. Peterborough is too small, and the stretches on either side are sparse, so it adds length faster than it adds riders — a net penalty.

    A Kingston dogleg is more of the same

    Re-adding the one city the alignment was routed to avoid means a southern detour off the northern line: a modest generator bought with extra kilometres — again, length outpacing density.

    Reaching Ottawa imports a weak leg

    Ottawa is the one genuine generator among the added stops. But reaching it is the Toronto–Ottawa axis the same chart already ranks near the bottom of its field. The detour swaps the strong direct Toronto–Montreal axis for a leg the deck itself scores as weak.

    Sequencing

    What is actually being built first

    There is a further mismatch between the headline number and the build. The first segment to proceed is not Toronto–Montreal at all — it is Ottawa–Montreal, confirmed in December 2025 as the opening phase, with construction targeted for 2029. Ottawa–Montreal does not appear anywhere on the chart.

    And by the government’s own account, it was chosen first not for demand but for buildability: a relatively short and straight portion of the overall route, since high-speed trains do not handle curves well — the same logic that led California to build its first section across the flat Central Valley, avoiding tunnelling and urban construction. A constructability rationale, not a ridership one.

    The corridor that scores sixth, Toronto–Montreal, is only realized once the full line is complete — including the Toronto–Ottawa leg that sits near the bottom of this very chart — work not expected to finish until the 2040s. So the headline ranking and the actual build diverge twice over: the number describes a market the first segment does not deliver, assembled from legs the chart scores unevenly, with the strongest part of the case deferred to last.

    In plain language

    Strip away the methodology and the point is simple. The federal government’s own briefing says high-speed rail makes the most sense between Toronto and Montreal — two large cities with heavy travel between them. It says nothing in favour of the winding route now being built.

    That route keeps collecting stops the demand evidence does not support: north to Peterborough, a proposed southern dogleg to Kingston, and Trois-Rivières on the Quebec leg. Each one adds distance and cost while the case for the line still rests on the direct Toronto–Montreal market. When stations are added that do not earn their place on the numbers, the usual explanation is political — spreading the visible benefits of a marquee project across as many communities as possible to assemble support for it.

    This is one of the central problems with the project, and it is a familiar one. Bent Flyvbjerg’s research on megaprojects — the body of work behind this Initiative’s reference-class approach — finds that large infrastructure projects routinely run over budget and under-deliver because their scope and routing are shaped by political bargaining and the need to sell the project, rather than by the demand evidence. A corridor designed around who gets a station rather than where the riders are is precisely the pattern that research warns about.

    In Summary

    What the slide does and does not say

    The “sixth in North America” finding endorses a Toronto–Montreal market. It says nothing in favour of the Peterborough-routed, Kingston-doglegged, Ottawa-and-Montreal-served alignment. On the methodology’s own terms, those inclusions are exactly the choices it would mark down.

    A strong endpoint market is a real asset. It is not the same thing as a strong route — and a briefing that uses the first to vouch for the second is measuring the wrong thing. That the slide is marked “DRAFT,” and that adjacent pages were withheld under the Act’s economic-interest and advice exemptions, only sharpens the question: this is the analysis on the record, and on its own terms it does not say what it is being used to say.

    A note on method. The deck describes its result as a “sample calculation.” The disclosed page does not show how the path was drawn or scored. The standard America 2050 methodology and the headline result both point to the direct corridor as the basis for the sixth-place figure; if the underlying calculation is obtained, the path it used is the detail to confirm.

    Anticipated Objection

    “Doesn’t the line serve all those city pairs — Toronto–Ottawa, Ottawa–Montreal, Montreal–Quebec — not just Toronto–Montreal? Combine them and the project makes sense.”

    It is true that a corridor serves a whole matrix of city pairs, not only its endpoints. But that observation concedes the point rather than answering it. The “sixth in North America” figure is the score for the direct Toronto–Montreal pair. The moment the case leans on Toronto–Ottawa, Ottawa–Quebec, and Toronto–Quebec, it is no longer resting on that figure — and those are precisely the legs the same chart rates weakest: Toronto–Ottawa sits second from the bottom, Montreal–Quebec City is last, and Ottawa–Quebec, Toronto–Quebec, and Ottawa–Montreal do not appear on it at all.

    Two things make “combine the figures” fail on the slide’s own terms. The bars are demand-strength rankings — built from population, GDP, density, and corridor length — not passenger counts that can be summed; a sixth-place pair plus a near-last pair does not add up to a stronger corridor. And because the screen normalizes per mile, stringing the one strong pair onto a longer, detouring alignment spreads the same demand across more track-kilometres, which lowers the score rather than raising it.

    The logic in fact argues for the line this brief describes. If the goal is to capture Toronto–Montreal and the markets in between, the alignment that does it best is the direct lakeshore corridor — it serves the sixth-place pair at full strength and threads a dense string of real intermediate cities (Oshawa, Cobourg, Belleville, Kingston) on the way. Adding up the pairs does not rescue the meandering route; it makes the case for the direct one.

    Sources

    Primary documents and statements

    1.
    Canada Infrastructure Bank, completed access-to-information release A-2022-005 (disclosed in part), “Success Factors: Where HSR Works Best,” draft briefing slide, page 206. Released under the Access to Information Act; deck marked “Privileged and Confidential — Do Not Share and/or Copy” and “DRAFT.” View the disclosed deck (PDF)
    2.
    America 2050 / Regional Plan Association, High-Speed Rail in America, January 2011 — the published methodology scoring rail corridors by ridership demand on a per-mile basis.
    3.
    America 2050, Where High-Speed Rail Works Best — the precursor study of city pairs that the briefing slide reproduces.
    4.
    Transport Canada / Alto, “Full speed ahead: Ottawa–Montreal chosen as starting point for Alto High-Speed Rail,” December 12, 2025. canada.ca · altotrain.ca
    5.
    “First segment of Canadian high-speed rail to be built between Montreal, Ottawa,” Trains, December 12, 2025 — carries the Minister of Transport’s rationale for selecting the segment as a short, straight portion of the route. trains.com
    6.
    “Ottawa-Montreal chosen as 1st segment of promised high-speed rail line,” CBC News, December 12, 2025 — remaining segments (Quebec City–Montreal and Ottawa–Toronto) to begin at a later, unspecified date. CBC News
    7.
    Federal government statement, June 22, 2026, indicating an additional stop at Kingston would be considered for the corridor.
    8.
    Bent Flyvbjerg, Nils Bruzelius & Werner Rothengatter, Megaprojects and Risk: An Anatomy of Ambition (Cambridge University Press, 2003); Flyvbjerg, “Survival of the Unfittest: Why the Worst Infrastructure Gets Built — and What We Can Do About It,” Oxford Review of Economic Policy 25, no. 3 (2009): 344–367; and Flyvbjerg, “Design by Deception: The Politics of Megaproject Approval,” Harvard Design Magazine no. 22 (2005) — on strategic misrepresentation, perverse incentives, and the political shaping of megaproject scope and routing.
  • By their own standard

    Research Brief · Methodology

    By Their Own Standard

    Build Canada’s case for high-speed rail, measured against the megaproject method the memo itself invokes.

    ⚠ The Document Under Review

    Build Canada’s February 24, 2025 memo, Let’s Show the World How Canada Builds, was published one week after the federal high-speed rail announcement. It endorses high-speed rail in the Toronto–Quebec City corridor and names ALTO directly, while contesting only how the project is delivered — not whether the demand exists or whether the benefit–cost case closes. This brief takes the memo’s argument on its own terms, and holds it to the analytical standard the memo itself sets. Build Canada · original memo

    Critical Finding

    The memo reaches for exactly the right tools. It quotes Bent Flyvbjerg, the leading scholar of megaproject cost overruns; it calls for reference-class benchmarking against comparable lines; it demands contingency discipline; and it warns that without these, ALTO becomes another HS2 or California High-Speed Rail. On the diagnosis, the Initiative agrees.

    The memo then abandons each principle at the moment it matters. It caps contingency at the level that, on its own logic, guarantees overrun. It imports foreign unit costs from a reference class that is not comparable. And it promises true high-speed rail at a unit cost that, in Canadian conditions, only high-performance rail can plausibly reach. Applied honestly, the memo’s own method points away from its conclusion.

    The evidence produced since the announcement confirms the diagnosis the memo made and refutes the targets it set. The corridor is still being fundamentally re-routed in the project’s second year; the friction the memo proposed to legislate away has surfaced exactly where the method predicts. The case for caution on ALTO does not require rejecting Build Canada’s framework. It requires applying it.

    The Argument’s Shape

    What the memo contests, and what it does not

    The memo’s argument has a particular structure. It accepts ALTO’s entire benefit case without examination — 40 per cent of the economy, 18 million people connected, up to $35 billion a year in added GDP, travel times halved — and contests only whether the project can be built cheaply and quickly. Every one of those headline figures is the proponent’s own number, repeated approvingly. The memo never asks whether the ridership exists to fill the trains, or whether the benefits exceed the costs.

    It asks one question: can Canada build it the way France, Spain, and Japan did? To answer, it reaches for the right instruments — Flyvbjerg’s work on megaproject overruns, reference-class benchmarking, contingency discipline, and the cautionary record of HS2 and California. That choice of tools is what makes the memo worth engaging seriously, and what makes its conclusion fail. The same tools, applied with honest inputs, do not support the case the memo builds on them.

    Held To Its Own Standard

    Three flaws, by the memo’s own method

    On three load-bearing claims, the memo prescribes the opposite of what the method it cites requires. The left column states the memo’s own prescription; the right column applies the memo’s own standard to it.

    What the memo prescribesHeld to its own standard
    1. Cap contingency, including inflation, at 10 per cent. Presented as following global best practice, alongside meticulous benchmarking against French and Japanese lines.Reference-class forecasting — the very method the memo invokes — requires a larger uplift the less design is complete, because the unknowns are still unpriced. The memo itself concedes Canadian projects sit at 1–10 per cent design maturity. At that maturity, the honest uplift is routinely 40 per cent or more; a 10 per cent cap is defensible only near design completion. The prescription specifies the precise conditions under which budgets break, and calls it discipline.
    Verdict:Self-contradictory
    2. $25–40M per km; a corridor for under $50B; payback within two years. Drawn from the cost record of France, Spain, and Japan.A reference class works only if the cases are comparable, and these are not. The cited figures come from older lines, on flatter and cheaper terrain, in earlier cost eras, with no adjustment for what this corridor crosses: the granite of the Canadian Shield, the Frontenac Arch, the wetland and karst of eastern Ontario, and dense urban approaches at both ends. Importing an unadjusted foreign unit cost is exactly the non-analogous-reference-class error Flyvbjerg’s method exists to catch — committed in the section that cites him. The Initiative’s complexity-adjusted estimate runs several times higher, with a central benefit–cost ratio far below the break-even the memo treats as obvious.
    Verdict:Wrong reference class
    3. True high-speed rail at that same unit cost. Dedicated track, full electrification, grade separation, 300 km/h — delivered for $25–40M per km.In Canadian conditions, $25–40M per km is not a high-speed-rail figure at all. It is roughly the cost of a high-performance rail upgrade — incremental improvement of existing alignments, the option the memo dismisses in a single line. The memo promises high-speed performance at high-performance-rail prices. The headline product and the headline number belong to two different projects; you cannot buy the performance of one at the price of the other.
    Verdict:HSR promise, HPR price
    $25–40M
    per km — the memo’s claimed unit cost, from France / Spain / Japan
    Build Canada memo
    ≈ $143B
    reference-class capital for the corridor delivered as high-speed rail
    CRI reference-class analysis
    ≈ 0.06
    central benefit–cost ratio — against the memo’s implied two-year payback
    CRI NPV / BCR matrix

    “Payback in two years” implies a project that returns many times its capital. The reference-class evidence points to one that returns a small fraction of it. The gap between the memo’s number and the comparable record is not a rounding difference; it is the entire argument.

    What Has Happened Since

    The diagnosis confirmed, the targets refuted

    More than a year on, events have tested the memo’s promises against reality. They vindicate its diagnosis of Canadian megaproject failure and dismantle the targets it set against that diagnosis.

    A corridor still being re-routed in year two

    The memo set a target of a high-value section carrying passengers within five years, on standardized, locked-in designs, at 10 per cent contingency. Yet the corridor is still being fundamentally re-aligned — a southern-corridor study, a conditional new station at Kingston, an alignment still unchosen between north and south. That is direct evidence of the planning immaturity the memo flagged on its first page — and it makes the memo’s own targets incoherent. You cannot run trains in five years on frozen designs while you are still deciding where the line goes.

    Friction exactly where the method predicts

    The memo’s prescriptions — sever environmental review from planning, legislate automatic approvals, reduce municipalities to suggesting where infrastructure is placed rather than whether — were aimed at the precise constraints this corridor turns out to be full of: two UNESCO designations, species at risk, organized community opposition, and rural-character concerns that public consultation surfaced in volume. The Initiative’s Community Friction Index has risen from 43 to 54 since consultation began and is projected to climb further. The memo’s answer to friction is not to resolve it but to override it — and on this corridor, that is neither lawful nor likely.

    The memo’s own number makes the HPR case

    The memo dismisses improving existing rail as insufficient, insisting dedicated high-speed track is the only way. But its own affordability figure, $25–40M per km, is a high-performance-rail number — and the consultation recorded clear public appetite for improving VIA service first and preserving existing Kingston and eastern-Ontario connections. Strip the rhetoric and the memo makes the affordability case for the alternative it rejects.

    Conclusion

    The antidote that recreates the disease

    The memo casts ALTO as Canada’s escape from the HS2 and California failures. Trace its logic, though, and the resemblance runs the other way. “We will build it cheaply and quickly like France and Japan — just cap the contingency and clear the obstacles” is not the cure for optimism bias. It is the textbook expression of it, almost word for word how California began.

    The memo’s real service is that it concedes the entire framework. Flyvbjerg, reference classes, contingency discipline, planning maturity: take those tools, feed them honest inputs, and the conclusion does not survive. The case for caution on ALTO does not require rejecting Build Canada’s method — it requires applying it. Done honestly, it points not toward a sprint to high-speed rail at imported prices, but toward a high-performance upgrade of the corridor Canadians actually use, at a cost the country can defend.

    Where The Method Lands

    Summary ledger

    The memo measured against the standard it sets for itself:

    Sound
    Diagnosis — planning-maturity gap. Correctly identifies that Canadian projects enter procurement at 1–10% design versus 30–70% abroad.
    Sound
    Delivery authority. Rightly prefers a strong, technically competent public authority over dependence on a consultant consortium.
    Sound
    Reference-class benchmarking. Rightly names it as the antidote to optimism bias.
    Violated
    10% contingency cap prescribed at 1–10% design maturity — manufactures the overrun the memo warns against.
    Violated
    $25–40M/km imported from non-comparable lines without adjustment for terrain, era, or urban approaches.
    Violated
    HSR promised at HPR price. The headline product and the headline cost belong to two different projects.
    Violated
    Override of environmental review and municipal consent — aimed squarely at the corridor’s real, documented constraints.
    Refuted by events
    Five-year passenger target on frozen designs — incompatible with a corridor still being re-routed in the project’s second year.

    The memo is at its strongest where it agrees with the Initiative — on method. It is at its weakest where it abandons that method to reach a predetermined answer. Applied honestly, Build Canada’s own framework makes the case for high-performance-rail realism, not for a high-speed sprint at imported prices.

    Sources

    Primary documents and references

    1.
    Build Canada, “Let’s Show the World How Canada Builds” (memo), February 24, 2025 — the document under review. buildcanada.com/memos/how-canada-builds
    2.
    Alto, Public Consultation Report, June 22, 2026 — corridor framing, southern-corridor and Kingston-station feedback, community and environmental concerns.
    3.
    Bent Flyvbjerg, “What You Should Know About Megaprojects and Why: An Overview,” Project Management Journal (2014) — the megaproject-overrun research the memo cites.
    4.
    ALTO HSR Citizen Research Initiative — reference-class forecasting, Engineering Complexity Index regression, and de-biased cost analysis for the Toronto–Quebec City corridor.
    5.
    ALTO HSR Citizen Research Initiative — NPV / benefit–cost matrix and Community Friction Index (post-consultation update).
  • High cost, low benefit claim

    High Cost, Low Benefit — For Whom?

    An ALTO Vice-President says the rail alternative would cost about as much as high-speed rail without the benefits. The government’s own record — and ALTO’s own document — say otherwise.

    In short

    In a recent public video, an ALTO Vice-President argues that high-frequency rail would still need dedicated track, would therefore cost about as much as high-speed rail, and would deliver less — a “high cost, low benefit” option. The claim runs against the public record. The government’s own reports costed a dedicated-track high-frequency railway far below high-speed rail, and judged it buildable in a fraction of the time. What shifted that cost to “similar” has never been made public.

    On the benefit side, ALTO’s case rests on ridership the international reference class does not support. Tested against ALTO’s own document and the Initiative’s financial analysis, the high-cost option turns out to be the one being built.

    Download
    High Cost, Low Benefit — For Whom?
    The full research brief, with sources (PDF)
    Download PDF
    The Argument

    What the video claims

    The argument is a single chain. High-frequency rail, the video says, is often presented as the cheaper alternative — but it would still require new dedicated track, so its cost would rise to roughly that of high-speed rail, while delivering lower travel-time, ridership, and economic benefits. The conclusion offered to viewers is that high-frequency rail is a “high cost, low benefit” option, while high-speed rail delivers both speed and frequency.

    It is a clean story. Two problems sit beneath it before any single figure is examined.

    It claims a cost convergence the record contradicts

    The video is right that high-frequency rail needs dedicated track — it does not claim trains would share track with freight. Its claim is that building that dedicated track pushes the cost up to roughly high-speed rail’s. The government’s own reports say otherwise, on both cost and time. A dedicated-track, electrified high-frequency railway was costed at $27.7 billion in the December 2021 Business Case — and roughly $4–6 billion in its original 2016 form — and judged buildable in about four years. High-speed rail is now costed at $60–90 billion, on a build horizon stretching into the 2040s. What evidence moved high-frequency rail’s cost and schedule up to “similar” has never been explained, and no side-by-side comparison has been made public.

    It never engages the alternative the Initiative proposes

    The video treats high-frequency rail as the only alternative to high-speed rail. The Initiative’s proposal is different again: High Performance Rail (HPR) builds dedicated passenger track along existing transportation corridors — such as the CN right-of-way and the Highway 401 — and frees the Kingston Subdivision for freight. It is neither the government’s old high-frequency plan nor ALTO’s high-speed one, and ALTO has never assessed it.

    Tested Against the Record

    Three claims, three answers

    $27.7B
    what a dedicated-track high-frequency railway was costed at — against $60–90B for high-speed rail
    2021 JPO Business Case
    5×
    the cost-per-kilometre gap between ALTO and High Performance Rail in the Initiative’s model
    $142M vs $28M per km
    0.11
    ALTO’s central benefit-cost ratio — well below the 1.0 that marks a project that pays its way
    Initiative methodology paper

    The video makes three factual claims — on cost, on speed, and on benefit. Each can be checked against ALTO’s own published document and the Initiative’s analysis.

    The claim in the videoWhat the record shows
    “It would cost on a similar scale to high-speed rail.” Contradicted by the public record. The government’s own 2021 Business Case put a dedicated-track high-frequency railway at $27.7 billion, against ALTO’s $60–90 billion. Even ALTO’s own Annex B places its “conventional rail” comparator 20–30% below high-speed rail. The Initiative’s reference-class model — a regression across more than forty international projects — puts ALTO at $142M/km and HPR at $28M/km, a five-fold gap. “Similar scale” holds on none of these.
    “Without significantly faster travel times.” Conventional speed already captures most of the benefit. A 177 km/h dedicated-track service was set to cut Toronto–Ottawa from over four hours to about two hours fifty. By ALTO’s own travel-time table, going to 300 km/h saves only a further 17 minutes on Toronto–Ottawa, 19 on Ottawa–Montréal, and 25 on Montréal–Québec. Most of the time saving comes from leaving freight-priority track — not from the extra speed.
    “Lower ridership and reduced economic benefits.” The benefit case rests on ridership the reference class does not support. ALTO’s 24-million-trip target sits outside the achievable modal-shift frontier of 5–12 million annual riders. No operating posture is subsidy-free; each requires roughly $1–3.5 billion per year. The central benefit-cost ratio is about 0.11. The “high benefit” half of the slogan is the half that does not survive checking.
    A Note on the Travel Times

    Estimated, not simulated

    There is a further problem with the speed claim, separate from how small the gain is. The faster journey times were never modelled for this corridor at all. A government record released under the Access to Information Act (file A-2025-00333) shows that the project office produced a detailed RailSys simulation only for the 177 km/h base case. Every faster journey time was a spreadsheet estimate, benchmarked to average speeds on intercity railways in other countries — described in the project’s own memorandum as “for information and comparison purposes” and left to be refined later.

    In other words, the under-three-hour trips that make high-speed rail attractive have no corridor-specific engineering behind them in the released record. The one number anyone actually drove through a model of the real line is the slow one.

    Read the full record

    The Initiative examines this in detail — the two methods, the journey-time tables, and how the speed ceiling was set as a policy target — in a companion research note, Estimated, Not Simulated, based on the same Access to Information release.

    The Carbon Case

    A carbon debt, not a carbon saving

    The video folds environmental benefit into ALTO’s column, on the assumption that faster, higher-ridership rail is the greener choice. The Initiative’s 50-year lifecycle analysis finds the opposite once construction and a decarbonising vehicle fleet are counted. ALTO’s build is a large one-time carbon debt before a single passenger boards — about 14.7 Mt CO₂e in the central construction estimate — and with fifty years of operations the lifecycle total lands at roughly 24 to 27 Mt CO₂e on Ontario’s current grid, and as much as 34 Mt if the grid leans more on gas.

    That debt only counts as a saving if the trips it captures would otherwise have been higher-carbon — and the payback math is unforgiving. At the ridership the corridor is most likely to see in its early years, around 4 million passengers a year, no scenario repays the construction debt within a credible horizon. Even at mature ridership, payback runs from a few decades to more than five hundred years, depending on how clean the grid is.

    The comparison only worsens with time. By the 2040s, when ALTO might open, much of the car fleet will be electric — and an electric car carrying 1.2 people already emits about 10 g CO₂e per passenger-kilometre, below ALTO’s all-in emissions at every ridership level on today’s grid. Diverting existing VIA Rail passengers, at roughly 25 g/pkm, saves nothing at all. ALTO’s carbon case rests on displacing gasoline cars and short-haul flights — not the fleet that will actually be on the road when it opens.

    Most of that debt is greenfield construction. An approach that runs on existing corridors — as High Performance Rail does — avoids the bulk of it, and the single largest carbon lever, shifting freight off congested track, is available whatever the trains’ speed or traction.

    Why the Gap Is Real

    The cost difference is structural, not arithmetic

    The five-fold difference in the Initiative’s model is not an accounting artefact. A 300 km/h design forces a new dedicated greenfield alignment — grade separation, gentle curves, continuous fencing, and large-scale land acquisition — through terrain that scores high on both engineering complexity and community friction. Both the government’s high-frequency plan and the Initiative’s HPR instead run on or alongside existing corridors, which is why each comes in well below the high-speed option. In the Initiative’s model, the gap between high-speed rail and HPR splits roughly evenly between physical engineering and community friction — the cost of the land, the disruption, and the opposition that a new high-speed right-of-way creates.

    The Bottom Line

    High cost, low benefit — for whom?

    The video’s thesis — that high-frequency rail is high cost and low benefit while high-speed rail delivers both — is contradicted by the government’s own record. High-frequency rail was a fully studied, dedicated-track plan, priced at $27.7 billion in 2021 and a fraction of that in its original form, and due to be carrying passengers now. The decision to replace it with a 300 km/h, $60–90-billion project was taken without a published comparison; the video supplies the missing conclusion after the fact.

    On the evidence available, the high-cost option is the one that was chosen. The lower-cost alternatives — the government’s own, and the Initiative’s — were set aside without being weighed in public. That is the question the slogan invites, turned back on itself: high cost, low benefit, for whom?

    Sources

    Primary documents

    1.
    ALTO, Fast Forward: Shaping Canada’s Future with a High-Speed Rail Network (March 2025) — cost ranges, travel times, and ridership targets, main text and Annex B. altotrain.ca
    2.
    Joint Project Office High Frequency Rail Project, Business Case Update, V.002 (December 10, 2021) — dedicated-track design, $27.7 billion costing, and four-year construction estimate.
    3.
    The Globe and Mail, “Transport Canada reviewing studies on Via Rail expansion” (July 2017) — the original 2016 high-frequency concept at roughly $4–6 billion. theglobeandmail.com
    4.
    “VIA HFR-TGF Journey Times” memorandum and accompanying email chain (August–September 2023), released under the Access to Information Act as file A-2025-00333 — simulated base case versus estimated higher-speed times.
    5.
    ALTO HSR Citizen Research Initiative, ALTO Financial Analysis (methodology paper and supporting research notes) — cost-per-kilometre model, ridership frontier, subsidy spectrum, benefit-cost ratio, and lifecycle carbon. ALTO-Financial-Analysis.pdf
    6.
    ALTO HSR Citizen Research Initiative, 50-Year Lifecycle CO₂ Budget — Parametric Analysis (March 2026) — construction, operational, payback, and modal-comparison figures, drawing on HS2, UIC, and international HSR lifecycle studies.
    7.
    Statements examined: public video by an ALTO Vice-President (June 2026).
  • The bill that has to balance

    The Bill That Has to Balance

    A plain-language guide to how we evaluated the cost of the proposed ALTO high-speed rail line — starting from one simple rule that every railway in the world has to obey, and following it through to a number the government’s own claims do not match.

    ⚠ What this is

    This is the readable version of a longer technical paper. The full document and slide deck show every calculation; this post explains, in everyday terms, what we did, why, and what we found — with no maths background assumed.

    The short version: the project’s likely capital cost is roughly double what the government has stated; the trains cannot pay for themselves at any realistic ticket price; and the project’s headline ridership target of 24 million passengers a year sits outside the range that any comparable line has ever achieved.

    The one idea to take away

    Every operating railway in the world has a bill that has to balance every year. What it costs to build and run the line on one side; where the money to cover that comes from on the other. The money can only come from three places: ticket sales, a government subsidy, or value captured from land near the stations.

    You can argue about any single number. What you cannot do is leave one side of the bill short. If a proponent quotes you a low cost and a high number of riders but never tells you the subsidy, the subsidy is simply the part of the bill they haven’t shown you — it doesn’t disappear. Our whole method is just: fill in every blank on the bill using independent evidence, and see what the missing number turns out to be.

    Read in full
    A Framework for Independent Evaluation of the ALTO HSR Project
    The complete methodology, every rubric and dataset, and a slide deck version — all published and reproducible
    All documents Full PDF Slide deck
    Start Here

    The bill every railway has to balance

    Imagine your household budget. Whatever you spend has to be matched by money coming in — from your salary, your savings, a loan. A railway is no different, just bigger. There are two kinds of cost: the enormous one-time cost of building the line (paid off gradually, like a mortgage), and the ongoing cost of running it every year — staff, electricity, maintenance, replacing worn-out trains.

    Those costs have to be paid for. There are only three sources. Here is the whole thing on one line:

    The annual fiscal ledger

    Cost to build (yearly share) + cost to run = ticket sales + government subsidy + land value capture

    The left side is what the railway costs each year. The right side is where that money comes from. The two sides must be equal — that’s what “balance” means.

    In plain terms

    “Land value capture” means a railway can sometimes raise money from the rise in nearby land prices that a new station creates — for example by developing land around the station. It’s a real tool, but a modest one in Canada, and ALTO has named no such mechanism. So for ALTO that third source is effectively zero, which leaves only two: tickets and subsidy.

    Here is the consequence that does all the work. Once you’ve pinned down the cost, the ticket revenue, and the land capture using evidence, the subsidy isn’t a choice anyone gets to make — it’s whatever is left over to make the bill balance. It’s a leftover, not a decision. That single insight is why a project can claim to be “self-sustaining” and still, on its own numbers, need billions of dollars of public money a year. The subsidy was always there; it just wasn’t written down.

    The Method

    Seven steps to fill in the blanks

    To fill in each part of that bill honestly, we built a seven-step process. Each step answers one question using published evidence rather than the project’s own marketing, and each step shows its work so that anyone who disagrees can re-run it with their own assumptions. Here is what each step asked, and what it found for ALTO.

    1

    How hard is this to build?

    Engineering complexity, compared to rail lines around the world

    We scored the corridor’s technical difficulty against an international database of comparable projects. ALTO lands in the upper “High” band — among the most demanding corridors anywhere in the world. Hard things cost more and run late more often; this matters for every number that follows.

    2

    How smooth will getting it approved and built be?

    Community, consultation and consent risk

    We measured the friction the project faces from communities, landowners and the consultation process. The score lands in the band where comparable megaprojects’ cost overruns tend to cluster — another reason to expect the final bill to climb.

    3

    What will it really cost to build?

    Capital cost, calibrated against similar projects

    The government states $75 billion. Comparing ALTO to a reference class of similar railways and adjusting for its difficulty, our central estimate is $143 billion — nearly double — with a worst-case ceiling of $264 billion. The stated budget sits at the very bottom of the plausible range.

    4

    What will it cost to run, every year?

    Operating cost, built up from the actual assets

    Adding up staff, operations, maintenance and replacing trains as they wear out gives about $2.15 billion a year. To cover just that running cost from fares, the line would need roughly 12.5 million passengers a year — and even then it only recovers about 80 cents of every dollar.

    5

    How many people would actually ride it?

    Realistic ridership, and the subsidy that follows

    Based on how many travellers comparable lines actually pull off the roads and out of the air, a realistic range is 5 to 12 million riders a year, with a sensible target near 8 million. ALTO’s headline figure of 24 million sits outside that range entirely.

    6

    Is it worth it?

    Benefits weighed against costs

    Weighing all the benefits against all the costs gives a ratio of about 0.11 — roughly eleven cents of benefit for every dollar spent. To make the 24-million target pay, tickets would need to cost between $381 and $1,596 — and 24 million riders is unreachable anyway.

    7

    Would a serious gatekeeper approve it?

    Tested against Norway’s independent project-review system

    Norway runs big projects through two independent quality gates before funding. Run through those gates, ALTO fails most of the criteria at both stages — described as a textbook example of exactly the kind of project the Norwegian system was built to catch.

    What “reference class” means

    Rather than trust a project’s own optimistic forecast, you line it up against a large group of similar projects that have already been built, and ask: what actually happened to those? It is one of the most reliable ways known to forecast cost and ridership, precisely because it sidesteps wishful thinking.

    The Headline Figures

    Three numbers that frame the whole thing

    Cost to build
    $143B
    Our central estimate — against a stated budget of $75B
    Value for money
    11¢
    Of benefit returned per dollar spent (a benefit-cost ratio of 0.11)
    Ridership gap
    24M
    The stated target — against a realistic ceiling near 12M

    None of these is a guess plucked from the air. Each one is the output of one of the seven steps above, and each step publishes the data and the scoring behind it. The point of putting them together is simple: a project whose costs are understated, whose value-for-money is low, and whose ridership is overstated does not become viable just because its three weaknesses are described in separate documents.

    The Part Nobody Mentions

    No ticket price makes the bill disappear

    Here is where the “bill that has to balance” idea pays off. There is a temptation to think the subsidy could be designed away — charge higher fares, or fill more seats. So we tested the three obvious strategies. In every case, a large public subsidy remains. The only thing that changes is how the cost is split between the passenger and the taxpayer.

    Charge premium fares
    ~$1B / yr

    Trade-off:High ticket prices, so fewer riders. Lowest subsidy — but still about a billion a year.

    Match airline fares
    ~$2B / yr

    Trade-off:Prices in line with flying. A moderate middle path — roughly two billion a year.

    Deep discounts, fill seats
    ~$3.5B / yr

    Trade-off:Cheap tickets, more riders — but the lowest fares mean the largest subsidy.

    Notice what this means. Choosing among these isn’t a choice between “subsidised” and “unsubsidised” — every option is subsidised. It’s only a choice about who pays: the rider at the ticket window, or the taxpayer through the public purse. That is a perfectly legitimate political decision to make out in the open. What isn’t legitimate is pretending the choice doesn’t exist.

    And that is exactly why one specific government claim does not hold up. On 22 April 2026, the government stated the operation would be “financially self-sustaining” — meaning fares alone would cover running costs. But no realistic level of ridership produces enough ticket money to cover the $2.15 billion annual running cost. Measured against every comparable high-speed line operating in the world, that claim simply isn’t consistent with the evidence.

    The Bottom Line

    What the filled-in bill shows

    Put the seven steps together and the picture is consistent, not cherry-picked:

    Roughly double the cost

    The likely cost to build is about twice the stated budget — and the stated figure sits at the bottom edge of what’s plausible.

    Cannot pay its own way

    At no realistic fare do ticket sales cover even the cost of running the trains, let alone building the line.

    Eleven cents on the dollar

    The central value-for-money ratio is about 0.11 — far below the level at which a project is normally considered worthwhile.

    A ridership target out of reach

    The 24-million figure lies outside the range any comparable line has achieved, and the subsidy is required no matter what.

    Measured against Norway’s independent review standard — one of the most respected gatekeeping systems for large public projects — ALTO fails the majority of the tests at both the early-concept stage and the pre-funding stage.

    In Fairness

    This is a recommendation, not a verdict

    It matters how this is meant to be read. The seven-step process produces a recommendation, not a decision. The decision belongs to elected officials and the public — ideally informed by an independent authority such as the Parliamentary Budget Officer.

    The purpose of all this work is narrow and, we hope, fair: to put a balanced, contestable record on the table, so that the choice about which rail corridor Canada builds rests on evidence rather than on headline numbers. Every step publishes its rubric, its scoring, and its data. If you disagree with any finding, you are invited to re-run it under your own assumptions — that openness is the whole point.

    A good public investment can survive this kind of scrutiny. The questions below are the ones any major rail proposal should be able to answer plainly.

    1. On cost: If the stated budget sits at the bottom of the plausible range, what is the realistic central figure — and what happens to the case if the cost lands there?
    2. On the subsidy: Since fares cannot cover running costs at any realistic ridership, what annual public subsidy is the government planning for, and who decided how to split the cost between riders and taxpayers?
    3. On ridership: What evidence supports 24 million riders a year when comparable lines top out far below that — and what does the business case look like at a realistic 8 to 12 million?

    None of these questions presupposes opposition to passenger rail, which many people support. Each asks only that the project state plainly what its own numbers imply — so the public can weigh a real proposal rather than a hopeful one.

    Read the full framework
    A Framework for Independent Evaluation of the ALTO HSR Project
    The complete methodology, the seven-stage pipeline, and every rubric, score and dataset — published and reproducible
    All documents Download PDF
  • Cost of running the train

    The Cost of Running the Train

    What it costs to run a high-speed corridor every year — and the ridership it would take to pay for it.

    ◆ Operating-Cost Methodology

    The debate over a high-speed corridor usually fixes on the construction price tag. But a corridor that is built still has to be run — maintained, staffed, energised, and periodically re-equipped — for as long as it operates. That recurring cost is a separate question from the capital cost, and it is answered by a separate methodology.

    This brief sets out that methodology in three parts: the cost of keeping the fixed assets in service, the cost of running trains on them, and the cost of replacing the trains when they wear out. It then asks the single question those three costs raise together: how many passengers would the corridor need to carry to cover them?

    Critical Finding

    For a 1,000 km dedicated high-speed corridor under Canadian operating conditions, the three recurring cost streams sum to approximately $2.15 billion per year at baseline service. To cover that from fare revenue at the modelled fare and load factor, the corridor would need to carry approximately 12.5 million passengers per year. At the modelled baseline service level, fare revenue recovers only 80 per cent of recurring cost — a $439 million annual deficit, incurred before a single dollar of construction debt is serviced.

    This brief builds each of the three cost streams from international benchmarks, stacks them, and derives the break-even ridership. The point is not a verdict on the project. It is to give the reader a structure for testing any published operating-cost or ridership claim against the arithmetic that governs it.

    The Structure

    Three cost streams, three different shapes

    Recurring lifecycle cost is not one number. It is three streams with fundamentally different drivers, and they respond to traffic in opposite ways. Modelling them as a single line item — the common “O&M” or “lifecycle cost” figure — hides the structure that decides whether cost recovery is achievable at all.

    Stream 1 · Maintenance
    Keeping the assets in service
    $1.27B
    per year, MID
    Track, signalling, electrification, structures, stations — inspected, maintained, and periodically renewed. Driven by the existence of the assets, not the traffic on them. 77 per cent fixed.
    Stream 2 · Operations
    Running the trains
    $700M
    per year, MID
    Crew, energy, rolling-stock servicing, station staffing, dispatching, commercial and overhead. Driven by the act of running trains. 69 per cent variable.
    Stream 3 · Fleet capital
    Replacing the trains
    $180M
    per year, MID
    Trainsets wear out after 25–35 years and must be replaced. The acquisition cost is not one-time — it is the first cycle of a periodic recapitalisation, annuitised here for comparability.

    The first two streams have opposite sensitivity to traffic. Maintenance is dominated by the cost of having the assets there at all: patrol, inspection, and age-based renewal continue whether eighty trains run or two hundred. Operations is dominated by the cost of activity: more trains mean more crew-hours, more energy, more servicing. The third stream, fleet capital, is set by the size of the fleet needed to deliver peak service — it does not scale with utilisation at all.

    This opposite-shape structure is why a single bundled cost figure cannot be audited. A reader given only a total cannot tell how much of it is fixed — and the fixed share is precisely what determines how the cost behaves as ridership changes.

    Stream 01 · Infrastructure Maintenance

    The cost of keeping the assets in service

    Infrastructure maintenance has two parts that must be modelled separately. Routine maintenance is annual recurring spend on inspection and preventive and corrective work. Renewal is the periodic capital replacement of long-life components — rail, ballast, contact wire, signalling electronics — annuitised over each asset’s useful life. Conflating the two is the most common business-case error in long-life infrastructure analysis; omitting the renewal annuity understates real lifecycle cost by 40 to 60 per cent.

    $1.27B
    annual maintenance + renewal at the MID central scenario
    $1.08B–$1.52B LOW–HIGH envelope
    77%
    of the maintenance line is fixed — independent of traffic
    a floor of ~$980M/yr that no ridership reduces
    3–10×
    ALTO’s per-train-km infrastructure cost vs mature European peers
    $37–$77/train-km across 40–100 trains/day

    Applied to the worked example — a 1,000 km dedicated double-track corridor at 300 km/h, under an Eastern Canadian climate-and-terrain uplift of 1.375 — the maintenance-plus-renewal total is approximately $1.27 billion per year, or $1.27 million per route-kilometre. Stripping the Canadian uplift leaves an underlying figure of about $920k per route-km, which sits at the top end of the European HSR range — the appropriate position given Canadian labour rates and the absence of a domestic HSR supply chain.

    The structurally important fact is the fixed-cost floor. About $980 million of the annual total is incurred regardless of how many trains run. No ridership scenario reduces it. This is the single most important number for the alternative-framework comparison: a corridor that already exists and is already being maintained for other traffic does not add a fresh fixed-cost floor of this size merely because passenger services are layered onto it.

    Download Note 1
    O&M Note 1: Infrastructure Maintenance Costs for HSR (PDF)
    Cost structure, calculation formula, full asset inventory, Canadian adjustment factors, sensitivity envelope, and the seven-question diagnostic framework — 11 pages
    Download PDF
    Stream 02 · Operations

    The cost of running the trains

    Operating cost decomposes into eight categories. Three — traincrew, traction energy, and rolling-stock light and intermediate servicing — scale directly with train-kilometres. Three — station operations, network control, and insurance — are largely fixed. One (commercial) scales with revenue, and one (general and administrative overhead) is applied as a markup on direct costs. Where infrastructure is dominated by the existence of assets, operations is dominated by the act of running trains.

    $700M
    annual operating cost at the MID baseline service level
    $24 per train-km at 80 trains/day
    69%
    of operating cost is variable — it scales with traffic
    the mirror image of the maintenance line
    51%
    of operating cost sits in just three categories
    crew, rolling-stock servicing, station operations

    At the baseline 80 trains per day, total operating cost is approximately $700 million per year, or $24 per train-km after an Ontario-grid climate uplift. Three categories — traincrew, rolling-stock servicing, and station operations — account for just over half the total. Any cost-reduction strategy that does not touch those three addresses only half of operating cost.

    Two findings cut against common assumptions. Energy is small: traction power is only about 6 per cent of operating cost, so grid decarbonisation or efficiency gains will not materially move the operating line — the environmental argument for high-speed rail rests on modal shift and embodied emissions, not on operating-energy savings. And stations are the largest fixed line: at roughly $18 million per staffed station per year, each additional intermediate stop adds about that much to the fixed-cost floor regardless of how many trains call there. Station-count decisions are not cost-free.

    The alternative-framework comparison matters less here than it does for maintenance. Operating cost per train-km is largely independent of whether the corridor is dedicated high-speed track or shared with other services — so the structural cost advantage of the High Performance Rail (HPR) framework lives in the infrastructure line, not the operations line.

    Download Note 2
    O&M Note 2: Operating Costs for HSR (PDF)
    The eight cost categories, unit-cost parameters, fixed/variable decomposition, frequency sensitivity, and the operating-cost diagnostic framework — 9 pages
    Download PDF
    Stream 03 + Combination · Cost Recovery

    Stacking the three — and the break-even it implies

    The third stream is the fleet itself. Trainsets retire after 25 to 35 years; the acquisition cost is therefore the first cycle of a recurring recapitalisation. For a 30-trainset fleet at roughly $70 million per set — about $2.1 billion of fleet capital — annuitised over a conservative 25-year life at the Treasury Board reference discount rate, the annual fleet-replacement annuity is approximately $180 million per year. Whether the assumed life is 25 or 35 years moves this by only about 10 per cent; what matters is that the cost exists at all, not the exact horizon.

    Summing the three streams at the MID baseline gives the full recurring picture:

    Combined recurring cost — 1,000 km corridor, 80 trains/day, MID
    M · $1.27B
    O · $700M
    F · $180M
    Maintenance & renewal — $1.27B (59%) Operations — $700M (33%) Fleet capital — $180M (8%)
    Total recurring lifecycle cost ≈ $2.15 billion per year · 40-year present value ≈ $28.6 billion

    Collected into a single function of service frequency, combined cost is approximately $1.38 billion in fixed cost plus $9.6 million per train-per-day. Revenue rises along a different line, set by fare yield, seats, load factor, and corridor length. Whether the two lines cross — and at what passenger volume — is the cost-recovery question.

    Break-Even Condition
    Annual fare revenue=Maintenance+Operations+Fleet capital
    ridership × fare=$1.27B+$700M+$180M

    At the modelled fare yield of $0.20 per passenger-kilometre and a 65 per cent load factor, the lines cross at approximately 12.5 million full-corridor passenger trips per year. Below that ridership, the corridor cannot cover its recurring cost from fares — before any allowance for construction debt.

    Service / metric (MID)Value
    Total combined recurring cost (M + O + F)$2,147M / yr
    Fare revenue at 80 trains/day ($0.20/pkm, 65% LF)$1,708M / yr
    Annual deficit at baseline service−$439M / yr
    Cost recovery ratio at baseline0.80
    Break-even ridership12.5M pax / yr
    At baseline service, fare revenue recovers 80 per cent of recurring cost. The $439M deficit is incurred before any construction debt service or return on capital.

    Including fleet replacement raises the break-even by about 15 per cent — from 10.9 million pax/yr on an operations-and-maintenance-only basis to 12.5 million once the trains themselves are paid for. The effect is mechanical: every dollar added to the fixed-cost floor needs roughly 8.5 cents of additional annual contribution to recover.

    Download Note 3
    O&M Note 3: Combined Cost Recovery for ALTO HSR (PDF)
    Fleet-capital methodology, the combined three-stream model, break-even derivation, the yield × load-factor sensitivity matrix, and the cost-recovery diagnostic framework — 16 pages
    Download PDF
    How Fragile Is the Break-Even?

    It moves sharply with fare and load factor

    The 12.5-million figure is not a constant. It depends heavily on two assumptions a business case can set at will unless they are disclosed and benchmarked: the average fare yield, and the average load factor. A modest reduction in either pushes the required ridership up steeply.

    Fare yield ($/pax-km)LF 55%LF 65%LF 75%
    $0.1531.422.919.1
    $0.1818.715.313.5
    $0.20 (MID baseline)14.712.511.3
    $0.2311.19.89.1
    $0.269.08.17.6
    Break-even ridership in millions of full-corridor passenger trips per year. MID baseline ($0.20 yield, 65% LF) highlighted at 12.5M.

    A 25 per cent cut in yield — from $0.20 to $0.15 per passenger-kilometre — nearly doubles the break-even ridership at baseline load factor, from 12.5 to 22.9 million. This matters because $0.20 per passenger-kilometre is already above the European average: SNCF’s TGV and Trenitalia’s Frecciarossa run nearer €0.14 with higher load factors on long-haul routes. A Canadian assumption above the European benchmark requires explicit justification from route economics, demographics, and competing-mode pricing — it cannot simply be asserted.

    Why this matters

    The international record on rail demand forecasts is not encouraging: across a large sample of projects, nine in ten rail forecasts overestimated ridership, with an average overestimation around 100 per cent in the first decade. A break-even at 12.5 million leaves little margin to absorb that kind of forecasting error — and the margin shrinks further at any fare below the modelled $0.20.

    The Honest Answer

    Can the corridor pay to run itself?

    At the modelled baseline, no — not from fares alone. The corridor would need to carry roughly 12.5 million passengers a year to cover its recurring cost, and at the baseline service level it recovers only 80 per cent, running a $439 million annual deficit. And this is the easy half of the cost question. Break-even here is computed on recurring lifecycle cost only.

    The construction cost has not entered yet. At the proponent’s own $60–90 billion estimate, construction debt service alone would add on the order of $2.5 to $5 billion per year — several times the entire operating-and-maintenance surplus available at any plausible service level. The recurring cost recovers, at best, the cost of running the corridor; it does not begin to recover the cost of building it.

    This is not, in itself, an argument against the project. Most large rail systems in the world close their gaps through public subsidy and have done so for over a century. The question the methodology forces is narrower and more answerable: is the recurring cost being disclosed honestly, separated into its three streams, with the fare and load-factor assumptions stated and benchmarked — so that a reader can check whether the ridership forecast clears the break-even the arithmetic requires?

    A reader who knows the cost has three streams, knows the fixed-cost floor cannot be reduced by running more trains, and knows where the break-even sits can ask, at every turn, what the missing terms are. That is what this brief is for.

    For the Next Federal Statement

    Three questions to ask of any operating-cost claim

    Each follows directly from the methodology. None presupposes opposition to any project. Each is the kind of question the arithmetic requires to be answered before a reader can form a judgment.

    1. Are the three streams disclosed separately?

    Maintenance, operations, and fleet capital have different drivers and opposite sensitivities to traffic. A single bundled “O&M” or “lifecycle cost” figure cannot be audited. In particular: is rolling-stock replacement amortised into the recurring line, or quietly treated as one-time acquisition capital? Omitting it understates recurring cost by around 10 per cent.

    2. What fare yield and load factor are assumed?

    Both must be stated and benchmarked. A yield above $0.20 per passenger-kilometre sits above the European average and requires demographic, competitive, and route-specific justification. Without these two numbers, a ridership figure cannot be tested against break-even at all.

    3. What is the cost-recovery ratio at the central ridership forecast?

    Below 1.0, recurring cost cannot be self-funded from fares. Between 1.0 and 1.2 is a thin margin highly exposed to the normal range of forecasting error. And whatever surplus exists above break-even is the only resource available to service construction debt — which is the far larger number.

    None of these questions presupposes a view about whether the corridor should be built. Each is the kind of question a reasonable reader would ask before forming one — and each is a question the published materials have so far not been pressed to answer in the terms the arithmetic requires.

    Sources

    The three notes and their evidence base

    This brief synthesises the three operating-cost research notes produced by the Initiative. Each is available in full below, with the complete derivations, parameter tables, sensitivity analyses, and diagnostic checklists summarised here.

    1.ALTO HSR Citizen Research Initiative, O&M Note 1: Infrastructure Maintenance Costs for HSR, May 2026 — cost structure, calculation formula, asset inventory, Canadian adjustment factors, frequency sensitivity, diagnostic framework.
    2.ALTO HSR Citizen Research Initiative, O&M Note 2: Operating Costs for HSR, May 2026 — the eight operating-cost categories, unit-cost parameters, fixed/variable decomposition, operations-versus-infrastructure elasticities.
    3.ALTO HSR Citizen Research Initiative, O&M Note 3: Combined Cost Recovery for ALTO HSR, May 2026 — fleet-capital methodology, the combined three-stream model, break-even derivation, yield × load-factor sensitivity matrix.
    4.Primary cost benchmarks — California High-Speed Rail Authority, 2024 Business Plan O&M and lifecycle cost models; SNCF Réseau and SNCF Voyageurs annual financial reports; Renfe / ADIF Alta Velocidad annual accounts; UIC Lasting Infrastructure Cost Benchmarking; Federal Railroad Administration HSIPR Best Practices.
    5.Methodology and discount rates — Treasury Board of Canada Secretariat, Canada’s Cost-Benefit Analysis Guide; EU Directive 2012/34/EU and Implementing Regulation 2015/909; CATRIN Deliverable D8; IRG-Rail direct-cost reports.
    6.Demand-forecasting accuracy — Flyvbjerg, Skamris Holm and Buhl, “How (In)accurate Are Demand Forecasts in Public Works Projects?” Journal of the American Planning Association 71, no. 2 (2005); and related reference-class forecasting literature.
    7.ALTO HSR Citizen Research Initiative, Reading the Answer and Reading the Footnote, May 2026 — companion briefs reading the Q-923 cost and ridership claims, and the cost-estimate classification, against the academic record.
  • Reading the ledger

    Reading the Ledger

    The single equation every operating rail corridor has to balance — and what it tells us about ALTO.

    ◆ Foundational Framework

    Most public discussion of major rail projects gets lost in the detail of individual numbers — capital cost, ridership, ticket price, subsidy, projected GDP impact. Each is presented as a standalone claim, defended or contested on its own terms. The result is a debate that produces heat without resolution.

    There is a simpler approach. Every operating rail corridor in the world, public or private, has to balance the same equation every year. The five terms in that equation are not negotiable; the equation is an accounting identity. What is negotiable is which terms are filled in, which are left implicit, and which are quietly set to zero by the proponent’s framing.

    Critical Finding

    Every operating rail corridor has to balance the same five-term equation every year. Choose any three of the four right-hand terms, and the fourth is fixed by arithmetic — not by political assertion. ALTO’s published materials supply numbers for some of the five terms, leave others implicit, and assume one — land value capture — is zero. The result, when written out, does not balance.

    This brief sets out the equation, walks through what anchors each of its five terms, and applies it to ALTO. The point is not to settle the project on a single number. It is to give the reader a structure for reading any major rail project’s published materials and asking the simple question: do the numbers balance?

    Download Full Methodology Paper
    A Framework for Independent Evaluation of the ALTO HSR Project (PDF)
    The annual fiscal ledger framework, the seven-stage analytical pipeline, and the supporting research notes underpinning each ledger term — the full apparatus this brief summarises

    Download PDF

    The Equation

    The five terms every corridor balances

    The ledger looks like this:

    The Annual Fiscal Ledger
    Capex × CRF+O&M and fleet capital=Ridership × Fare+Public subsidy+Land value capture
    annual debt service+annual operating cost=annual farebox+annual subsidy+annual LVC

    In words: the cost of running the corridor in a given year — debt service on the capital outlay, plus operations and maintenance, plus the periodic replacement of the train fleet — must equal the revenue collected from those who ride, plus the public subsidy required to close any remaining gap, plus whatever supplementary revenue is captured from land value uplift around stations.

    The identity is an accounting truism. What makes it analytically useful is that each of its five terms is independently anchored. None can be set at will. Each has a defensible value that emerges from a specific empirical or engineering methodology, rather than from political assertion. A claim that does not specify all five terms is incomplete by construction.

    The five terms group naturally into three sections. The cost side has two: capital service and operating cost. The earned revenue side has one: farebox. The gap-closing section has two: public subsidy and land value capture. Each section is anchored by a distinct methodology, and each gives a particular reader a particular handle on the project.

    Section 01 · The Cost Side

    What it costs to run the corridor each year

    The two cost terms — capital service and operating cost — are anchored by entirely separate methodologies. Both have to be answered before any debate about ticket prices or ridership begins.

    ~$4.9B
    annual capital service at the proponent-stated capex
    $75B capex, 5% / 30-yr CRF
    ~$9.3B
    annual capital service at the reference-class central capex
    $143B central RCF estimate
    ~$2.15B
    annual operating cost: O&M + fleet capital
    Stage 4 bottom-up at MID service

    Capital service (Capex × CRF) is the annual cost of paying back the capital outlay. It is the capital expenditure multiplied by the capital recovery factor, which reflects the cost of capital and the amortisation period. At the proponent-stated $75 billion capex and a representative 5% / 30-year CRF, this is approximately $4.9 billion per year. At the reference-class-adjusted central capex of $143 billion — derived from international cost-overrun patterns calibrated by the corridor’s engineering and community complexity — the same calculation produces approximately $9.3 billion per year.

    Operating cost (O&M and fleet capital) is the annual recurring cost of running the corridor, built bottom-up from corridor asset inventory and service-level inputs across three streams: infrastructure maintenance and renewals, operating categories (traincrew, traction energy, station operations, network control, commercial, insurance, general overhead), and the periodic replacement of trainsets. At MID service intensity this produces approximately $2.15 billion per year — $1.27 billion in infrastructure maintenance, $700 million in operations, and $180 million in fleet capital recapitalisation. International comparators (SNCF Réseau, Network Rail HS1, California HSRA, Spanish ADIF) are used at the end of the build for cross-validation, not as the primary estimating method.

    The crucial methodological point: operating cost is built independently of capital cost. The bottom-up engineering estimate of recurring annual cost does not depend on whatever capex figure the proponent adopts. It is therefore independent of the optimism bias that pervades capital cost estimation in the cost-overrun reference class.

    Why this matters

    A reader who is told only the capital cost has been given half the cost picture. A reader who is told operating cost will be covered by farebox has been given an answer that depends on the next section. Neither of these is a complete account of the cost side of the ledger.

    Section 02 · The Earned Revenue

    What the corridor can actually sell

    The earned revenue side of the ledger has one term: farebox. It is the only revenue source that can in principle be raised by selling something to a willing buyer; everything else on the right-hand side is either a transfer from the treasury or a charge on third parties.

    ~$1.3B
    annual farebox revenue at the welfare-efficient operating point
    Regime B: ~8M riders at fare parity with air
    5–12M
    annual ridership envelope across the operating-regime spectrum
    Stage 5 modal-shift frontier
    24–43M
    ridership figures in ALTO’s published materials
    all sit outside the achievable frontier

    Farebox revenue (Ridership × Fare) is the product of two variables that cannot be chosen independently. Raising fares reduces ridership along the air-rail and road-rail modal-shift S-curves; lowering fares reduces revenue per rider. The achievable combinations of ridership, fare, and corresponding subsidy lie on a one-dimensional frontier through a four-variable space. Choose any one variable, and the other three are fixed by the modal-shift relationships and the corridor’s demographics.

    For ALTO, the modal-shift frontier produces three discrete operating regimes. Regime A (heavy subsidy, deep fare discount to air) lands at approximately 12 million annual riders, $5 billion annual operating subsidy. Regime B (welfare-efficient, fare parity with air) lands at approximately 8 million annual riders, $2 billion annual operating subsidy, with peak fare revenue of approximately $1.29 billion. Regime C (minimal subsidy, yield-managed premium fare) lands at approximately 5 million annual riders, $1 billion annual operating subsidy.

    The Government’s published ridership figures — 24 million annually in some materials, 1.21 billion trips over the first 40 years (averaging approximately 30 million annually) and 43 million annually by 2084 in the Q-923 reply — all sit outside this achievable frontier. The reply’s $100 billion fare-revenue projection over the same forty-year window implies an average fare of approximately $83 per trip, a (fare, ridership) pair the modal-shift framework does not produce.

    Why this matters

    A claim that pairs a ridership figure with no specified fare, or a fare with no specified ridership, is not internally consistent. The two are linked by the corridor’s modal-shift mathematics. The frontier is the single-degree-of-freedom constraint that makes this so — and it is the analytical reason ALTO’s headline ridership figures cannot be defended on the modal-shift evidence.

    Section 03 · The Gap Closers

    What closes the gap between cost and earned revenue

    If farebox revenue does not equal cost — and at every operating point on the modal-shift frontier for ALTO, it does not — the gap has to be closed by something. Two instruments are available.

    $3.6–10.2B
    implied annual public subsidy across the cost and operating-regime range
    the residual that closes the ledger
    5–15%
    share of capital service typically funded by LVC in international comparators
    HS1, Crossrail, MTR, Japan
    $0
    land value capture under ALTO’s currently published scope
    no disclosed LVC instrument

    Public subsidy is the dominant gap-closer in every operational HSR network in the world. Every HSR system except the four highest-density Japanese and Chinese trunks operates with a structural annual operating subsidy on top of capital service support. Even those four required the full capital outlay from public funding. Public subsidy is the residual term in the ledger: whatever closes the gap between annual cost and the sum of farebox plus LVC. It is bounded below by zero (the corridor cannot pay passengers to board) and above by total cost.

    Land value capture is the only large-scale supplementary mechanism with an empirical track record. The known instruments — HS1’s station-area development uplift, Crossrail’s Business Rate Supplement, Hong Kong’s MTR Rail+Property model, Japan’s private-railway joint development arrangements — produce typically five to fifteen per cent of capital service requirements across these comparators. The remainder, in every case, closes through public subsidy.

    ALTO’s published materials disclose no LVC mechanism. Bill C-15 (the High-Speed Rail Network Act) provides streamlined expropriation and right-of-first-refusal authority but no betterment levy, tax-increment financing district, special assessment district, joint development framework, or air-rights regime. The forecast 60,000 to 63,000 new residential units around stations is invoked as a downstream property-tax benefit accruing to municipalities — not as a financing source for the corridor. The Senior Director, Commercial and First Nations Financial Participation role addresses Indigenous equity in Alto itself, not station-area land value capture.

    Under the current published scope, therefore, the LVC term is zero. The entire gap closes through public subsidy.

    Why this matters

    A claim that does not name a mechanism for closing the gap is implicitly claiming that public subsidy will close it. A claim that the corridor will be “self-sustaining” is a claim about a specific term — operating cost coverage by farebox — that says nothing about the much larger term of capital service. The reader who treats “self-sustaining” as a description of the project’s lifetime public cost is reading it against the narrowest available technical definition.

    Side by Side · ALTO’s Ledger

    The published numbers, written out

    Plug ALTO’s published numbers into the equation. The result, in central-case figures for the full corridor at maturity, looks like this:

    Ledger term What ALTO has disclosed
    Capex × CRF — annual capital service. At the proponent-stated $75B capex and a representative 5% / 30-yr CRF, approximately $4.9B per year. At the reference-class central capex ($143B), approximately $9.3B per year. ALTO has disclosed the capex range ($60–90B, AACE Class 5), but has not disclosed the annual capital service figure or the amortisation assumption behind it. The Q-923 reply addressed in Reading the Answer describes operations as “self-sustaining”, a claim that is silent on capital service.
    Term status:Capex disclosed, debt service not
    O&M and fleet capital — annual operating cost, built bottom-up from corridor asset inventory at MID service: ~$2.15B per year. ALTO refers in Q-923 to bottom-up O&M built from operational benchmarks and lifecycle profiles, but no figure has been published. The Stage 4 bottom-up engineering estimate in the methodology paper supplies a defensible ~$2.15B per year.
    Term status:Method described, figure not disclosed
    Ridership × Fare — annual farebox revenue. At the welfare-efficient operating point (Regime B), approximately $1.29B per year. ALTO has disclosed multiple, non-reconciled ridership figures (24M annually, 30M average over forty years, 43M by 2084). Average implied fare of ~$83 per trip from the Q-923 $100B / 40-year revenue figure sits outside the corridor’s achievable modal-shift frontier.
    Term status:Ridership figures non-reconciled and off-frontier
    Land value capture — supplementary revenue from station-area land value uplift. International comparators fund 5–15% of capital service this way. No disclosed mechanism. The forecast 60,000–63,000 new residential units around stations is invoked as a downstream property-tax benefit accruing to municipalities, not as a financing source. The LVC term is zero by default.
    Term status:No mechanism disclosed
    Public subsidy — the residual that closes the gap. With LVC at zero, this is approximately $5.76B per year at proponent-stated capex; approximately $10.16B per year at the reference-class central. Not disclosed in any form. The Q-923 reply asserts operations will be “financially self-sustaining” and “eliminating the need for ongoing operating subsidies.” That framing speaks to the operating cost term, which is the smaller of the two cost terms. It does not speak to the capital service term, which is approximately twice as large.
    Term status:Not disclosed; framed as zero

    At the reference-class central capex of $143 billion, the implied annual subsidy rises to approximately $10.16 billion. At the proponent-stated capex but the high-ridership operating regime (Regime A), the implied subsidy is approximately $3.6 billion per year — lower than the welfare-efficient case because Regime A places a heavier subsidy directly on the operating account, with a larger fare-revenue base offsetting some of it.

    None of these subsidy figures appears in ALTO’s published materials. None appears in the Government’s response to Order Paper Question Q-923. The framing speaks to the operating cost term, which is the smaller of the two cost terms. It does not speak to the capital service term, which is approximately twice as large.

    The Honest Answer

    Does the equation balance?

    Not in any of the operating regimes the modal-shift frontier permits. The corridor at any defensible operating posture produces fare revenue substantially below the sum of capital service and operating cost. The gap, in central-case figures, is between $3.6 billion and $10.2 billion per year — corresponding to a 60-year present value, at standard social discount rates, of roughly $80 billion to $230 billion.

    This is not, in itself, an argument against the project. Most large infrastructure projects in most countries close their gaps through public subsidy and have done so since the nineteenth century. The question is not whether the gap exists — the equation guarantees that it does — but whether the gap is being honestly disclosed and whether the public benefit justifies its size.

    The first half of that question can be answered by reading the published materials carefully. The second half is the political-economy judgment that the institutional process is supposed to support.

    What the methodology developed here does is make the first half answerable. The equation forces the disclosure. Every term is independently anchored, and a published claim that does not specify all five terms is incomplete by construction. A reader who knows what the equation looks like can ask, at every turn, what the missing terms are.

    For the Next Federal Statement

    Three questions to ask of any major rail project

    Each question follows naturally from the ledger framework. None presupposes opposition to any project. Each is the kind of question the equation requires to be answered before any reader can form a judgment.

    1. On the cost side

    What is the annual capital service figure at the stated capex, and over what amortisation period? What is the annual operating cost figure at the planned service level? Are the two reported separately, or aggregated under a single label that conflates them?

    2. On the revenue side

    At what fare is the stated ridership achievable on the relevant modal-shift S-curves? Does the (fare, ridership) pair sit on the corridor’s achievable frontier, or does it require modal-shift behaviour the international evidence does not support?

    3. On the closing terms

    What is the implied annual public subsidy at the stated capex, operating cost, and farebox revenue? Is land value capture being assumed as a financing source? If so, through what disclosed instrument? If not, is the LVC term acknowledged to be zero, and the subsidy term enlarged correspondingly?

    None of these questions presupposes a view about whether ALTO should be built. Each is the kind of question a reasonable reader would ask before forming a view. Each is also the kind of question the parliamentary record has so far not been pressed to answer in the terms the equation requires.

    Sources

    Methodology and supporting documents

    This brief is a synthesis of the analytical methodology developed in the Initiative’s full methodology paper, A Framework for Independent Evaluation of the ALTO HSR Project (May 2026). The methodology paper contains the detailed derivations, reference-class calibrations, and stage-by-stage rubrics summarised here.

    1.ALTO HSR Citizen Research Initiative, A Framework for Independent Evaluation of the ALTO HSR Project (Methodology Paper), May 2026 — the annual fiscal ledger framework, Section 2; the seven-stage analytical pipeline, Sections 3 through 7.
    2.Capital service calibration — CAPEX Notes 1 through 4: Engineering Complexity Rubric; ALTO Engineering Complexity Scorecard; Community Friction and HSR Cost (international comparative analysis); Engineering Complexity and Community Friction as joint predictors of HSR cost.
    3.Operating cost — O&M Notes 1 through 3: Infrastructure Maintenance Costs for HSR; Operating Costs for HSR; Combined Cost Recovery for ALTO HSR.
    4.Modal-shift frontier — MS Notes 1 through 4: Air-rail modal-shift S-curve; Road-rail modal-shift S-curve; ALTO HSR ridership envelope 2035–2080; Subsidy frontier and optimisation.
    5.Land value capture analysis — Methodology Paper, Section 2 (LVC paragraph); LVC Note 1 (assessing the $12 billion claim in the McGill TRAM financial model).
    6.Order Paper Question Q-923, 45th Parliament, 1st session. Asked by Philip Lawrence MP (Northumberland–Clarke), March 5, 2026; answered by the Minister of Transport, April 22, 2026; reply signed by Mike Kelloway, Parliamentary Secretary. ourcommons.ca
    7.ALTO HSR Citizen Research Initiative, Reading the Answer (Cost & Ridership Brief), May 2026 — the companion brief reading the three numerical claims in Q-923 against the academic record.
    8.ALTO HSR Citizen Research Initiative, Reading the Footnote (Cost Estimation Brief), May 2026 — the companion brief on the AACE Class 5 classification and what it implies for the $60–90 billion figure.
    9.ALTO HSR Citizen Research Initiative, The Report That Vanished (Parliamentary Process Brief), May 2026 — the parliamentary record into which the Q-923 reply was placed.