NPV and BCR Projections for ALTO
A deterministic net-present-value analysis over 2029–2080 across three capital-cost scenarios, three operating regimes, and four discount rates — thirty-six combinations, every one of them strongly negative.
Across 36 combinations of capital-cost scenario, operating regime, and discount rate, ALTO produces a financial NPV between −$50 billion and −$246 billion in real 2029 CAD. At the Treasury Board central 8% rate and the welfare-efficient Regime B posture, NPV is −$56B at $75B capex, −$102B at $143B, and −$184B at $264B.
The benefit-cost ratio across the 9-cell capex×regime grid runs from 0.030 to 0.107 — every cell at least nine times below the 1.0 break-even threshold. Capital cost is the dominant driver; operating regime is second-order; the discount rate changes magnitudes but not the direction.
This report evaluates financial and combined NPV over a 52-year horizon, integrating the engineering operating-cost build of the Cost-of-Running-the-Train work with the modal-shift subsidy frontier — a coupled analysis in which ridership, fare, operating cost, and operating subsidy are determined jointly along the corridor’s achievable frontier.
Three capital-cost scenarios bracket the plausible range: a low case at ALTO’s published $75B (~P2.5 of the reference class), a central case at $143B (the reference-class mean under Flyvbjerg’s overrun distribution), and a high case at $264B (the P97.5). Three operating regimes from the subsidy frontier set the achievable operating points: premium (Regime C, 6.1M pax), parity-with-air (Regime B, 8.2M, the revenue peak), and deep-discount (Regime A, 11.2M, near the modal-shift ceiling).
Cost-recovery break-even from fares alone sits at 117 trains/day, or 12.5 million annual passengers at the reference yield — above the modal-shift ceiling. All three regimes operate below it and require ongoing federal operating subsidy. The PV of that subsidy stream is structurally independent of capital cost ($4.6B at Regime C to $7.6B at Regime A at 8%). And the 24-million-by-2055 figure in ALTO’s public materials sits outside every operating point on the frontier and is not modellable under any defensible parameter combination.
What the analysis evaluates
This report presents an NPV analysis of ALTO over 2029–2080, in real 2029 Canadian dollars from the project-sponsor perspective, with a parallel economic overlay for passenger and external benefits. The objective is a defensible quantitative basis for evaluating the project against the standard Treasury Board cost-benefit framework.
The framework integrates two pieces of prior work. Annual operating cost is built from the lifecycle methodology of the operating-cost note — infrastructure maintenance, train operations, and fleet recapitalisation. Ridership, fare, and operating subsidy are determined jointly by the three operating regimes of the subsidy-frontier note, which establish the achievable points on the corridor’s modal-shift frontier. Capital cost is treated through reference-class forecasting, with three scenarios spanning the empirical distribution of cost outturns on comparable HSR megaprojects. Operations are assumed to commence in 2040 after an eleven-year construction period; cash flows include capex during construction, operating cost and ramped fare revenue, three lump-sum renewals at operating years 20/30/40, and a terminal residual at 2080.
Three scenarios from the reference class
Capital cost is the largest single quantity in the analysis and the dominant source of NPV uncertainty. Three scenarios span the plausible range, calibrated by reference-class forecasting on the international HSR cost database (log-normal, mulog = 4.963, sigmalog = 0.312).
Low — $75B
ALTO’s published figure (the centre of the $60–90B Fast Forward range). Sits at ~P2.5 of the reference class — a lower-tail estimate consistent with megaproject optimism bias. Predates the HFR→HSR scope expansion and carries no published contingency.
Central — $143B
The reference-class mean. Applying Flyvbjerg’s 44.7% average rail overrun to the baseline, plus ALTO’s engineering-complexity premium (composite 73–81), gives the modal outcome — the appropriate base case for procurement decisions.
High — $264B
The P97.5 — exceeded by ~1 HSR project in 40. Not a theoretical bound: HS2 Phase 1 (~+250%), California HSR (~+200%), and HSL-Zuid (228%) all approached it. The corridor’s geology and the Canadian P3 record make it a realistic case.
The three scenarios are not equally probable: under the calibrated distribution, the proponent’s figure has roughly a 2.5% chance of being achieved or undercut, the central scenario is the modal outcome, and the high scenario reflects upper-tail risk. Treating $75B as the planning case would require ALTO to be delivered with cost discipline materially better than every comparable international HSR megaproject — a claim for which no evidence has been adduced.
Three points on the achievable frontier
The three operating regimes derive from the subsidy frontier. Each is an internally consistent point on the corridor’s achievable modal-shift frontier, with ridership, fare, revenue, and subsidy following from a single fare posture. No operating point produces high ridership at low subsidy.
| Parameter | Regime C — premium | Regime B — parity | Regime A — discount |
|---|---|---|---|
| Rail-to-air fare ratio | 1.4 | 1.0 | 0.55 |
| Average fare ($/trip) | $207 | $157 | $96 |
| Mature ridership (M pax/yr) | 6.1 | 8.2 | 11.2 |
| Modal share captured | 22% | 30% | 40% |
| Annual fare revenue ($M) | $1,260 | $1,290 | $1,080 |
| Annual operating cost ($M) | $1,928 | $2,116 | $2,385 |
| Annual operating subsidy ($M) | $668 | $826 | $1,305 |
Regime B is the welfare-efficient point under standard cost-benefit assumptions — simultaneously the revenue-maximising point and the per-rider welfare-efficient point. A profit-maximising private operator and a welfare-maximising public authority applying marginal analysis would converge on it, even if they would disagree on whether to operate the corridor at all. Regime A, at 11.2M, approaches the modal-shift ceiling of ~12M; pushing beyond would require corridor-external policy (highway tolls, fuel pricing, aviation limits). The 24-million figure sits above the ceiling — reaching it would require doubling modal share to ~80%, far below cost recovery, and is not modellable as a financial NPV.
Why fares can’t cover cost
Annual operating cost follows the engineering build: $1,381M fixed (infrastructure maintenance $980M + fixed operating $221M + fleet recapitalisation annuity $180M) plus ~$26 per train-km variable, equivalent to $89.7M per million annual passengers at the 450-seat, 65% load-factor convention. Crucially, this cost is driven by service intensity, not by what the infrastructure cost to build — a $264B corridor running 80 trains/day costs essentially the same to operate as a $75B one.
Cost recovery from fares alone, at the reference yield of $0.20/passenger-km, requires approximately 117 trains per day — 12.5 million annual passengers. That threshold sits above the modal-shift ceiling of ~12M. All three regimes operate below it and therefore require ongoing federal operating subsidy.

Strongly negative across all 36 cells
Financial NPV is strongly negative across all 36 combinations of capex scenario, operating regime, and discount rate. The base case — central capex × Regime B × 8% — is −$102.3B, of which the capital component accounts for ~94%.
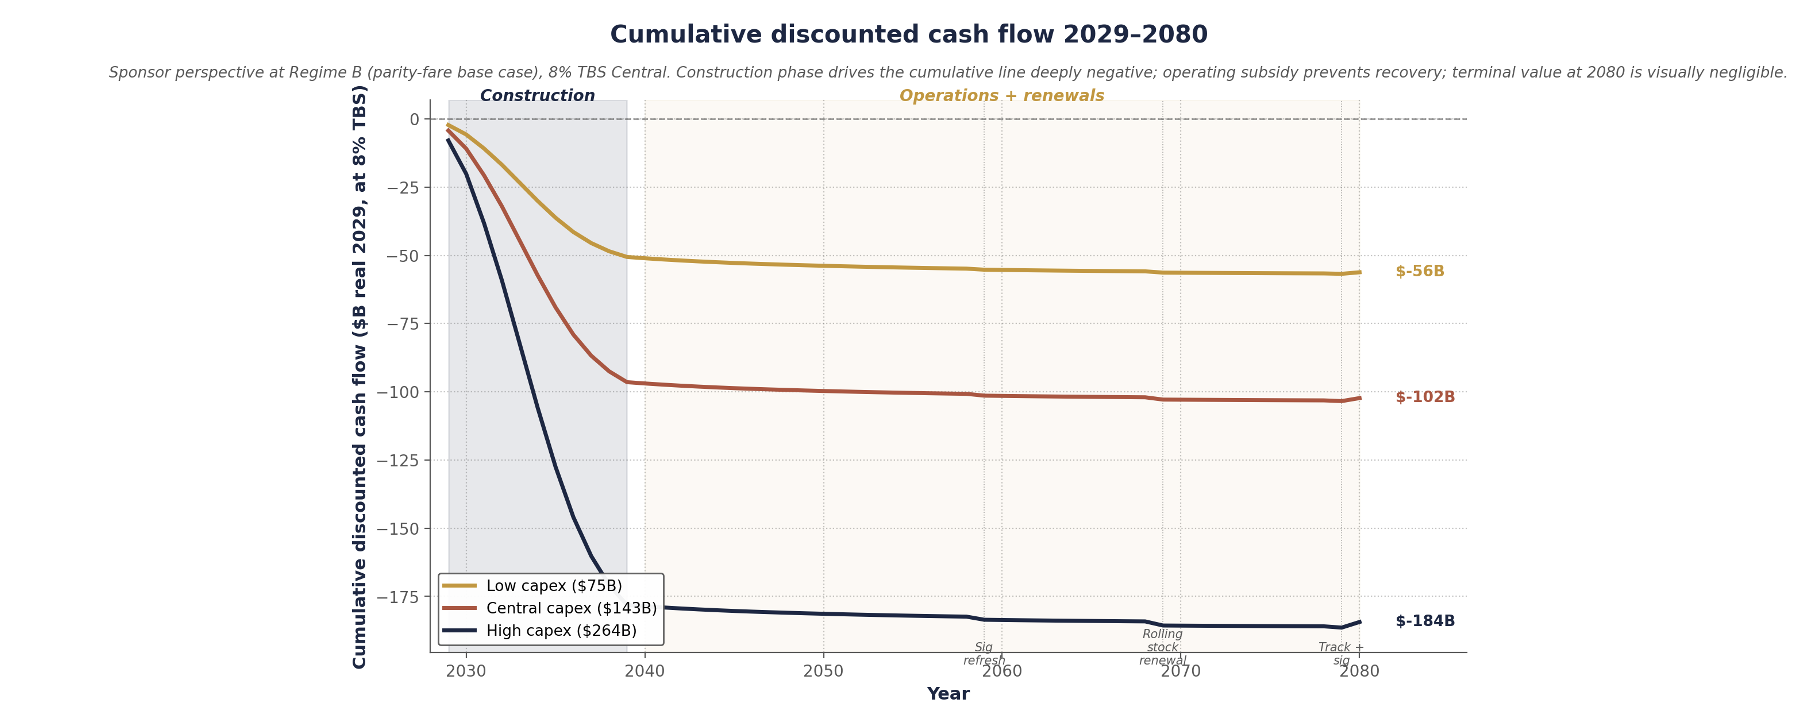
| Capital cost scenario | Regime C | Regime B | Regime A |
|---|---|---|---|
| Low — $75B | ($55.4) | ($56.2) | ($58.5) |
| Central — $143B | ($101.5) | ($102.3) | ($104.6) |
| High — $264B | ($183.6) | ($184.4) | ($186.6) |

The pattern holds across every discount rate. At 5% (HM Treasury Green Book) the base case is −$121.2B; at 3% (long-horizon Treasury), −$136.8B; at 10% (private-capital opportunity cost), −$92.4B. Lower rates produce more negative figures, because the cash-flow profile is dominated by front-loaded capex and operating-subsidy outflows rather than long-dated revenue. The full sensitivity tables are below.
| Discount rate & capex | Regime C | Regime B | Regime A |
|---|---|---|---|
| 5% — Low $75B | ($66.8) | ($68.4) | ($72.9) |
| 5% — Central $143B | ($119.6) | ($121.2) | ($125.6) |
| 5% — High $264B | ($213.4) | ($215.0) | ($219.5) |
| 3% — Low $75B | ($77.1) | ($79.8) | ($87.2) |
| 3% — Central $143B | ($134.1) | ($136.8) | ($144.2) |
| 3% — High $264B | ($235.6) | ($238.2) | ($245.7) |
| 10% — Low $75B | ($49.7) | ($50.2) | ($51.7) |
| 10% — Central $143B | ($91.9) | ($92.4) | ($93.9) |
| 10% — High $264B | ($167.0) | ($167.5) | ($169.0) |

Decoupled from capital cost
The PV of the operating-subsidy stream is structurally independent of capital cost under the engineering build — operating cost is driven by service intensity, not construction outturn. The same subsidy values apply at all three capex scenarios.
| Discount rate | Regime C | Regime B | Regime A |
|---|---|---|---|
| 3% (long-horizon) | $14.2 | $16.9 | $24.3 |
| 5% (Green Book) | $8.7 | $10.3 | $14.7 |
| 8% (TBS Central) | $4.6 | $5.4 | $7.6 |
| 10% (private capital) | $3.1 | $3.7 | $5.2 |
The corridor would impose an ongoing federal operating contribution of roughly $700 million to $1.3 billion per year over four decades, on top of the federal share of capital service. Adding capital service (federal share 50%, 6% blended cost of capital, 40-year amortisation) of ~$2.5B/yr at Low, $4.8B at Central, and $8.8B at High, the full annual federal cost at Regime B ranges from ~$3.3B to ~$9.6B per year — a full-cost-per-rider of $405 to $1,171, five to fourteen times the federal value-of-time benefit per rider.

An order of magnitude below break-even
The economic overlay adds five benefit categories (passenger time savings, modal-shift GHG, accident reduction, local externalities) and one cost (embodied construction carbon). It is small relative to the financial cash flow: even at Regime A, the largest overlay of $1.94B is ~1/50th of the central financial NPV. It does not move the directional finding.
| Component | Regime C | Regime B | Regime A |
|---|---|---|---|
| Passenger time savings | $1.28 | $1.72 | $2.35 |
| Modal-shift GHG savings | $0.10 | $0.14 | $0.19 |
| Embodied carbon (debit) | ($2.48) | ($2.48) | ($2.48) |
| Accident reduction | $0.88 | $1.18 | $1.61 |
| Local externalities | $0.15 | $0.20 | $0.27 |
| Total economic overlay | ($0.07) | $0.76 | $1.94 |
| Capital cost scenario | Regime C | Regime B | Regime A |
|---|---|---|---|
| Low — $75B | 0.092 | 0.106 | 0.107 |
| Central — $143B | 0.053 | 0.061 | 0.062 |
| High — $264B | 0.030 | 0.035 | 0.036 |
The most favourable cell anywhere — Low capex × Regime A — requires conjoining ALTO’s own optimistic capex with the deep-discount posture that maximises ridership; neither half is publicly committed to. Under the central reference-class capex, the highest achievable BCR is 0.062, about one-sixteenth of break-even. For context, the Ontario provincial HSR study of 2016 rejected a comparable 300 km/h scope at a reported BCR of 0.70 — this analysis finds the ALTO option materially worse than the level at which Ontario rejected comparable scope a decade earlier.
A target outside the frontier
The 24-million-by-2055 figure in ALTO’s public materials sits outside the achievable frontier. The modal-shift ceiling is ~12 million annual passengers — at Regime A, capturing 40% of the addressable market. Reaching 24 million would require doubling modal share to ~80%, which means fares well below cost recovery plus structural changes to the corridor’s competitive position against car and air that go beyond any operating posture.

The 24-million figure is therefore not a defensible operating point and is not modellable as a financial NPV under the regime framework. Public communication that pairs the 24-million target with operating-cost or subsidy figures drawn from other points on the frontier is internally inconsistent — the corridor cannot simultaneously achieve 24-million ridership and the operating subsidy of any regime on the frontier.
The viability question is a capex question
Negative across every combination
Financial NPV ranges from −$55B to −$187B at 8%; the central case is −$102B. BCR runs 0.030–0.107 — every cell at least nine times below break-even. The probability of positive NPV under any defensible scenario is negligible.
Capital cost dominates
Low→High capex swings NPV by ~$130B at 8%; Regime C→A swings it by only ~$3B. The choice of operating regime is second-order once capital is committed. The first-order question is whether to commit the capital.
Operating subsidy is decoupled
Operating cost is driven by service intensity, not construction outturn — a corridor running 80 trains/day costs the same to operate whether built at $75B or $264B. The subsidy stream can be planned independently of the capital outturn.
An HPR review is warranted
The single largest lever for project economics is cost containment, and the reference class gives no basis for assuming ALTO beats it. An independent review of the High Performance Rail alternative — a lower-capex configuration delivering comparable user benefits over the same corridor — is warranted before any corridor-selection decision.
Proceeding with ALTO at any defensible parameter combination would impose a significant net cost on Canadian public finances over the analysis horizon, even after accounting for non-financial passenger and environmental benefits. The High Performance Rail framework — 200 km/h electrified passenger rail along the Highway 401 corridor, using existing rail corridor rather than greenfield HSR construction — would not attract the same reference-class capital premium, and an independent review should compare the two on the same NPV framework, with HPR producing materially less negative NPV and materially higher BCR across every defensible parameter combination.
Framework and parameters
The analysis is conducted from the project-sponsor perspective in real 2029 CAD over 2029–2080 (period 0 = 2029), counting direct cash flows: capex, operating cost, renewals, fare revenue, and terminal residual. Capex is allocated across 2029–2039 on an eleven-year S-curve (3% in 2029, peaking at 13% in 2034–35, tapering to 6% in 2039). Three renewals are modelled — signalling at operating year 20 (4% of capex), rolling stock at year 30 (12%), combined track-and-signalling at year 40 (8%) — and a terminal residual at 2080 of 40% of capex. Demand ramps from 50% of mature ridership in 2040 to 100% by 2047; real fare yield erodes 0.5%/yr.
Operating cost follows the engineering build: $1,381M fixed plus $26/train-km variable (equivalently $89.7M per million annual passengers at 450 seats × 65% load factor × 1,000 km), calibrated against the California HSR 2024 Business Plan O&M model, SNCF Réseau and SNCF Voyageurs reports, ADIF AV accounts, and the UIC LICB series. Capital cost scenarios ($75B / $143B / $264B) come from Flyvbjerg reference-class forecasting on the international HSR cost database (log-normal, mulog = 4.963, sigmalog = 0.312) with corridor-specific complexity adjustments. The economic overlay uses 1.75 h saved per trip at $25/h, modal-shift GHG of 113 kt/yr at the Regime B baseline valued at $250/t, embodied construction carbon of 14.69 Mt, accident reduction at $30/pax, and local externalities at $5/pax; network and agglomeration effects are excluded. The analysis is deterministic across the 36-cell grid; a probabilistic overlay would refine the central tendency but not change the directional finding.