Category: Post-consultation

  • Nanos research analysis July 2

    Polling note · ALTO HSR Citizen Research Initiative

    Public priority for ALTO: split nationally, divided by geography

    A June 2026 Nanos survey for CTV News finds Canadians evenly divided on whether building the Toronto–Québec City high-speed line should be a federal priority — with real support confined to the corridor it would serve, and firm resistance in the West.

    Nanos Research asked 1,051 Canadians, between June 26 and 28, 2026, to rate on a 0-to-10 scale how much of a priority it is for the Government of Canada to build the ALTO high-speed rail project. The question told respondents the line would be Canada’s first high-speed railway and that the estimated cost is between $60 and $90 billion, drawing on both public and private investment. The margin of error is ±3.0 percentage points, 19 times out of 20.

    How much of a priority is building ALTO? Public priority for the Toronto–Québec City high-speed rail line, on a 0–10 scale A. National distribution, all 0–10 responses 0% 5% 10% 15% 20% 25% 22.9 0 3.8 1 5.7 2 5.3 3 4.1 4 8.2 5 7.6 6 13.2 7 7.9 8 6 9 11.3 10 “Not at all” “Very high” ◂ Low priority (0–3): 38% Neutral (4–6): 20% High priority (7–10): 38% ▸ Twice as many place it at 0 (23%) as at 10 (11%); median 5, mean 4.8. Balanced bands, but the intensity sits at the bottom. B. Regional lean — low vs. high priority (neutral and unsure omitted) lower ← priority → higher Quebec 33% 48% ▲ mean 5.4 Ontario 35% 43% mean 5.2 Atlantic 33% 38% mean 4.8 Canada 38% 38% mean 4.8 (national) British Columbia 41% 31% mean 4.1 Prairies 50% ▲ 21% ▼ mean 3.4 ▲ / ▼ significantly above / below the national result. Corridor provinces lean positive; the West leans negative. Source: Nanos Research for CTV News (“Power Play”), n=1,051 Canadians, June 26–28, 2026; margin of error ±3.0 pp, 19/20. Full report and data tables: nanos.co. Chart: ALTO HSR Citizen Research Initiative · citizenresearch.ca

    A national tie — with the intensity at the bottom

    On the collapsed scale the country divides almost exactly in half: 38% rate building ALTO a high priority (7–10) and 38% a low priority (0–3), with 20% neutral and 4% unsure. The mean is 4.8, just below the scale’s midpoint. But the full distribution is not symmetric. The single most common answer is “0 — not at all a priority,” chosen by 23% — roughly twice the 11% who pick “10 — very high priority.” The high side is more spread across 7 through 10; the low side is anchored at the floor. Where the poll registers deprioritization, it tends to be firm.

    Support concentrated in the corridor

    Priority tracks geography closely. In Quebec, 48% call it a high priority — significantly above the national figure — and Ontario is similar at 43%; both corridor provinces sit above the midpoint on the mean. Outside the corridor the pattern reverses: in the Prairies a majority (50%) rate it a low priority and only 21% a high one, the sole region where “not a priority” is an outright majority; British Columbia leans the same way (41% low, 31% high). Atlantic Canada sits close to the national average. Statistically, the defensible reading is that the corridor provinces lean positive and the West leans negative — individual provinces within each bloc are not clearly distinguishable from one another.

    Other differences

    Men are more favourable than women (mean 5.0 versus 4.6; 42% high priority versus 35%), a gap that holds up under direct testing. Age, by contrast, is essentially flat — younger and older Canadians rate the project about the same.

    How to read it

    Two cautions. First, the question measures priority, not approval: it asks where ALTO ranks against everything else the federal government could spend on, so a respondent can favour high-speed rail in principle and still place it low against competing demands. Second, the question anchored respondents to the project’s own cost estimate of $60–90 billion; survey responses are sensitive to the figures a question supplies, and this is the lower end of the plausible range. Regional subgroups also carry wider margins of error (roughly ±5 to ±10 points) than the national result, so fine distinctions within a region should be read with care.

    Data source. Nanos Research for CTV News, “Power Play” June omnibus. RDD dual-frame hybrid telephone and online survey of 1,051 Canadians aged 18+, June 26–28, 2026; margin of error ±3.0 percentage points, 19/20; weighted by age and gender (2021 Census) and geographically stratified.
     •  Full report (PDF): https://nanos.co/wp-content/uploads/2026/07/2026-3086-CTV-June-PowerPlay-Report.pdf
     •  Detailed data tables (Excel): https://nanosresearch.sharepoint.com/:x:/s/NanosSharedProjects/IQBHe5k3wYL4RaW7ViFAsbIiATFRJyps7gut2JBtXmC1lvY?e=EVZ84C
     •  Methodology & more polling: nanos.co
    Figures in this note and chart are drawn from the published data tables for question 2026-3086; the 0–10 distribution, subgroup breakdowns, and significance testing are as released.
    ALTO HSR Citizen Research Initiative  ·  Independent & non-partisan  ·  citizenresearch.ca  ·  This note summarizes third-party polling; it is descriptive and does not represent an endorsement or a voting-intention finding.
  • The Anatomy of an Optimistic Forecast

    The Anatomy of an Optimistic Forecast — ALTO HSR Citizen Research Initiative

    The Anatomy of an Optimistic Forecast

    Behavioural bias in the ALTO project — a diagnostic reading of the Flyvbjerg framework.

    ● In Plain Language

    Arguments about ALTO tend to happen one number at a time: the project publishes a cost or a ridership figure, critics dispute it, and the debate moves on to the next number. This paper argues that this is the wrong argument to be having.

    Three decades of research by the Oxford scholar Bent Flyvbjerg, drawn from the largest database of major projects ever assembled, shows that the forecasts for big infrastructure projects are not wrong at random. They are wrong in the same direction almost every time: costs come in far higher than promised, and benefits such as ridership come in far lower. On average, rail projects cost about 1.4 times their estimate and carry about two-thirds of the riders forecast.

    That consistency is the clue. An honest mistake would scatter — sometimes too high, sometimes too low. Error that reliably points one way — the way that helps a project win funding — is the signature of something other than honest error.

    The paper is careful about what this does and does not show. It does not accuse anyone of lying. It says plainly that intent cannot be read from the outside, and that a non-partisan initiative should not pretend otherwise. What it asks is simpler: rather than trusting the project’s own bottom-up numbers, check them against what actually happened to comparable projects elsewhere. That check — taking the “outside view” — is the standard corrective the research recommends.

    Both halves of that pattern are already visible in ALTO’s own conduct. In June 2026 the project released two studies attaching large dollar figures to the line’s benefits — one putting the economic gain at around $24 billion a year, the other adding up to roughly $4 billion a year from tourism. Neither weighs those benefits against what the line would cost to build and run. They are the benefit half of the pattern above, arriving on schedule: impressive numbers with the price tag left off the page.

    At the same time, ALTO has — to its credit — done the very thing this paper recommends: it commissioned the outside check. That contract was awarded, without competition, to Oxford Global Projects, the firm founded by Bent Flyvbjerg, to measure the project against the record of thousands of comparable projects worldwide. The question that decides everything is whether ALTO’s published figures were changed to match what that check found, or whether the check was commissioned and then set aside. The single document that would answer it has been requested; ALTO has delayed releasing it until at least September 2026. Until it appears, we cannot know whether the project’s own outside check confirmed its numbers or contradicted them. The simplest way to settle that is for ALTO to publish the comparison in full, for everyone to see — the inside figures and the outside-view figures side by side, unredacted. The outside view was always meant to be seen, not filed away.

    Two things make this urgent for ALTO. It is exactly the kind of project — large, politically sponsored, competing for scarce public money — where the pressure to make the numbers look approvable is highest. And the window to apply the test is closing: once enough money is committed, a project becomes very hard to stop, whatever the evidence later shows. The paper’s single recommendation is to test ALTO’s numbers against the record of similar projects before that point of no return. What should be built instead is left to other work.

    Abstract

    Public debate about ALTO has so far been conducted largely in the currency of individual numbers — a cost estimate here, a ridership projection there — contested one at a time. This paper argues that the more revealing question is not whether any single figure is wrong, but whether ALTO’s figures are wrong in a patterned way, and what that pattern signifies.

    Drawing on Bent Flyvbjerg’s behavioural account of megaproject planning, it treats ALTO’s forecasts as a case to be diagnosed rather than merely audited. The central instrument is Flyvbjerg’s distinction between cognitive bias (innocent optimism) and political bias (deliberate strategic misrepresentation), together with his demonstration that the two are separable by the direction and consistency of forecasting error rather than by any claim about the inner states of forecasters. On that test, the paper sets out why ALTO’s profile places it where the theory predicts strategic distortion will dominate, and why the appropriate response is not the imputation of motive but the substitution of an outside view for the proponent’s inside one. The analysis is diagnostic only; the design of an alternative framework is reserved for other Initiative work.

    Download
    The Anatomy of an Optimistic Forecast — Full Working Paper (PDF)
    The complete diagnostic reading of the Flyvbjerg framework as applied to ALTO, with full citations
    Download PDF
    1 · The Frame

    The wrong argument to be having

    With the public consultation now closed, the contest over ALTO has settled into a familiar shape: the proponent advances a figure, critics advance a rival figure, and the exchange proceeds number by number. This is an argument the proponent is structurally well placed to win, because it concedes the most important point before the first number is spoken — the premise that each estimate is an independent technical product to be checked on its own terms.

    Bent Flyvbjerg’s body of work, accumulated over three decades and the largest project database of its kind, exists to deny exactly that premise. His finding is that the estimates are neither independent nor merely technical: across project types, eras, and continents, they err in the same direction, by large margins, with no improvement over time.

    That regularity changes the nature of the inquiry. If forecasting error were technical noise, it would be scattered — sometimes high, sometimes low — and the right response would be a better model. Because it is instead systematic and directional, the right response is to ask what produces a bias rather than an error. This paper pursues that question for ALTO. It asks what kind of distortion is in play, how an observer could tell one kind from another without reading minds, and what follows for how the project should be appraised. It is a diagnosis, not a verdict on any person, and it stops short of proposing what should be built instead.

    2 · The Distinction

    Two theories of a bad forecast

    Flyvbjerg’s decisive move is to refuse the assumption, common in behavioural economics, that all behavioural distortion reduces to cognition. Cognitive bias, he argues, is only half the story; political bias is the other half. The two halves correspond to two competing explanations of the same observed outcome — costs that come in high and benefits that come in low.

    Optimism bias — the cognitive accountStrategic misrepresentation — the political account
    What it is. A genuine cognitive failing, non-deliberate, in whose grip planners are unaware they are being optimistic. What it is. The deliberate distortion of information to secure a desired end — which, by the definitions Flyvbjerg borrows from the philosophical literature on deception, is plainly lying.
    The kind of defect. A defect of method. The kind of defect. A defect of incentive.
    The cure. Better technique — forcing distributional, outside-view information into the estimate. The cure. Changing what forecasters are rewarded and held accountable for.
    When it dominates. Where stakes and pressure are low — small projects with little top-management attention. When it dominates. Where a minister or chief executive must have a particular project. Optimism remains present, reinforcing rather than absent.

    The distinction is not academic. The two diagnoses share a symptom and an outcome but differ in everything that matters for response. Confuse the two and the prescribed remedy will miss. Flyvbjerg’s now-settled position, reached through a long exchange with Daniel Kahneman, is that real decisions involve both, with the mix shifting along a scale of political-organisational pressure.

    The mechanism he names is brutally simple, and worth stating in its bare form because it is the engine of everything that follows: underestimated costs plus overestimated benefits equals funding. A low cost estimate is more easily approved, and so produces overrun; a high benefit estimate is more easily approved, and so produces shortfall. The bias is therefore not random but functional — it points in the direction that wins the competition for scarce capital. Flyvbjerg has called the resulting practice design by deception, and it is the practice, not the individual, that the framework indicts.

    3 · The Placement

    Where ALTO sits on the scale

    If the balance between innocent optimism and deliberate misrepresentation depends on the degree of political-organisational pressure, then locating a project on that scale is the first analytical task. Flyvbjerg’s Proposition 1 holds that for small projects with low strategic import and little top-management attention, bias, if present, originates mainly in cognition. His Proposition 2 holds that for large projects with high strategic import and ample top-management attention, bias originates mainly in politics — in strategic misrepresentation — though cognitive bias remains present.

    ALTO sits at the upper extreme of every variable in that proposition. It is delivered through a Crown corporation carrying a multi-billion-dollar mandate; it enjoys explicit ministerial sponsorship; and it competes with every other federal priority for a finite pool of capital. By the framework’s own logic, this is precisely the configuration in which strategic misrepresentation should be expected to be the dominant bias, with optimism layered on top.

    This conclusion is worth stating carefully: it is not yet a finding that ALTO’s numbers are distorted. It is a prediction, derived from the project’s structural profile, about where to look and what kind of distortion to expect if distortion is present. The remaining sections test that prediction against the evidence the framework makes available.

    4 · The Unit of Analysis

    Uniqueness, the inside view, and the reference-class problem

    The deepest thread runs through three of Flyvbjerg’s biases that are really one problem under three names: uniqueness bias, the inside view, and base-rate neglect. A jurisdiction that has never built high-speed rail treats the undertaking as unique; uniqueness licenses the “inside view,” in which the estimate is built bottom-up from the specifics of this project; and the inside view licenses ignoring the base rate of comparable projects elsewhere. The promotional framing of ALTO — the first true high-speed rail in Canada, a singular corridor, distinctive Shield geology — is structurally identical to that pattern.

    What the appeal to uniqueness accomplishes is epistemological, and it is the crux of the whole dispute. To call a project unique is to set the size of its reference class to one, and a reference class of one renders the proponent’s bottom-up estimate the only admissible evidence. This is, at bottom, the reference-class problem from the philosophy of probability: any individual case belongs to indefinitely many classes, and the probability one assigns depends entirely on which class is chosen. The proponent wants the operative class to be “this project.” The Initiative’s instruments are, in this light, a single sustained argument that ALTO is a member of the class “high-speed and intercity rail megaprojects,” for which abundant outcome data exist. The disagreement is not, at root, about any one number. It is about the unit of analysis.

    That reframing matters because the outside view carries decisive quantitative content. On the largest dataset of its kind:

    1.40×
    what rail projects cost, on average, relative to estimate
    Flyvbjerg & Bester 2021
    ~⅔
    the share of forecast benefits that rail projects actually deliver (about 0.66)
    Flyvbjerg 2021, Table 2
    ~0.47×
    of the promised benefit–cost ratio that survives the generic rail correction — before any ALTO-specific factor
    0.66 ÷ 1.40

    Demand forecasts are worse still: for nine of ten rail projects passenger forecasts are overestimated, by an average of roughly 106 per cent, and for the high-speed subclass specifically the average cost escalation is higher than for rail as a whole. A single illustrative operation follows. Apply the generic rail correction to any proponent’s own benefit-cost ratio — multiply by roughly 0.66 divided by 1.40 — and the realised ratio falls to about 0.47 of what was promised, before a single ALTO-specific complication is added. Where the Initiative’s appraisal already places ALTO’s social benefit-cost ratio far below break-even on its own terms, the outside-view correction compounds on top of it. The philosophical point is that this correction imputes no motive whatsoever. It is simply what the base rate is.

    A live datum from the reference class · HS2, June 2026

    The abstraction acquires a face in Britain’s High Speed Two, the nearest contemporary member of the class. A National Audit Office report published on 29 June 2026 records that the cost of the London–Birmingham programme has roughly doubled since 2020 — an increase of some £36 billion excluding inflation — and that the full railway is now expected between three and thirteen years later than first planned. Most telling for the present argument is the fate of the project’s benefit–cost ratio. At the 2020 decision to proceed it stood at 1.2, or “low value for money.” Recomputed with the costs now known — had those costs been visible in 2020 — the auditor puts it at 0.3 to 0.4: “poor value for money.”

    The operation is not identical to the reference-class correction above; it substitutes the realised cost while holding benefits roughly fixed, rather than adjusting the two together. But its direction and magnitude corroborate the same claim, and do so from an independent auditor’s evidence rather than a critic’s model: the approval-stage ratio was an artefact of underestimation, and on realised costs the case for the project fell below viability from the outset.

    A qualification sharpens rather than softens the point. The proponent’s own benefit case does reach for the outside view — but only for the half of the ledger that flatters it. The two studies ALTO released in June 2026 build their benefit magnitudes almost entirely from the international high-speed-rail literature, the same European and Chinese reference class the Initiative invokes. What they import from that class is the size of the upside; what they decline to import is its base rate for realisation — that rail benefits arrive at about two-thirds of forecast and passenger numbers are overstated by roughly a hundred per cent. The class is admitted where it raises the estimate and excused where it would discipline it: base-rate neglect not as an oversight but as a selection rule.

    5 · The Evidence

    The evidential signature: deception versus error

    Here the analysis must be most disciplined, because here it is most tempting to overreach. Intent cannot be observed, and a non-partisan research initiative should not pretend otherwise. The framework, read carefully, does not ask it to. What it supplies instead is a distributional signature.

    Genuine technical error would scatter symmetrically around zero — a roughly normal distribution of overshoots and undershoots, centred near accuracy. What the data actually show is error that is consistently directional: costs under, benefits over, stable across decades and continents, with no improvement as techniques supposedly advance. That asymmetry is the tell. Innocent error is not supposed to know which way to point. When error reliably points in the funding-favourable direction across an entire population of projects, the hypothesis that cognition alone is responsible is the hypothesis that gets falsified.

    This is also how Flyvbjerg reads the verdict of Martin Wachs, who after decades studying transportation forecasting concluded that the persistent gaps between forecast and outcome amount not to a technical failing but to a collective failure of professional ethics. For ALTO, the methodologically honest claim is therefore not “the proponent is lying,” which cannot be established and which would forfeit the Initiative’s standing, but something more precise and more durable: that ALTO’s estimates exhibit the canonical directional signature — every adjustable assumption resolved in the direction that favours viability — and that this signature is, on the largest body of evidence in the field, the fingerprint of strategic distortion rather than honest error. The structure of the error carries the inference; the reader is left to draw the conclusion about agency. That is both the more rigorous posture and the more defensible one.

    A live datum from the proponent’s side · ALTO’s benefit case, June 2026

    If High Speed Two shows the cost half of the mechanism coming true after the fact, two studies ALTO released the same month — June 2026, two months after the consultation had closed — show the benefit half being assembled before it. A computable-general-equilibrium assessment of structural economic impacts reports a national real-GDP gain of about $24.4 billion a year; a corridor tourism study adds up to $3.9 billion in GDP and 43,000 jobs. Neither nets a cost. The macro study excludes construction and operating expenditure by design; the tourism study has no cost side to exclude. What both offer is a benefit total unaccompanied by the outlay required to obtain it.

    Their internal architecture is the directional signature in miniature. Each is built as a fan of scenarios — pessimistic to optimistic, low to high coordination — and in each the entire fan sits above zero. Every table of the macro study prints the same line, that welfare increases in every scenario; the tourism study’s weakest case is still $177 million and two thousand jobs. The scenario space has a floor at the baseline and no downside tail: the modelled question is only ever how large the gain is, never whether there is a loss. Even the reports’ own adverse mechanisms are kept from reaching the total — the tourism study concedes that faster trains shorten stays and turn overnight visits into day trips, and shows length of stay going negative in several cities, yet the aggregate is arranged to rise regardless.

    The sharpest tell is where the two documents contradict each other. The macro study omits domestic tourism on the ground that it is largely substitution from other household spending, with little net effect on national output; the tourism study builds most of its $33.7-billion base, and most of its headline uplift, from precisely that in-corridor domestic travel, counted through gross input–output multipliers that assume no such displacement. Where the promoter’s two reports disagree, each resolves the disagreement toward its own larger number. Both, to their credit, label their outputs illustrative, order-of-magnitude, and not forecasts, and make the largest figures conditional on tourism policy the railway itself does not deliver — but the numbers that leave the page are round and unconditional. The caveats stay in the prose; the figures travel. As with HS2, no claim about anyone’s honesty is required: it is enough that every adjustable assumption has resolved in the direction that favours the project.

    6 · The Selection Effect

    Survival of the unfittest

    The most consequential idea in the framework, for understanding how a project like ALTO comes to exist at all, is Flyvbjerg’s inverted Darwinism. It is not the best projects that get built, he argues, but the projects that look best on paper — and the projects that look best on paper are precisely those with the largest cost underestimates and benefit overestimates, which makes them, in reality, among the worst. The approval process thus operates as an adverse-selection mechanism, a Gresham’s law for infrastructure in which optimistic estimates drive out honest ones, because the candid project that books realistic costs and realistic ridership loses the funding contest to the one that does not.

    This reframes the central question. The issue is not merely whether ALTO is a sound project that may encounter difficulties. It is what it signifies that this project, rather than a more modest alternative, is the one that cleared the hurdles. On the selection logic, a project may clear those hurdles partly because it presented numbers a more candid competitor could not match and still survive. The very fact of approval, in an environment that rewards optimism, is therefore itself a piece of evidence — not proof of bad faith, but a structural reason to distrust the survivor’s own paperwork.

    7 · The Consultation

    Power, convexity, and the exclusion of the outside view

    Flyvbjerg’s claim that power amplifies cognitive bias — that powerful decision-makers are, in his phrase, convexity generators, more swayed by what comes readily to mind and more optimistic about risk — connects this framework to his earlier study of rationality and power. The mechanism that should most interest an observer of ALTO is institutional rather than psychological: he documents that those in power tend to exclude experts and deliberative scrutiny when the stakes are highest, precisely because deliberation threatens to disturb a decision already taken.

    A public consultation is, in principle, the institutional site at which the outside view ought to enter — the moment when base rates, comparator projects, and independent reference-class evidence acquire standing against the proponent’s inside view. The outside view is, after all, the established corrective: quality control by way of comparison with completed projects. The question a consultation poses, then, is whether it is genuinely structured to admit that evidence, or whether it functions to ratify a conclusion reached in advance. The Initiative’s critique of the consultation’s adequacy can be restated in exactly these terms: it is the claim that the outside view is being structurally excluded — which is what the theory predicts will happen at the high-pressure end of the scale, where ALTO sits. Exclusion, it should be said, is not always outright refusal; as the next section shows, the outside view can also be admitted so late that it can no longer change the answer, which is exclusion by another clock.

    One objection presents itself immediately, and it is worth meeting head-on. It might be said that ALTO did not exclude the outside view at all — that it went out and bought it. In 2024 the proponent issued an advance contract award notice, PAS240625-002-00, for reference-class forecasting, should-cost and should-schedule modelling, and a series of Challenge Boards, and named a single pre-identified supplier on the ground that only one firm was capable of the work. That firm is Oxford Global Projects, the consultancy founded by Bent Flyvbjerg and Alexander Budzier — the commercial vehicle of the very framework this paper applies, retained to take the outside view on ALTO’s own numbers. On its face this cuts against any claim of exclusion: the proponent engaged the outside view’s own author’s firm.

    But procuring the instrument is not the same as letting it bind, and that distinction is the whole of the matter. Reference-class forecasting debiases only when its outside-view figure is permitted to move the decision; a should-cost that is commissioned, filed, and left beside an unchanged inside-view estimate is not a corrective but a credential. The framework is explicit that the failure mode is not the absence of the outside view but its subordination — the number produced and then declined. The decisive record, accordingly, is not the existence of the forecast but the comparison: does ALTO’s published capital cost and benefit-cost ratio reflect its own reference-class should-cost, or diverge from it? That single document — the inside view and the outside view set side by side — would settle more than any figure the Initiative could model, because it would be the proponent’s own instrument speaking. This yields a falsifiable prediction rather than an accusation: if the commissioned reference-class numbers are more conservative than the figures ALTO has advanced in public, the outside view was procured and parked; if they match, the cost critique weakens accordingly. The test is available, and it is coming due.

    8 · The Timing

    Escalation, lock-in, and the manufactured point of no return

    Escalation of commitment enters this analysis chiefly as a prospective warning rather than a present diagnosis. Flyvbjerg ties it to preferential attachment: the projects that look best on paper attract the initial funding; initial funding creates lock-in; and once a point of no return is passed, further funds flow to close the gap between the original underestimate and the real cost — good money thrown after bad. Early disbursement is not incidental to this process. It is frequently the instrument by which the point of no return is engineered, so that cancellation comes to entail an irretrievable loss of money and of face.

    Read in this frame, the contract-commitment data emerging through the Initiative’s access-to-information work is significant less as a record of spending than as a measure of how far the lock-in mechanism has already advanced. The more that is committed before the numbers are independently tested, the harder it becomes for any future government to halt the project, whatever the evidence then shows. The implication is about timing, not motive: the window in which an outside view can still alter the decision is open now and closing — which is the strongest available argument for the urgency of independent appraisal before commitment hardens into inevitability.

    The same access-to-information channel now supplies a timing datum of its own. The Initiative’s request for the reference-class records described above — the workbook, the should-cost and should-schedule outputs, and above all any document setting the inside view beside the outside view — was met in June 2026 with a ninety-day extension carrying the response to 18 September 2026, and with a notice invoking third-party consultation under section 27. That combination foreshadows a commercial-confidence claim over precisely the should-cost and should-schedule figures that would make the comparison legible. The mechanism is the one this section describes, observed in real time: the record capable of disciplining the decision is scheduled to arrive, if at all, in redacted form and only after further commitment has hardened. Whether it plays out that way is, again, a matter the disclosure itself will settle — but the sequence is the point, and the sequence is the framework’s.

    High Speed Two shows the lock-in mechanism operating in plain sight, and in a form more counter-intuitive than the theory usually advertises. By 2026, with some £47 billion already spent, the National Audit Office found that the benefit–cost ratio for completing the programme had risen to a range of 1.5 to 6.4 even as the programme grew more expensive — because the estimated cost of cancelling it had more than quadrupled, to a figure comparable with the cost of finishing, and that avoided cost is subtracted from the remaining bill. This is escalation of commitment rendered as arithmetic: once enough is sunk, the books can show that continuing is “value for money” precisely because so much would be forfeit by stopping. The decision to proceed, the auditor records, rested on advice that the ratio merely exceeded 1.5 rather than on the full range. It is worth adding that the independent scrutiny the programme now receives — mega-project assurance panels, a central decision panel — was largely imported after that lock-in rather than before it. The outside view was not so much refused as deferred until it could no longer change the answer. For ALTO the lesson is about sequence: the cheapest moment to apply the test is now, before the commitment that will later make the same test read the other way.

    9 · The Alibi

    Bias as root cause, complexity as alibi

    The framework’s most important claim is that bias is the root cause of overrun, while scope changes, geology, weather, and complexity are merely proximate causes — the visible forms through which the underlying underestimation manifests. Behavioural science, in Flyvbjerg’s summary, tells the planner: your biggest risk is you. The Shield was always there to be reckoned with; the expropriation friction and the input-cost inflation were always foreseeable as a class. What is typically missing is not information about them but an honest reckoning with them at the planning stage.

    This pre-empts the alibi ALTO can be expected to offer when overruns arrive — that they were caused by unforeseeable geological, legal, or market conditions. On the framework’s account these are not exogenous shocks but the predicted shape of upstream underestimation: the causal chain runs from bias, to underestimation of scope during planning, to unaccounted-for scope changes during delivery, to overrun. This is also why two of the Initiative’s instruments are the most Flyvbjergian in its arsenal. An engineering-complexity scorecard and a community-friction index are attempts to quantify, in advance, the magnitude of precisely what the inside view suppresses — to put a number on the complexity and social resistance that will later be offered as an excuse, while that number can still discipline the decision. That is the de-biasing operation the framework prescribes.

    High Speed Two supplies an unusually candid illustration of the root-versus-proximate distinction — from the proponent’s own hand. Asked to account for the doubling of costs, the programme’s delivery body attributed the increase not principally to external shocks but to its own estimates: roughly a third to underestimation, a further quarter to inefficient delivery, and a further tenth to scope change, with inflation making up the balance. Its working definition of scope change is the decisive tell — “the addition of necessary works that were missed from the original scope.” That is not an exogenous event befalling the plan; it is the plan’s original incompleteness surfacing during delivery, which is exactly the causal order the framework asserts. When even the builder’s own decomposition places underestimation ahead of every other single non-inflationary factor, the alibi of unforeseeable complexity is hard to sustain.

    10 · The Discipline

    A caution, in the service of rigour

    One critical qualification protects the credibility of the entire exercise. The vocabulary of bias has a self-sealing tendency that the framework only half-acknowledges. Symmetric error can be relabelled noise; directional error, bias or lying; almost any outcome can be folded back into the scheme after the fact. Gerd Gigerenzer has pressed this point as a “bias bias,” and even sympathetic practitioners concede it is often impossible to identify which specific bias is operating or to exclude alternative explanations. Wielded loosely, the bias lexicon becomes unfalsifiable and reads as motive-imputation dressed up as analysis — which is the fastest route by which a non-partisan initiative is recast as a partisan one.

    ⚠ What keeps the analysis honest

    Rest the weight on the parts that are empirical and falsifiable — the reference-class comparison, the directional signature, the base-rate correction — and treat the attribution of deliberate deception as an inference the reader is invited to draw from structure, never as a claim asserted about named persons. That line is not merely ethical caution. It is, conveniently, the same line that separates an argument which survives hostile scrutiny from one that does not.

    11 · The Diagnosis

    Conclusion

    Read through Flyvbjerg, the scattered disputes over ALTO’s individual figures resolve into a single diagnosis.

    The structural profile

    ALTO’s profile — a Crown corporation, ministerial sponsorship, competition for scarce capital — places it where strategic distortion is predicted to dominate, with optimism layered on top.

    The directional signature

    Its forecasts display the one-directional error — costs under, benefits over — that distinguishes such distortion from innocent error, stable across decades and continents.

    Survival is a signal

    Its survival of the approval process is itself a mark of selection pressure that rewards optimism rather than a warrant of soundness.

    Complexity is not an alibi

    The geological and social difficulties it will later cite are the anticipated form of an underestimation already present in the plan — not exogenous shocks.

    None of this requires, or asserts, a claim about anyone’s honesty.

    What follows

    A relocation of the burden of proof

    What the framework asserts is a relocation of the burden of proof. The proponent’s inside-view estimates carry a known, measurable, directional bias; the outside view is the established corrective; and the appropriate demand is therefore that the decision be tested against the base rate before lock-in forecloses the test. That demand is the whole of this paper’s recommendation. What ought to be built instead, and on what evidence, is a separate question, reserved for other work of the Initiative.

    Works Cited

    Sources

    1.
    Flyvbjerg, Bent. “What You Should Know about Megaprojects and Why: An Overview.” Project Management Journal 45, no. 2 (2014): 6–19.
    2.
    Flyvbjerg, Bent. “Top-Ten Behavioral Biases in Project Management: An Overview.” Project Management Journal 52, no. 6 (2021): 531–546.
    3.
    Flyvbjerg, Bent, Mette K. Skamris Holm, and Søren L. Buhl. “Underestimating Costs in Public Works Projects: Error or Lie?” Journal of the American Planning Association 68, no. 3 (2002): 279–295.
    4.
    Flyvbjerg, Bent. “Design by Deception: The Politics of Megaproject Approval.” Harvard Design Magazine, no. 22 (2005): 50–59.
    5.
    Flyvbjerg, Bent, Mette K. Skamris Holm, and Søren L. Buhl. “How (In)accurate Are Demand Forecasts in Public Works Projects? The Case of Transportation.” Journal of the American Planning Association 71, no. 2 (2005): 131–146.
    6.
    Flyvbjerg, Bent, Nils Bruzelius, and Werner Rothengatter. Megaprojects and Risk: An Anatomy of Ambition. Cambridge: Cambridge University Press, 2003.
    7.
    Flyvbjerg, Bent, and Dirk W. Bester. “The Cost-Benefit Fallacy: Why Cost-Benefit Analysis Is Broken and How to Fix It.” Journal of Benefit-Cost Analysis 12, no. 3 (2021): 395–419.
    8.
    Flyvbjerg, Bent. “Survival of the Unfittest: Why the Worst Infrastructure Gets Built — and What We Can Do about It.” Oxford Review of Economic Policy 25, no. 3 (2009): 344–367.
    9.
    Flyvbjerg, Bent. Rationality and Power: Democracy in Practice. Chicago: University of Chicago Press, 1998.
    10.
    Flyvbjerg, Bent. “Quality Control and Due Diligence in Project Management: Getting Decisions Right by Taking the Outside View.” International Journal of Project Management 31, no. 5 (2013): 760–774.
    11.
    Flyvbjerg, Bent. “From Nobel Prize to Project Management: Getting Risks Right.” Project Management Journal 37, no. 3 (2006): 5–15.
    12.
    Kahneman, Daniel. Thinking, Fast and Slow. New York: Farrar, Straus and Giroux, 2011.
    13.
    Wachs, Martin. “The Past, Present, and Future of Professional Ethics in Planning.” In Policy, Planning, and People, edited by Naomi Carmon and Susan S. Fainstein, 101–119. Philadelphia: University of Pennsylvania Press, 2013.
    14.
    Gigerenzer, Gerd. “The Bias Bias in Behavioral Economics.” Review of Behavioral Economics 5 (2018): 303–336.
    15.
    National Audit Office. High Speed Two reset. Report by the Comptroller and Auditor General, Session 2026-27, HC 52. London: National Audit Office, June 2026.
    16.
    Aviseo Consulting. An Overview of the Structural Economic Impacts of Alto: Computable General Equilibrium Modelling Approach to Assessing High-Speed Rail in the Toronto–Québec City Corridor. Prepared for Alto. June 2026.
    17.
    CPCS, in association with HDR. Tourism in the Alto Corridor: Current Conditions and Potential Impacts. Prepared for Alto. June 2026.
    18.
    Alto (VIA HFR – VIA TGF Inc.). Advance Contract Award Notice PAS240625-002-00 (project management and control expertise; pre-identified supplier Oxford Global Projects UK Limited). 2024.
    19.
    Alto (VIA HFR – VIA TGF Inc.). Notice of extension, Access to Information request A-2026-0004. June 2026. On file with the Initiative.
  • Freight and the Vanishing train

    The Freight Dividend and the Vanishing Train

    Alto’s own freight report builds its economic case on removing passenger trains from the shared Toronto–Montreal corridor — the same line VIA Rail runs through Eastern Ontario.

    ⚠ Companion to “VIA Rail on the Kingston Subdivision”

    In April 2026 we set out how Alto would foreseeably erode intercity passenger service on the Kingston Subdivision. Alto’s own June 2026 freight report now supplies the missing piece from the proponent’s side: a business case in which that erosion is not a risk to be managed but a source of value to be captured. Read the April brief →

    The finding in brief

    In June 2026 Alto published a report, High-Speed Rail and Freight Capacity (CPCS in association with HDR), whose central benefit is the capacity freed by lowering the number of passenger trains on the shared CN corridor between Toronto and Montreal — the Kingston Subdivision that carries VIA Rail through Oshawa, Cobourg, Belleville, Kingston, Brockville and Cornwall.

    The benefit grows as passenger service shrinks. In the report’s own words it “would be shared between passenger and freight, depending on the level of passenger rail services that may be maintained on the CN corridor.” The party positioned to decide how much survives is Alto’s own development partner, the Cadence consortium — also slated to operate the corridor’s existing passenger trains. The risk falls squarely on VIA Rail.

    The report is right about one thing: separating passenger and freight traffic relieves both. But Alto achieves that separation by removing the passengers. A dedicated passenger spine along the same corridor achieves the same separation while keeping the lakeshore served — the constructive alternative set out below.

    ↓ Download the full brief (PDF)

    The Freight Report

    What the report claims

    The report’s stated purpose is to show how Alto could “generate economic and strategic benefits for freight rail by lowering passenger traffic on the shared corridor.” It documents that the Toronto–Montreal segment runs on CN-owned track with a passenger-to-freight mix close to 50-50, and that passenger trains — because of higher speeds and precise scheduling — consume more track capacity than freight trains.

    From this it assembles a set of claimed freight benefits: deferred or avoided capital investment in the CN corridor; headroom to “protect for” 55 per cent higher freight volumes over 30 years; induced freight demand and mode shift; new rail-adjacent industrial development; and roughly $90 million a year in avoided societal costs from shifting one daily intermodal train off Highway 401. Every one of these flows from the same source: fewer passenger trains on the shared line.

    The Mechanism

    The benefit is the removal of passenger trains

    The report is explicit that the enabling condition is fewer passenger trains, and it ties the size of the avoided-investment benefit directly to how much passenger service is cut: the benefit “would be shared between passenger and freight, depending on the level of passenger rail services that may be maintained on the CN corridor.” Read plainly, the fewer passenger paths retained on the Kingston Subdivision, the larger the freight benefit Alto can claim.

    The report then treats the retreat of passenger rail as an inducement to development, suggesting that reducing the volume of passenger trains may signal to industry that rail-adjacent parcels have become more desirable. Yet the same report opens with a disclaimer that its introduction is “not assumed to result in the discontinuation of local passenger rail services.” These two positions cannot both hold at full strength: the benefit is defined as the capacity released by removing passenger trains, while the disclaimer promises they will not be removed. The gap is bridged only by soft language — and by recasting intercity trains as “local offerings” that feed the high-speed line.

    Who Benefits, and How

    Who gains from fewer VIA trains

    Freight does gain — that much is the report’s central claim: CN, the freight railway, avoids the spending it would otherwise need to expand its own line. But CN does not decide how much VIA service survives, and it is not the only party that gains. The consortium positioned to make that decision, Cadence, runs no freight and earns nothing from it — its stake is in Alto. So the pressure to thin VIA’s service comes not from freight alone, but from four further interests the report’s framing keeps in the background.

    Alto’s ridership depends on it

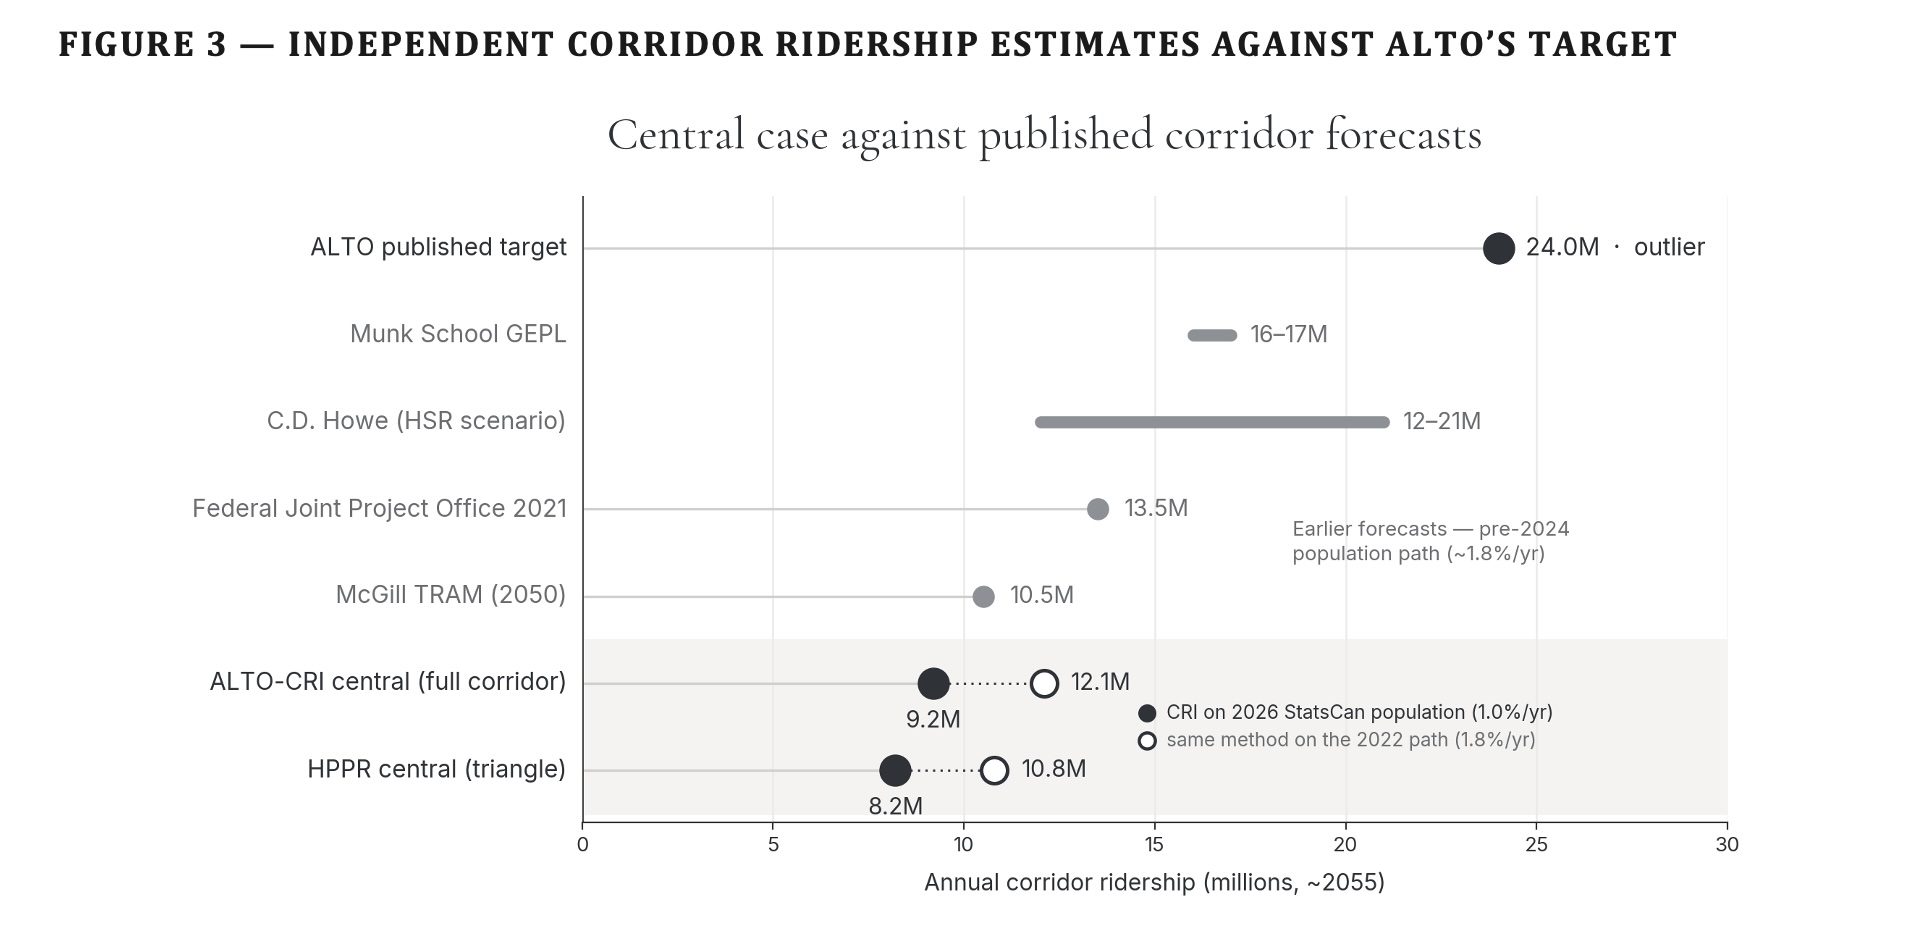
    Cadence is paid to fill Alto, whose business case rests on very high ridership: a target of 24 million passengers a year by 2055 — roughly eight times the three million or so the corridor carries today. The only independent modelling of the route (University of Toronto’s Munk School) projects about 9 to 10 million, and a reference-class adjustment for the ~65 per cent overstatement typical of rail forecasts lands near 8 million. As a single concessionaire with no open-access competition, Cadence has every reason to price for yield, not volume — making a cheaper conventional train on the same corridor competition to be minimized, not preserved.

    It makes the case for building Alto look better

    The report’s headline “avoided investment” benefit is explicitly larger the more passenger service is cut, inflating the benefit-cost ratio used to justify the project — the very project that gives the consortium’s contract its reason to exist.

    It lowers the subsidy the government pays

    VIA Rail’s Toronto–Montreal corridor service ran an operating shortfall of about $117 million in 2025 — roughly $50 of public subsidy per passenger, at a corridor cost-recovery ratio near two-thirds (VIA Rail, 2025 Annual Report). Shrinking that service, or folding it into the Alto concession, reduces what the federal funder pays; the party deciding the corridor’s future is also the party writing that cheque.

    It sheds the cost of using CN’s track

    Passenger trains on the Kingston Subdivision run on CN-owned track under access and cost-sharing arrangements — including, as the report notes, payments to CN to maintain track at passenger speeds. Moving intercity trains onto Alto’s dedicated line sheds those payments.

    The gains flow to Cadence, to CN, and to the federal treasury. VIA Rail — and the passengers between Toronto and Montreal — bear the loss.

    The Consequence

    The risk to VIA Rail

    What Alto describes is two passenger railways on one corridor. A dedicated high-speed line, built and operated by Cadence, would carry the fast intercity market. What remains on the Kingston Subdivision — the trains that serve Oshawa through Cornwall — is left as a residual “local” service, running between freight trains on CN-owned track, with no committed frequency and no protected floor.

    Under the project’s public-private structure, even that residual service is not assured to remain with VIA Rail: the existing corridor passenger operations, designated the “Local Services” in the procurement, are slated to pass to the same Cadence consortium as feeders to the high-speed line. And this is not a distant hypothetical. VIA Rail’s corridor on-time performance has already collapsed — from 72 per cent to 30 per cent inside a single year — as passenger trains are squeezed on infrastructure the operator does not own.

    The National Dimension

    The risk reaches the whole network

    The danger does not stop at the lakeshore. The Quebec City–Windsor corridor is not merely VIA Rail’s busiest route — it is the financial engine of the entire national network. More than 90 per cent of VIA’s passengers, and about 80 per cent of its revenue, come from this one corridor (VIA Rail, 2025 Annual Report). That revenue is what helps sustain the long-distance and regional trains connecting the rest of the country — Vancouver and Prince Rupert, the Prairies, Churchill, and the Maritimes.

    Hand the corridor’s ridership and revenue to a private consortium, and VIA is left, in the words of the federal NDP transport critic Taylor Bachrach, with “the crumbs” — a fraction of the revenue it uses to operate rail across Canada. Alto’s own answer is that corridor services will “eventually” be “integrated with Alto services into a single network”; asked what the loss of that revenue would mean for VIA, the proponent did not say. The choice being made on the busiest corridor, in other words, quietly decides the future of passenger trains in places thousands of kilometres away. CBC News reported the warning.

    A Constructive Alternative

    A straighter, quieter line

    The freight report identifies a real prize: separating passenger and freight traffic on the Toronto–Montreal corridor relieves the mixed-traffic conflict that degrades both. The question is how that separation is achieved. Alto achieves it by removing the passengers — routing a 300 km/h greenfield line inland through Peterborough and Ottawa, past the lakeshore communities entirely, and leaving VIA’s corridor service to wither.

    There is a straighter, quieter way to reach the same result. Build a dedicated, lower-speed passenger spine along the existing Toronto–Montreal transportation corridor — the lakeshore route the CN Kingston Subdivision and Highway 401 already follow. Give passengers their own tracks, engineered for reliable service at conventional-to-higher-performance speeds (up to about 200 km/h), and the passenger–freight conflict is resolved the same way — by separation — but without deleting the service the corridor’s communities depend on. The strong Toronto–Montreal market runs fast and reliably on the direct line; Ottawa and Quebec City are reached on upgraded existing track; and Kingston, Cobourg, Belleville, Brockville and Cornwall stay on the intercity network rather than being bypassed. The routing and demand-density case for this spine is set out in our companion brief, A Straighter Line. And because the spine stays in public hands, the fare revenue from the country’s busiest corridor keeps flowing to VIA rather than to a private concession — sustaining, rather than starving, the national network it helps fund.

    Alto as plannedA dedicated passenger spine
    A 300 km/h greenfield line detouring inland via Peterborough and Ottawa, roughly 900 km of all-new track.A direct passenger line along the existing lakeshore corridor, far less new build, largely alongside the rail line and Highway 401 already there.
    Cobourg, Belleville, Kingston, Brockville and Cornwall are bypassed entirely.The lakeshore communities stay on the intercity network, served on the way through.
    Today’s VIA corridor service is demoted to a residual “Local Service,” slated to the private concession, with no protected floor.The corridor service is the spine — upgraded, reliable, and kept in the public interest.
    Freight relief is delivered by removing passenger trains from the shared line.Freight relief is delivered by giving passengers their own dedicated line within the existing corridor.
    Operated by a single private consortium pricing for premium yield, with a $60–90 billion cost baseline.Operated in the public interest at affordable conventional fares, at a fraction of the greenfield cost.
    Corridor fare revenue flows to the private concession, weakening the cross-subsidy that helps fund VIA’s national network.Corridor revenue stays in the public system, where it can keep supporting long-distance and regional service across Canada.
    In plain language

    The freight report is right that passengers and freight should not have to fight over the same tracks. But there are two ways to end that fight: take the passengers away, or give them their own line. Alto takes them away — and prices the loss as a benefit.

    The alternative keeps the trains and separates the traffic: a dedicated passenger spine down the existing Toronto–Montreal corridor, reliable and affordable, serving the lakeshore towns Alto would leave behind. It delivers the genuine freight dividend the report identifies — without the vanishing train.

    Sources

    Primary sources

    1
    High-Speed Rail and Freight Capacity: Potential Freight Benefits of Alto (June 2026). Prepared for Alto by CPCS in association with HDR. Cited pages: 5, 6, 8, 11, 18, 19. Read the report.
    2
    VIA Rail on the Kingston Subdivision: Service Erosion, Funding Collapse, and the National Rail Risk from ALTO HSR (April 2026). ALTO HSR Citizen Research Initiative. Read the brief.
    3
    VIA Rail Canada, 2025 Annual Report — Toronto–Montreal corridor operating shortfall of roughly $117 million, per-passenger subsidy of about $50, and corridor cost recovery near two-thirds.
    4
    On the ridership targets: this Initiative’s ridership analysis, setting Alto’s stated 24 million (2055) and 43 million (2084) figures against the corridor’s current ridership of roughly three million; the University of Toronto Munk School (Global Economic Policy Lab) independent projection of about 9 to 10 million; and the reference-class forecasting literature (Flyvbjerg) finding rail ridership overstated by an average of 65 per cent.
    5
    On the operating model and the transfer of corridor “Local Services” to the private consortium: Government of Canada, “Canada is getting high-speed rail” (news release, 19 February 2025); Transport Action Canada, “Cadence wins $3.9B High-Speed Rail development contract” (2025).
    6
    On the national-network risk: A. Kurjata, “NDP warns privatizing high-speed rail from Toronto to Quebec could kill passenger trains in rest of Canada,” CBC News (19 February 2025) — corridor revenue as roughly 80 per cent of VIA’s total; MP Taylor Bachrach’s warning on cross-subsidy of national service.
    7
    A Straighter Line (June 2026). ALTO HSR Citizen Research Initiative — routing and reference-class demand-density analysis for the dedicated passenger spine.
  • Sign first, see later

    Sign First, See Later

    A confidentiality precondition runs through ALTO’s field studies and corridor maps — for municipalities and for Indigenous rightsholders alike.

    The finding in brief

    Two of ALTO’s own June 2026 reports, read together, reveal a pattern. To let ALTO’s crews onto its land for field studies, the United Counties of Stormont, Dundas and Glengarry would first have had to sign a non-disclosure agreement; they declined. And to see the early corridor maps for their own territories, Indigenous communities were asked to sign a collaboration or confidentiality agreement first.

    In both cases the information came with the same condition attached: silence. This is a question of public trust, not of whether the trains are a good idea.

    “The most basic question — where might the line go? — was answered only after a confidentiality agreement was signed.”
    — the pattern across ALTO’s own June 2026 reports
    The Evidence

    What the documents show

    The pattern is set out not in commentary but in ALTO’s own records and a municipal council package — the same condition appearing in two separate processes, applied to two different kinds of party.

    The municipal case The rightsholder case
    Set out in the United Counties of SDG’s June 15, 2026 council package. ALTO sought a Permission to Enter agreement for environmental field study and geotechnical work — boreholes, test pits, and tree clearing — on county-owned parcels, with the Counties required to sign a non-disclosure agreement as a condition of access. Council declined the request. Set out in ALTO’s Indigenous Consultation What We Heard Report. Initial corridor maps, prepared in November 2025, were shared only with communities that had signed a collaboration agreement or a non-disclosure agreement. For the others, ALTO worked to secure non-disclosure agreements to share maps as early as possible (p. 14). A community could not see the corridor maps for its own territory until it accepted a confidentiality undertaking. View ALTO’s report

    A confidentiality clause is ordinary between two private companies. It is a different matter when the other party is a public body, or an Indigenous community being consulted about its rights.

    The Municipal Case

    What was actually requested

    ALTO sought a “Permission to Enter” (PTE) agreement covering two kinds of work. The first is environmental field study — wetland and habitat assessment, wildlife and bird surveys, and the collection of noise, vibration, hydrology, soil and archaeological data, described as largely non-invasive. The second is geotechnical investigation: boreholes, test pits and other ground disturbance to characterise what lies beneath the surface. The County’s own report notes that this second category would require clearing trees to bring in heavy equipment, with the land to be “restored” afterward.

    The agreement also runs in favour of the private developer consortium, Cadence, not only the Crown corporation — so a landowner’s signature binds them to both. And it requires the landowner to keep the arrangement confidential.

    The request and its supporting materials are on the public record in the United Counties’ June 15, 2026 council package: the CAO Key Information Report, the ALTO presentation of May 5, 2026, and the Map of Impacted SDG Properties.

    “It tells you nothing about the route”

    ALTO’s presentation states, more than once, that a Permission to Enter does not indicate the final alignment and is not proof that a property sits on the route. Yet the same council package includes a map that identifies specific “Subject Lands,” and the geotechnical work is targeted at named parcels. You do not drill boreholes everywhere; you drill where you expect to build.

    On the public record

    In March 2026 the Mayor of North Glengarry said the alignment had shifted from the existing rail line through town to the township’s “far northeast corner” — the area, next to Highway 417, where the identified study parcels sit. The claim that the studies reveal nothing about the route, and the targeted footprint of the work, do not sit easily together.

    “A municipality holds and shares information on behalf of its residents. A non-disclosure agreement is the one condition it cannot quietly accept.”
    — the transparency question the request puts to a public body
    The Analysis

    A pattern, not an exception

    A municipality holds and shares information on behalf of its residents; an Indigenous community is being consulted toward its free, prior and informed consent. In both settings, the value of the process depends on people being able to know — and to discuss — what is proposed for their land. A precondition of silence cuts against that.

    What makes this a pattern rather than a one-off is that the same condition appears in two separate processes, applied to two different kinds of party, documented in the same set of reports. It is part of how the project is being run.

    Why confidentiality changes the calculus

    A public body that signs a non-disclosure agreement narrows what it can tell residents about studies on public land, and narrows what is reachable under freedom-of-information law. A rightsholder asked to sign before seeing a map is asked to accept a constraint before it has the information needed to weigh the project. Informed consent and an informed public both depend on having the information first.

    Consent and Transparency

    The tension the precondition creates

    ALTO states that it consults Indigenous communities with the aim of securing their free, prior and informed consent. Consent is harder to call fully informed when the information is released only after a confidentiality agreement, and harder to call fully free when seeing the map requires signing first. None of this is to say that any community objected to the agreements — the report does not say so, and this brief does not speak for any community. The observation is narrower, and is about ALTO’s process: the condition it attaches to its own information.

    For municipalities, the duty runs the other way — toward openness. Ontario’s freedom-of-information regime exists precisely so residents can learn what public bodies know. An access agreement that forecloses disclosure sits in tension with that duty, which is part of why the United Counties declined.

    The Decision

    What the municipalities decided

    The refusals were not isolated. The body that owns the land said no; the host township and a regional caucus were already on record against the project; and a neighbouring county refused the very same non-disclosure agreement.

    United Counties of SDG — the landowner

    The Counties, which own the land, voted down the access request (By-Law No. 5538). Councillors pointed to the impact on agriculture and were wary that granting access would itself be read as support for the project.

    North Glengarry — the host township

    The township where the parcels sit had already endorsed the regional resolution opposing the project in its current form, and its mayor and council have continued to speak against it.

    Prescott-Russell — the neighbour

    On May 27, 2026 the neighbouring United Counties of Prescott and Russell unanimously refused to sign a non-disclosure agreement and declined access for surveys, with the warden framing it as a stand for transparency and local autonomy. Council minutes

    Eastern Ontario Wardens’ Caucus

    The regional caucus opposes the project in its current form — the resolution North Glengarry endorsed in April 2026.

    What To Watch

    What happens next

    The field studies are active and, by ALTO’s own account, will continue through 2026 and beyond. The southern route now under study — through Kingston and the Frontenac Arch — will not reach public consultation until 2027. Access to the ground, and the agreements that come with it, can arrive well before the public conversation does.

    The next test is a willing host. Kingston has asked for a station and wants its staff to work directly with ALTO. A municipality that wants the outcome may accept terms a reluctant one refused. Whether the confidentiality precondition travels south, and whether it has already been signed anywhere, can be tested directly: through freedom-of-information requests to the municipalities along the route.

    Anticipated Objection

    “Isn’t this just opposition to high-speed rail dressed up as a complaint about process?”

    No. The concern is the terms on offer, not the existence of a railway. The refusing councils have not asked for no rail; they have asked that the project coordinate with existing passenger service and existing corridors, and that decisions be made in the open. The question is not whether ALTO may protect commercially sensitive information — firms do that routinely.

    It is whether the public’s information about a public project, on public land and on the territories of rightsholders, should be available only to those who first agree not to share it. Better passenger rail and an open process are not in conflict.

    The bottom line

    The question is not whether ALTO may protect commercially sensitive information — firms do that routinely. It is whether the public’s information about a public project, on public land and on the territories of rightsholders, should be available only to those who first agree not to share it.

    A reasonable standard would be simple: the corridor maps, field-study scopes, and access terms that affect a community should be available to that community without a confidentiality precondition. Better passenger rail and an open process are not in conflict.

    Read the full brief offline or share it.

    Download the brief (PDF)

    Sources

    Primary documents and statements

    1.

    ALTO, Indigenous Consultation What We Heard Report (June 2026), incl. p. 14 — initial corridor maps shared only with communities that had signed a collaboration or non-disclosure agreement; ALTO describes the agreements as a means of sharing maps as early as possible. altotrain.ca
    2.

    ALTO, Public Consultation What We Heard Report (June 2026).
    3.

    United Counties of SDG council package, June 15, 2026 — CAO Key Information Report; ALTO presentation, May 5, 2026; Map of Impacted SDG Properties; and By-Law No. 5538.
    4.

    The SDG access vote and councillor statements as reported by the Morrisburg Leader, June 18, 2026.
    5.

    North Glengarry’s April 13, 2026 endorsement of the regional (EOWC) resolution, and its mayor’s continued public opposition — The Review, April 16, 2026, and Cornwall Seaway News.
    6.

    United Counties of Prescott and Russell, Regular Council Meeting, May 27, 2026 — council declined to sign a non-disclosure agreement and refused access for surveys. Meeting agendas and minutes
    7.

    Transport Canada announcement, Kingston, June 22, 2026.
  • A straighter line

    A Straighter Line

    Three ways to connect the same cities — and what the government’s own yardstick says about each.

    ⚠ Companion to “Sixth in North America”

    The 2020 ministerial briefing released under A-2022-005 contains two yardsticks the federal government chose for itself: slide 2.5, a checklist of where high-speed rail works best, and slide 2.6, a benchmark table of selected HSR systems. This brief runs ALTO’s eight proposed stations through both — then tests two other ways of connecting the same anchor cities. Read the companion brief →

    The finding in brief

    On the government’s own benchmark, ALTO as planned is the longest corridor and the least demand-dense of any system in the briefing — about 14,600 people per kilometre of new track, below every benchmarked line that reports a population.

    Straightening the Toronto–Montreal spine helps only a little. The real lever is dropping the two stations that sit on no existing line, and reaching Ottawa and Quebec City on upgraded track rather than new build. Do that and the new build falls to a 540 km High Performance Passenger Rail (HPPR) spine — about 40 per cent less new track than ALTO — while demand density on new build climbs by roughly two-thirds, to mid-pack above Spain, without losing a single anchor city.

    The Yardsticks

    Two tests, chosen by the government

    Slide 2.5 lists what makes high-speed rail work: large metropolitan populations, strong local transit, an optimal corridor length between economic centres, and dense city pairs.

    Ministerial briefing slide 2.5, Success Factors: Where HSR Works Best, listing strong transit connections, optimal corridor length, and city-pair criteria including metropolitan population, GDP, density and collaborating economic sectors
    Slide 2.5, “Success Factors: Where HSR Works Best.” Page 154 of the Canada Infrastructure Bank release, A-2022-005 (disclosed in part; marked DRAFT) — the federal checklist of where high-speed rail succeeds.

    Slide 2.6 then benchmarks selected systems on capital cost, length, and the combined population they serve. Together the two let us score any route on the government’s own criteria — not ours.

    Ministerial briefing slide 2.6, Selected HSR Systems: Key Metrics, a table of capital cost, cost per track-kilometre, population served, GDP and total length for seven HSR systems including France, Spain, the UK, Japan, Taiwan, California and Texas
    Slide 2.6, “Selected HSR Systems: Key Metrics,” from the same release (A-2022-005, disclosed in part; marked DRAFT) — the benchmark systems against which the corridor is measured below.

    Run ALTO’s eight stations through slide 2.5 and they sort cleanly into three tiers:

    Anchors — pass outright

    Toronto, Montreal, Ottawa, Quebec City: large metros with real or near-real rapid transit, at HSR-friendly distances. These are the cities the corridor exists to connect.

    Good intermediate — earns its place

    Kingston: small, but it sits on the direct Toronto–Montreal path, so it adds riders without adding distance. The methodology rewards exactly this.

    Weak — cost without a base

    Peterborough and Trois-Rivières are small and sit on no existing passenger line; reaching either means building all-new track. Laval is redundant — it is inside the Montréal CMA.

    The Ladder

    Three ways to connect the same anchors

    Hold the four anchor cities constant and change only how they are linked. Option ① is ALTO as planned. Options ② and ③ are the High Performance Rail (HPR) alternative: a new-build HPPR spine — the High Performance Passenger Rail line — on the direct Toronto–Montreal lakeshore, plus upgraded existing track for the secondary connections. ② keeps all eight stations, reaching Ottawa on the existing line and the small cities by new spur; ③ keeps Kingston on the spine, reaches Ottawa and Quebec City on upgraded existing lines, and drops the two off-corridor cities.

    Metric① ALTO as planned② Direct HPPR spine + spurs (keep all 8)③ Direct HPPR spine + Ottawa link (drop 2)
    Stations886
    Toronto–Montreal routing~650 km (detour via Peterborough/Ottawa)~540 km direct lakeshore (HPPR spine)~540 km direct lakeshore (HPPR spine)
    Ottawa connectionon the new mainlineupgraded existing (Smiths Falls–Brockville)upgraded existing (Smiths Falls–Brockville)
    Montreal–Quebec City legnew build (north shore, via Trois-Rivières)new build (north shore, via Trois-Rivières)upgraded existing (south-shore VIA line)
    New-build track~910 km~850 km~540 km
    Upgraded existing track~80 km~350 km
    People served~13.3 M~13.3 M~13.0 M
    Demand density, new-build track~14,600 / km~15,600 / km~24,100 / km
    Position on the slide 2.6 benchmarklastbelow Spainmid-pack (above Spain)
    Off-corridor cities needing new trackPeterborough, Trois-RivièresPeterborough, Trois-Rivièresnone

    The Montreal–Quebec City leg is the pivot between ② and ③: ② builds it as new north-shore track to keep Trois-Rivières on the line, while ③ drops Trois-Rivières and serves Quebec City on the existing south-shore line, upgraded — about 260 km of the gap in new build between the two. In both ② and ③ the Ottawa connection is upgraded existing track (VIA’s Smiths Falls–Brockville line), not new build. Distances are approximate planning-level estimates; full workings with live formulas are in the reference-class workbook.

    What the Numbers Say

    Reading the ladder

    ① ALTO is the longest, least-dense option

    At roughly 14,600 people per kilometre of new track, ALTO sits below every system on slide 2.6 that reports a population — the most track for the least demand per kilometre.

    ② Straightening the spine helps only a little

    Keep all eight cities but run Toronto–Montreal direct on the HPPR spine and reach Ottawa on the existing line: new build falls to ~850 km (from ALTO’s ~910) and density edges up to ~15,600 per kilometre. Better — but still near the bottom of the benchmark, because it keeps building new track for Peterborough and the north-shore line to Trois-Rivières. The off-corridor cities, not the spine, are what hold it down.

    ③ Dropping the two off-corridor cities is the lever

    Removing Peterborough and Trois-Rivières — and reaching Ottawa and Quebec City on upgraded existing track — cuts new build to just the 540 km HPPR spine, about 40 per cent less than ALTO, while losing fewer than 0.3 million people. Most of the saving is the Quebec leg: with Trois-Rivières gone, Montreal–Quebec reverts from ~260 km of new north-shore track to the existing south-shore line, upgraded. Demand density on new build climbs from ~14,600 to ~24,100 per kilometre — from worst on the benchmark to mid-pack, above Spain. The route gets stronger by building less, because the dropped legs were costing more length than they were adding demand.

    The Kingston Test

    Same city, opposite effect

    Kingston is the cleanest illustration, because every option serves it. On the direct line it sits on the shortest Toronto–Montreal path, so it adds riders at almost no added distance — density goes up. On ALTO, reaching the same city means a southern dogleg off the northern route — the same population bought with extra kilometres, so density goes down. One stop, two outcomes, set entirely by the alignment rather than the city. Keeping Kingston while dropping Peterborough is precisely the discrimination the federal criteria imply: reward the intermediate that sits on the path, decline the one that pulls the line off it.

    In plain language

    The problem was never which cities to serve. It is the line drawn to reach them. Run the strong Toronto–Montreal market on the direct lakeshore route, branch to Ottawa, serve Quebec City on the line that already exists, and keep Kingston where it naturally sits — and the corridor moves from worst on the government’s own benchmark to the middle of the pack, on far less new track.

    The two stations that drag it down, Peterborough and Trois-Rivières, are the two that sit on no existing line and would each need new track built to reach them. Serving them may be a worthy regional goal — but it should be argued and costed as that, openly, not folded into a national corridor whose headline case rests on Toronto–Montreal.

    Method

    How this was scored

    “People served” is the combined metropolitan population of the named cities — a scale proxy, not modelled ridership, and the same crude basis slide 2.6 uses. Demand density is people per kilometre of new-build track. The alternative configurations are High Performance Rail (HPR): a new-build HPPR spine on the direct Toronto–Montreal lakeshore, plus upgraded existing lines for the Ottawa connection (VIA’s Smiths Falls–Brockville route) and, in ③, the Montreal–Quebec leg. ALTO and both alternatives are high-performance (≤200 km/h), not the 300 km/h HSR of the slide 2.6 benchmark systems, so the density comparison is conservative. Distances are approximate planning-level estimates and should be checked against ALTO’s published alignment before any figure is cited. Populations are 2021 StatCan census-metropolitan-area figures; slide 2.6 is on a 2016 basis. Trois-Rivières has had no passenger rail since 1990 and is not on VIA’s south-shore Montréal–Québec line, so serving it requires all-new track. Full workings, with live formulas, are in the reference-class workbook.

  • Sixth in NA

    Sixth in North America

    What the ranking actually measures — and the route it does not describe.

    ⚠ Source: Disclosed under the Access to Information Act

    The slide below is page 206 of a 294-page record released by the Canada Infrastructure Bank under access request A-2022-005 — a request for all studies, analyses, and reports related to the federal government’s high-frequency and high-speed rail file, disclosed in part. The briefing deck it belongs to is stamped “Privileged and Confidential — Do Not Share and/or Copy,” and its own footer marks it “DRAFT.” Adjacent pages were withheld under the Act’s economic-interest and advice exemptions (s. 18 and s. 21). The deck, as disclosed, is posted in full here: Ministerial Briefing — HFR and HSR (PDF).

    The marking is part of the point: this is a draft analysis the department preferred not be seen, and it is the evidence being used to vouch for the corridor.

    Briefing slide: Success Factors, Where HSR Works Best, ranking North American city pairs by high-speed rail demand
    Section 4.2, “Success Factors: Where HSR Works Best.” Page 206 of the Canada Infrastructure Bank release, A-2022-005 (disclosed in part; marked DRAFT). The three highlighted bars are Toronto–Montreal, Toronto–Ottawa, and Montreal–Quebec City.
    The finding in brief

    The slide ranks Toronto–Montreal sixth among North American city pairs for high-speed rail demand. The ranking is real. What it measures is the market between two endpoint metros — not the route now being built.

    The number describes the direct Toronto–Montreal corridor. The alignment taking shape runs Toronto–Peterborough–Kingston–Ottawa–Montreal — a longer, meandering route. On the very methodology the slide cites, every one of those detours lowers the score rather than raising it. And the segment actually proceeding first, Ottawa–Montreal, does not appear on the chart at all.

    The Methodology

    What the ranking measures

    The “sixth in North America” figure comes from America 2050’s screen of tens of thousands of city pairs, a methodology published in full by the Regional Plan Association. It scores the market between two endpoint metros: downtown employment, population density, transit reach, and the existing air and road travel between them. On those inputs Toronto–Montreal scores well. The endpoints are large, dense, and already heavily travelled.

    Two features of that method decide everything that follows, and both are explicit in the source.

    It is calculated per mile. Adding distance without adding a major generator pulls a corridor’s score down, not up. The screen normalizes precisely so that longer routes cannot coast on length.

    Intermediate stations only help when they are themselves large. The report is clear that longer corridors out-rank shorter ones only when the cities in between are medium or large generators. Otherwise the additional miles are a penalty. The top-ranked corridor on the chart, New York–Washington, scores as it does because the dense intermediate cities of Philadelphia and Baltimore sit directly on the shortest path between the endpoints.

    The Route

    The corridor on the chart is not the corridor being built

    The favourable score belongs to the direct Toronto–Montreal market — the existing lakeshore line, the shortest path, with a dense string of intermediate communities along it. The alignment now taking shape is the opposite of that. From Toronto it runs north to Peterborough; then — assuming the Kingston stop and southern routing the federal government added to its consideration in June 2026 come to pass — it doubles back south to Kingston, climbs north again to Ottawa, and drops south once more to Montreal. The result is a corridor that zigzags between its cities rather than running directly between its endpoints.

    Map of the projected Toronto to Quebec City corridor showing the route meandering north and south between cities rather than following a direct line
    The projected Toronto–Quebec City corridor. Rather than following the direct lakeshore line, the alignment meanders — north to Peterborough, south to Kingston, north to Ottawa, south to Montreal, and on toward Quebec City.
    The direct corridor (what the bar scores)The alignment being built
    Toronto–Montreal, direct. The existing Lake Ontario lakeshore line, on the order of 540 km — the shortest path between the two endpoints. Toronto–Peterborough–Kingston–Ottawa–Montreal. Roughly 610 km via Ottawa — about 13 per cent longer for the identical endpoints, and longer still with a Kingston dogleg. (This path assumes the Kingston stop and southern routing added to federal consideration in June 2026 proceed.)
    Dense intermediate string. Oshawa, Cobourg, Belleville, Kingston — population and employment added steadily along the path. Sparse flanks, weak axis. Peterborough is small and the stretches on either side of it are thinly populated; reaching Ottawa means importing the Toronto–Ottawa axis the same chart ranks near the bottom.
    Highest possible per-mile score for these two endpoints. A lower per-mile score: more kilometres, less density per kilometre, and a low-scoring leg folded in.

    There is a particular irony in Kingston. It is the natural intermediate city on the direct corridor — precisely the stop that would have helped the Toronto–Montreal score. The chosen alignment runs north to bypass it. Now it is being considered for re-inclusion, bolted back onto a route designed to avoid it.

    On the Method’s Own Terms

    What each detour does to the score

    Re-run the published methodology on the alignment actually on the table, and the per-mile score falls below the sixth-place bar. Each of the route’s defining choices works against it:

    Length is a straight penalty

    Per-mile normalization spreads the same Toronto and Montreal endpoint demand over more kilometres. A longer, more circuitous route scores lower for the identical endpoints — that is what the normalization is designed to do.

    Peterborough adds miles faster than density

    Intermediate stops only lift the score if they add population and employment per kilometre faster than the corridor’s average. Peterborough is too small, and the stretches on either side are sparse, so it adds length faster than it adds riders — a net penalty.

    A Kingston dogleg is more of the same

    Re-adding the one city the alignment was routed to avoid means a southern detour off the northern line: a modest generator bought with extra kilometres — again, length outpacing density.

    Reaching Ottawa imports a weak leg

    Ottawa is the one genuine generator among the added stops. But reaching it is the Toronto–Ottawa axis the same chart already ranks near the bottom of its field. The detour swaps the strong direct Toronto–Montreal axis for a leg the deck itself scores as weak.

    Sequencing

    What is actually being built first

    There is a further mismatch between the headline number and the build. The first segment to proceed is not Toronto–Montreal at all — it is Ottawa–Montreal, confirmed in December 2025 as the opening phase, with construction targeted for 2029. Ottawa–Montreal does not appear anywhere on the chart.

    And by the government’s own account, it was chosen first not for demand but for buildability: a relatively short and straight portion of the overall route, since high-speed trains do not handle curves well — the same logic that led California to build its first section across the flat Central Valley, avoiding tunnelling and urban construction. A constructability rationale, not a ridership one.

    The corridor that scores sixth, Toronto–Montreal, is only realized once the full line is complete — including the Toronto–Ottawa leg that sits near the bottom of this very chart — work not expected to finish until the 2040s. So the headline ranking and the actual build diverge twice over: the number describes a market the first segment does not deliver, assembled from legs the chart scores unevenly, with the strongest part of the case deferred to last.

    In plain language

    Strip away the methodology and the point is simple. The federal government’s own briefing says high-speed rail makes the most sense between Toronto and Montreal — two large cities with heavy travel between them. It says nothing in favour of the winding route now being built.

    That route keeps collecting stops the demand evidence does not support: north to Peterborough, a proposed southern dogleg to Kingston, and Trois-Rivières on the Quebec leg. Each one adds distance and cost while the case for the line still rests on the direct Toronto–Montreal market. When stations are added that do not earn their place on the numbers, the usual explanation is political — spreading the visible benefits of a marquee project across as many communities as possible to assemble support for it.

    This is one of the central problems with the project, and it is a familiar one. Bent Flyvbjerg’s research on megaprojects — the body of work behind this Initiative’s reference-class approach — finds that large infrastructure projects routinely run over budget and under-deliver because their scope and routing are shaped by political bargaining and the need to sell the project, rather than by the demand evidence. A corridor designed around who gets a station rather than where the riders are is precisely the pattern that research warns about.

    In Summary

    What the slide does and does not say

    The “sixth in North America” finding endorses a Toronto–Montreal market. It says nothing in favour of the Peterborough-routed, Kingston-doglegged, Ottawa-and-Montreal-served alignment. On the methodology’s own terms, those inclusions are exactly the choices it would mark down.

    A strong endpoint market is a real asset. It is not the same thing as a strong route — and a briefing that uses the first to vouch for the second is measuring the wrong thing. That the slide is marked “DRAFT,” and that adjacent pages were withheld under the Act’s economic-interest and advice exemptions, only sharpens the question: this is the analysis on the record, and on its own terms it does not say what it is being used to say.

    A note on method. The deck describes its result as a “sample calculation.” The disclosed page does not show how the path was drawn or scored. The standard America 2050 methodology and the headline result both point to the direct corridor as the basis for the sixth-place figure; if the underlying calculation is obtained, the path it used is the detail to confirm.

    Anticipated Objection

    “Doesn’t the line serve all those city pairs — Toronto–Ottawa, Ottawa–Montreal, Montreal–Quebec — not just Toronto–Montreal? Combine them and the project makes sense.”

    It is true that a corridor serves a whole matrix of city pairs, not only its endpoints. But that observation concedes the point rather than answering it. The “sixth in North America” figure is the score for the direct Toronto–Montreal pair. The moment the case leans on Toronto–Ottawa, Ottawa–Quebec, and Toronto–Quebec, it is no longer resting on that figure — and those are precisely the legs the same chart rates weakest: Toronto–Ottawa sits second from the bottom, Montreal–Quebec City is last, and Ottawa–Quebec, Toronto–Quebec, and Ottawa–Montreal do not appear on it at all.

    Two things make “combine the figures” fail on the slide’s own terms. The bars are demand-strength rankings — built from population, GDP, density, and corridor length — not passenger counts that can be summed; a sixth-place pair plus a near-last pair does not add up to a stronger corridor. And because the screen normalizes per mile, stringing the one strong pair onto a longer, detouring alignment spreads the same demand across more track-kilometres, which lowers the score rather than raising it.

    The logic in fact argues for the line this brief describes. If the goal is to capture Toronto–Montreal and the markets in between, the alignment that does it best is the direct lakeshore corridor — it serves the sixth-place pair at full strength and threads a dense string of real intermediate cities (Oshawa, Cobourg, Belleville, Kingston) on the way. Adding up the pairs does not rescue the meandering route; it makes the case for the direct one.

    Sources

    Primary documents and statements

    1.
    Canada Infrastructure Bank, completed access-to-information release A-2022-005 (disclosed in part), “Success Factors: Where HSR Works Best,” draft briefing slide, page 206. Released under the Access to Information Act; deck marked “Privileged and Confidential — Do Not Share and/or Copy” and “DRAFT.” View the disclosed deck (PDF)
    2.
    America 2050 / Regional Plan Association, High-Speed Rail in America, January 2011 — the published methodology scoring rail corridors by ridership demand on a per-mile basis.
    3.
    America 2050, Where High-Speed Rail Works Best — the precursor study of city pairs that the briefing slide reproduces.
    4.
    Transport Canada / Alto, “Full speed ahead: Ottawa–Montreal chosen as starting point for Alto High-Speed Rail,” December 12, 2025. canada.ca · altotrain.ca
    5.
    “First segment of Canadian high-speed rail to be built between Montreal, Ottawa,” Trains, December 12, 2025 — carries the Minister of Transport’s rationale for selecting the segment as a short, straight portion of the route. trains.com
    6.
    “Ottawa-Montreal chosen as 1st segment of promised high-speed rail line,” CBC News, December 12, 2025 — remaining segments (Quebec City–Montreal and Ottawa–Toronto) to begin at a later, unspecified date. CBC News
    7.
    Federal government statement, June 22, 2026, indicating an additional stop at Kingston would be considered for the corridor.
    8.
    Bent Flyvbjerg, Nils Bruzelius & Werner Rothengatter, Megaprojects and Risk: An Anatomy of Ambition (Cambridge University Press, 2003); Flyvbjerg, “Survival of the Unfittest: Why the Worst Infrastructure Gets Built — and What We Can Do About It,” Oxford Review of Economic Policy 25, no. 3 (2009): 344–367; and Flyvbjerg, “Design by Deception: The Politics of Megaproject Approval,” Harvard Design Magazine no. 22 (2005) — on strategic misrepresentation, perverse incentives, and the political shaping of megaproject scope and routing.
  • By their own standard

    Research Brief · Methodology

    By Their Own Standard

    Build Canada’s case for high-speed rail, measured against the megaproject method the memo itself invokes.

    ⚠ The Document Under Review

    Build Canada’s February 24, 2025 memo, Let’s Show the World How Canada Builds, was published one week after the federal high-speed rail announcement. It endorses high-speed rail in the Toronto–Quebec City corridor and names ALTO directly, while contesting only how the project is delivered — not whether the demand exists or whether the benefit–cost case closes. This brief takes the memo’s argument on its own terms, and holds it to the analytical standard the memo itself sets. Build Canada · original memo

    Critical Finding

    The memo reaches for exactly the right tools. It quotes Bent Flyvbjerg, the leading scholar of megaproject cost overruns; it calls for reference-class benchmarking against comparable lines; it demands contingency discipline; and it warns that without these, ALTO becomes another HS2 or California High-Speed Rail. On the diagnosis, the Initiative agrees.

    The memo then abandons each principle at the moment it matters. It caps contingency at the level that, on its own logic, guarantees overrun. It imports foreign unit costs from a reference class that is not comparable. And it promises true high-speed rail at a unit cost that, in Canadian conditions, only high-performance rail can plausibly reach. Applied honestly, the memo’s own method points away from its conclusion.

    The evidence produced since the announcement confirms the diagnosis the memo made and refutes the targets it set. The corridor is still being fundamentally re-routed in the project’s second year; the friction the memo proposed to legislate away has surfaced exactly where the method predicts. The case for caution on ALTO does not require rejecting Build Canada’s framework. It requires applying it.

    The Argument’s Shape

    What the memo contests, and what it does not

    The memo’s argument has a particular structure. It accepts ALTO’s entire benefit case without examination — 40 per cent of the economy, 18 million people connected, up to $35 billion a year in added GDP, travel times halved — and contests only whether the project can be built cheaply and quickly. Every one of those headline figures is the proponent’s own number, repeated approvingly. The memo never asks whether the ridership exists to fill the trains, or whether the benefits exceed the costs.

    It asks one question: can Canada build it the way France, Spain, and Japan did? To answer, it reaches for the right instruments — Flyvbjerg’s work on megaproject overruns, reference-class benchmarking, contingency discipline, and the cautionary record of HS2 and California. That choice of tools is what makes the memo worth engaging seriously, and what makes its conclusion fail. The same tools, applied with honest inputs, do not support the case the memo builds on them.

    Held To Its Own Standard

    Three flaws, by the memo’s own method

    On three load-bearing claims, the memo prescribes the opposite of what the method it cites requires. The left column states the memo’s own prescription; the right column applies the memo’s own standard to it.

    What the memo prescribesHeld to its own standard
    1. Cap contingency, including inflation, at 10 per cent. Presented as following global best practice, alongside meticulous benchmarking against French and Japanese lines.Reference-class forecasting — the very method the memo invokes — requires a larger uplift the less design is complete, because the unknowns are still unpriced. The memo itself concedes Canadian projects sit at 1–10 per cent design maturity. At that maturity, the honest uplift is routinely 40 per cent or more; a 10 per cent cap is defensible only near design completion. The prescription specifies the precise conditions under which budgets break, and calls it discipline.
    Verdict:Self-contradictory
    2. $25–40M per km; a corridor for under $50B; payback within two years. Drawn from the cost record of France, Spain, and Japan.A reference class works only if the cases are comparable, and these are not. The cited figures come from older lines, on flatter and cheaper terrain, in earlier cost eras, with no adjustment for what this corridor crosses: the granite of the Canadian Shield, the Frontenac Arch, the wetland and karst of eastern Ontario, and dense urban approaches at both ends. Importing an unadjusted foreign unit cost is exactly the non-analogous-reference-class error Flyvbjerg’s method exists to catch — committed in the section that cites him. The Initiative’s complexity-adjusted estimate runs several times higher, with a central benefit–cost ratio far below the break-even the memo treats as obvious.
    Verdict:Wrong reference class
    3. True high-speed rail at that same unit cost. Dedicated track, full electrification, grade separation, 300 km/h — delivered for $25–40M per km.In Canadian conditions, $25–40M per km is not a high-speed-rail figure at all. It is roughly the cost of a high-performance rail upgrade — incremental improvement of existing alignments, the option the memo dismisses in a single line. The memo promises high-speed performance at high-performance-rail prices. The headline product and the headline number belong to two different projects; you cannot buy the performance of one at the price of the other.
    Verdict:HSR promise, HPR price
    $25–40M
    per km — the memo’s claimed unit cost, from France / Spain / Japan
    Build Canada memo
    ≈ $143B
    reference-class capital for the corridor delivered as high-speed rail
    CRI reference-class analysis
    ≈ 0.06
    central benefit–cost ratio — against the memo’s implied two-year payback
    CRI NPV / BCR matrix

    “Payback in two years” implies a project that returns many times its capital. The reference-class evidence points to one that returns a small fraction of it. The gap between the memo’s number and the comparable record is not a rounding difference; it is the entire argument.

    What Has Happened Since

    The diagnosis confirmed, the targets refuted

    More than a year on, events have tested the memo’s promises against reality. They vindicate its diagnosis of Canadian megaproject failure and dismantle the targets it set against that diagnosis.

    A corridor still being re-routed in year two

    The memo set a target of a high-value section carrying passengers within five years, on standardized, locked-in designs, at 10 per cent contingency. Yet the corridor is still being fundamentally re-aligned — a southern-corridor study, a conditional new station at Kingston, an alignment still unchosen between north and south. That is direct evidence of the planning immaturity the memo flagged on its first page — and it makes the memo’s own targets incoherent. You cannot run trains in five years on frozen designs while you are still deciding where the line goes.

    Friction exactly where the method predicts

    The memo’s prescriptions — sever environmental review from planning, legislate automatic approvals, reduce municipalities to suggesting where infrastructure is placed rather than whether — were aimed at the precise constraints this corridor turns out to be full of: two UNESCO designations, species at risk, organized community opposition, and rural-character concerns that public consultation surfaced in volume. The Initiative’s Community Friction Index has risen from 43 to 54 since consultation began and is projected to climb further. The memo’s answer to friction is not to resolve it but to override it — and on this corridor, that is neither lawful nor likely.

    The memo’s own number makes the HPR case

    The memo dismisses improving existing rail as insufficient, insisting dedicated high-speed track is the only way. But its own affordability figure, $25–40M per km, is a high-performance-rail number — and the consultation recorded clear public appetite for improving VIA service first and preserving existing Kingston and eastern-Ontario connections. Strip the rhetoric and the memo makes the affordability case for the alternative it rejects.

    Conclusion

    The antidote that recreates the disease

    The memo casts ALTO as Canada’s escape from the HS2 and California failures. Trace its logic, though, and the resemblance runs the other way. “We will build it cheaply and quickly like France and Japan — just cap the contingency and clear the obstacles” is not the cure for optimism bias. It is the textbook expression of it, almost word for word how California began.

    The memo’s real service is that it concedes the entire framework. Flyvbjerg, reference classes, contingency discipline, planning maturity: take those tools, feed them honest inputs, and the conclusion does not survive. The case for caution on ALTO does not require rejecting Build Canada’s method — it requires applying it. Done honestly, it points not toward a sprint to high-speed rail at imported prices, but toward a high-performance upgrade of the corridor Canadians actually use, at a cost the country can defend.

    Where The Method Lands

    Summary ledger

    The memo measured against the standard it sets for itself:

    Sound
    Diagnosis — planning-maturity gap. Correctly identifies that Canadian projects enter procurement at 1–10% design versus 30–70% abroad.
    Sound
    Delivery authority. Rightly prefers a strong, technically competent public authority over dependence on a consultant consortium.
    Sound
    Reference-class benchmarking. Rightly names it as the antidote to optimism bias.
    Violated
    10% contingency cap prescribed at 1–10% design maturity — manufactures the overrun the memo warns against.
    Violated
    $25–40M/km imported from non-comparable lines without adjustment for terrain, era, or urban approaches.
    Violated
    HSR promised at HPR price. The headline product and the headline cost belong to two different projects.
    Violated
    Override of environmental review and municipal consent — aimed squarely at the corridor’s real, documented constraints.
    Refuted by events
    Five-year passenger target on frozen designs — incompatible with a corridor still being re-routed in the project’s second year.

    The memo is at its strongest where it agrees with the Initiative — on method. It is at its weakest where it abandons that method to reach a predetermined answer. Applied honestly, Build Canada’s own framework makes the case for high-performance-rail realism, not for a high-speed sprint at imported prices.

    Sources

    Primary documents and references

    1.
    Build Canada, “Let’s Show the World How Canada Builds” (memo), February 24, 2025 — the document under review. buildcanada.com/memos/how-canada-builds
    2.
    Alto, Public Consultation Report, June 22, 2026 — corridor framing, southern-corridor and Kingston-station feedback, community and environmental concerns.
    3.
    Bent Flyvbjerg, “What You Should Know About Megaprojects and Why: An Overview,” Project Management Journal (2014) — the megaproject-overrun research the memo cites.
    4.
    ALTO HSR Citizen Research Initiative — reference-class forecasting, Engineering Complexity Index regression, and de-biased cost analysis for the Toronto–Quebec City corridor.
    5.
    ALTO HSR Citizen Research Initiative — NPV / benefit–cost matrix and Community Friction Index (post-consultation update).
  • Not off the hook

    CRI community brief · June 2026

    Not Off the Hook

    In Alto’s own words: why a Kingston station makes the southern corridor more uncertain for the communities around it, not less.

    Alto HSR Citizen Research Initiative · Independent & non-partisan

    The short version

    The June 22 announcement can feel like a finish line for the communities between Ottawa, Kingston and Peterborough. It is closer to a starting gun. Alto’s CEO has said the company is now “concentrating on the southern corridor,” that the corridor there is still wide, and that the alignment will be drawn “in the next few months.” A station in Kingston does not spare the townships the line must cross to reach it, instead, it commits the line to crossing them.

    Three reasons people think the fight is over and why each is wrong

    After a feel-good announcement, it is natural to assume the danger has passed. Here are the three readings going around the corridor, and why each one misreads what was actually said.

    What it feels like
    What is actually true
    “The route moved to Kingston, so my area is safe.”
    A station is a destination, not a route. The tracks still have to travel the whole Ottawa–Kingston–Peterborough band to get there. A Kingston stop does not lift the line off the surrounding townships; it commits the line to passing through them.
    “A decision was made.”
    It was not. The Minister directed Alto to study a southern option, hedged “subject to technical feasibility and project requirements.” The alignment for this segment is not chosen until the 2027 consultation, with the impact assessment to follow.
    “If I’m not right on the 401, I’m fine.”
    Alto’s CEO said the line will not follow the 401 the whole way, and that the Ottawa-to-near-Kingston stretch is “probably too curvy.” That means the inland, off-highway countryside is exactly where the route is still open.

    What the CEO actually said

    In an interview the day of the announcement, Alto’s president and CEO described a search area that is widening, not closing. He said the northern route along the Highway 7 corridor has not been scrapped, it is “not off the table”. However, the likelihood of going back north is “less and less obvious,” because the company is now “concentrating on the southern corridor.”

    He described the corridor between Ottawa, Kingston and Peterborough as still “fairly wide,” and said the job over the next few months is to determine how to get from Ottawa to Kingston with the “alignment of least impact” by following existing infrastructure where possible and trying to limit impact on the agricultural sector. He added that the line likely would not follow Highway 401 entirely, and that the Ottawa-to-near-Kingston stretch is too curvy to use the highway as a corridor there.

    Read together, those statements describe the southern band as the primary search area, still wide, and actively being drawn right now. That is the opposite of a settled outcome according to Alto’s CEO.

    A wider search area, not a narrower one

    “Wide corridor” is Alto’s own phrase, and a wide corridor means nothing inside it is fixed. The band still runs from Ottawa to Peterborough by way of Kingston, and the communities inside it — among them Stone Mills, Greater Napanee, Tyendinaga, Rideau Lakes, Tay Valley and South Frontenac — are not on the edge of this decision. They are inside the active study area. Adding Kingston as a destination does not shrink that band; it gives the line a reason to run through the middle of it.

    “Least impact” is a promise, not a plan

    The reassuring language — “least impact,” “follow existing infrastructure,” “limit impact on agriculture” — is worth reading carefully. None of it is defined, none of it is published, and none of it is a commitment any community can hold Alto to yet. “Least impact” still means an impact, on someone, somewhere; and the decision to avoid the 401 where it is too curvy means the alternative runs through open farmland and rural settlement. A goal stated in an interview is not a protection written into a route.

    It is also the moment to keep the alternative on the table. Many residents told the consultation they would rather see existing rail service improved first (we call it High Performance Rail) before a new line is carved through the countryside. That option does not disappear because a station was named; it is exactly the question a wide-open corridor should still be asking.

    The clock, and why now is the moment

    The decision that affects you has not happened. Here is when it does.

    This fall (2026)
    Alto narrows the Central segment (Ottawa–Montréal) corridor and runs another round of public consultation.
    2027
    Consultation on the western segment (Toronto–Ottawa) — which contains the Peterborough–Ottawa southern option and the Kingston question — the segment that decides the route through these communities.
    ~January 2027
    The federal impact assessment is expected to begin and run about two years, with its own input opportunities.

    The alignment is on the drawing board over the next few months. The relief that follows a feel-good announcement is exactly what empties the room while the line is being drawn. The communities that stay organized and on the record are the ones whose concerns will define what “least impact” ends up meaning.

    What keeps your community on the map

    • Stay organized across township lines. The corridor crosses many municipalities; the case is strongest when those communities speak together rather than each assuming the line will land on someone else.
    • Document your property now. Photographs, surveys, drainage, wells and septic, farm operations and field connectivity. A clear record is your strongest tool the moment a route is proposed nearby.
    • Put your council and your MP on record. Municipal resolutions and parliamentary questions can demand the alignment criteria and the evidence. Keep your community’s position documented before the route is drawn.
    • Ask to see the rules. “Least impact” should come with published criteria and weightings. Ask for them. A standard you cannot read is a standard no one can be held to.
    • Mark the dates. Fall 2026 (Central), 2027 (your segment), and the impact assessment. Those are the rooms where the route is decided: be in them.

    A station for Kingston is not a reprieve for the corridor. The line still has to get there. Alto has said it has not decided how.

    Download the full brief (PDF)

    Sources

    1. Elliot Ferguson, “Alto CEO says there are options to add Kingston to rail project,” Kingston Whig-Standard, June 22, 2026.
    2. Transport Canada, news release on the What We Heard report and Kingston as a potential stop, June 22, 2026. canada.ca
    3. Alto, Public Consultation — What We Heard Report, Corridor Study Area (134 pp), June 2026. altotrain.ca

    Quoted phrases are the words of Alto’s president and CEO as reported in the Kingston Whig-Standard interview of June 22, 2026. The Alto HSR Citizen Research Initiative is an independent, non-partisan research project examining the proposed corridor through Eastern Ontario.

  • Heard not counted

    CRI analysis · June 2026

    Heard, Not Counted

    Alto’s What We Heard report is precise about how many people it reached and silent about what they said. That silence is not an omission — it is the design.

    Alto HSR Citizen Research Initiative · Independent & non-partisan

    What Alto counts, exactly

    324,026 unique online visits
    24,142 questionnaires completed
    19,903 map pins dropped
    14,503 media mentions

    What Alto leaves uncounted

    how many raised each theme
    concerns by category
    any sentiment split
    which issues mattered most

    The same report, two standards of precision: six significant figures for the inputs, no number at all for the outputs.

    The argument

    The report is accountability-shaped but accountability-proof. It maximizes the visible evidence that consultation happened while removing every element that would let anyone test what it produced — so that hearing is decoupled from consequence.

    1

    The smoking gun: asymmetric precision

    The clearest evidence isn’t interpretive — it’s on the page. Alto reports its inputs to six significant figures and its outputs with no number at all (see the ledger above).

    The qualitative colouring is asymmetric in the same breath. In adjacent sentences of the executive summary, support gets intensifiers and active voice — nation-building “viewed positively, alongside strong enthusiasm,” supporters who “expressed a desire” to move forward. Opposition gets neutral process-verbs and passive voice — land-acquisition opposition “was voiced,” concerns “raised… on many occasions.” Both are unquantified; one is painted warm and active, the other cool and passive. That asymmetry, in a single paragraph, is the legitimation machine in miniature.

    2

    A report that cannot be wrong

    The report says its themes were produced by “Artificial intelligence tools… semantic clustering, multi-label classification,” which also “were used to support report writing.” Add the absence of magnitude, the absence of attribution, and the instruction that the themes “are not presented in a specific order and they are all significant” — and the report becomes structurally unfalsifiable.

    There is no figure to check against the inputs, no ranking to dispute, no claim that could be shown false. “All significant” is not a finding; it is a flattening — it pre-emptively denies that overwhelming, concentrated opposition would look any different from a scatter of mild concerns. A report that cannot be wrong is not a record. It is a position statement wearing a record’s clothes.

    3

    The frame was set before the room opened

    The corridor that was consulted on was drawn first — from technical and financial criteria (“the straightest possible route,” “minimizing construction costs”) and the three 2025 RFP submissions — and then presented for feedback. The exercise is explicitly “corridor refinement”: consultation on the width of a band already drawn from cost-minimization, not on whether or where. The seven “project outcomes” are stated as fixed premises the consultation serves, never as propositions it could test.

    The consultation’s frame excludes the project’s own justification. A participant could object to a curve; they could not put on the record that the stated outcomes might be better met by upgrading existing lines — the question the public itself kept raising as “improve VIA first.” The frame did the foreclosing; the consultation only refined inside it.

    4

    Consent invoked, consent disclaimed

    Both reports invoke “Free, Prior, and Informed Consent” — and the word doing the work is consent. Yet the report never claims consent was obtained; it says Alto consults “with the aim of securing” it, then states flatly the process “is not a rights determination process.” It wears the standard as a credential while disclaiming the thing the standard names.

    Its own numbers undercut the credential: of 40 Indigenous communities contacted, 29 held meetings and 12 made further submissions — a thinning base for a report it calls “validated.” And corridor maps were shared only with communities that had signed a collaboration or non-disclosure agreement. Consultation conducted under NDA is a contradiction in terms for a public, rights-bearing process: you could only see what you were consulted on by signing away the ability to discuss it.

    5

    Responsiveness, staged

    The report — which documents Kingston-area demand — was released the same day, at Queen’s University, alongside the Minister’s direction to study a southern route through Kingston. The sequence manufactures a narrative of listening and responding. But the response is a direction to study, hedged twice (“potential,” “subject to technical feasibility”), and the real consultation on that segment is pushed to 2027. The report stages responsiveness in the present while deferring the substance past the next news cycle.

    6

    What this argument does not claim

    A sharper critique is also a more honest one. Naming what Alto can rebut makes the rest land harder.

    • Not that Alto ignored concerns. It didn’t — the southern-corridor section names farmland, the Frontenac Arch, karst and groundwater specifically. The defensible claim is narrower and deadlier: Alto records concerns in a form that cannot be acted on or audited.
    • Not that the comment counts are bad faith. The public-facing range (“nearly 20,000” vs “nearly 45,000”) is two framings and partly an artifact of windowing and de-duplication. The fair point is rhetorical: Alto’s own site reaches for the smaller number.
    • Not that using AI is the flaw. The flaw is that the taxonomy is undisclosed and the outputs unquantified. The target is the opacity, not the method.
    • Not that this was a representative poll. Neither report claims it was. The platform measures the intensity of the concerned — which is exactly why the absence of any sentiment or geographic breakdown is the tell.

    The line that holds

    Alto published a 134-page account of a consultation that is precise about how many people it reached and silent about what they said — and that silence is the product, not an omission.

    Download the full brief (PDF)

    Sources

    1. Alto, Public Consultation — What We Heard Report, Corridor Study Area (134 pp), June 2026.
    2. Alto, Indigenous Consultation — What We Heard Report, Corridor Study Area (24 pp), June 2026.
    3. Transport Canada, news release on the What We Heard report and Kingston as a potential stop, June 22, 2026. canada.ca

    Quoted phrases are taken directly from the reports named above. The Alto HSR Citizen Research Initiative is an independent, non-partisan research project examining the proposed high-speed rail corridor through Eastern Ontario. This analysis addresses how the consultation was reported; it takes no position here for or against the project itself.

  • Tourism Study

    Benefits for Stations, Costs for the Corridor

    ALTO has published its own tourism study. It studies only the seven station cities — and counts none of the costs.

    ⚠ New Release: ALTO Commissions a Tourism Study

    In June 2026 ALTO released “Tourism in the Alto Corridor: Current Conditions and Potential Impacts,” prepared for ALTO by the consultancy CPCS in association with HDR. It is the first time the project has placed a tourism analysis on the public record. The report’s headline is that ALTO “could contribute an additional $1 billion to GDP annually, and support 11,500 more jobs under a medium coordination scenario.”

    The report carries the standard commissioned-work disclaimer — the opinions “are those of the authors and do not necessarily reflect the views of Alto” — and is dated June 2026, after the April 24 consultation deadline had already closed. It is a gross-benefit study of the seven station cities. It does not measure a single cost.

    Critical Finding

    ALTO’s own consultant has now confirmed, in writing, the distinction this initiative has argued from the start: tourism benefits accrue to stations, not to the tracks between them. The report studies only the six Census Metropolitan Areas that contain the seven proposed stations — Toronto, Peterborough, Ottawa-Gatineau, Montreal, Trois-Rivières, and Québec City. The rural landscapes the corridor would traverse without stopping — Frontenac, Leeds & Grenville, the entire RTO 9 region — are outside the study’s frame entirely.

    The report is a benefits-only document. It contains no construction-phase impacts, no tourism losses, and no accounting for visitors who shift away from non-station regions toward station hubs — even though the report itself concedes that smaller places that fail to differentiate “will limit gains — or even risk losing activity to larger centres.” The study answers one question: how much tourism might the seven stops gain? It never asks the second: what does the corridor cost the regions it passes through?

    The much-quoted “$1 billion / 11,500 jobs” is the medium scenario, not the central case. The low scenario is +$177 million and roughly 2,000 jobs. Even the medium figure is contingent on dedicated tourism policy, last-mile connections, and destination readiness across the corridor — none of which ALTO controls or funds. The report concedes the foundational caveat in its own words: “HSR alone is rarely sufficient to generate sustained tourism development.”

    Download
    Benefits for Stations, Costs for the Corridor — Full Brief (PDF)
    A point-by-point reading of ALTO’s tourism study against the cost side it omits, with the evidence from this initiative’s earlier tourism research
    Download PDF
    What the Study Is

    A commissioned, benefits-only study of the seven stops

    “Tourism in the Alto Corridor” combines three things: a baseline profile of tourism in the six station CMAs; a review of international case studies on high-speed rail and tourism; and three illustrative scenarios that vary the level of tourism-policy coordination from low to high. Its baseline finding is that tourism in those CMAs already generates over $31 billion in visitor spending, contributes about $33.7 billion to GDP, and supports more than 377,000 jobs, with Toronto and Montreal accounting for the largest shares.

    The forward-looking finding — the one ALTO’s communications will lead with — is that additional tourism spending under the project could add to GDP and jobs. But the three scenarios produce very different numbers, and the report is explicit that they are “illustrative and should not be interpreted as forecasts.”

    +$177M
    added GDP / ~2,000 jobs — low coordination scenario
    CPCS for ALTO, p.23
    +$1.0B
    added GDP / 11,500 jobs — medium coordination scenario (the headline)
    CPCS for ALTO, p.23
    +$3.9B
    added GDP / 43,000 jobs — high coordination scenario
    CPCS for ALTO, p.23

    The single most important sentence in the document appears on page 7: the destinations “most likely to be affected by a high-speed rail service are the urban areas where stations are located.” That premise defines the study’s entire scope. Everything that follows is built on the six station CMAs. The communities between them — the ones with no station — are not modelled, not measured, and not mentioned in the results.

    What ALTO’s Consultant Concedes

    The report admits the bypass risk in its own words

    This initiative has argued throughout the consultation that high-speed rail creates a station/no-station divide: stations create tourism, tracks do not. ALTO’s commissioned study does not contradict that argument. In several places, it states it.

    What the report saysWhat it means for the corridor regions
    “The travel and tourism destinations most likely to be affected by a high-speed rail service are the urban areas where stations are located.” (p.7) The study is then built only on the six station CMAs.The regions the southern corridor would cross without a station — Frontenac, Leeds & Grenville, Lennox & Addington, the RTO 9 region — are outside the analytical frame. The study cannot show a benefit for them because it never looks at them.
    Smaller municipalities that fail to differentiate and coordinate “will limit gains — or even risk losing activity to larger centres.” (p.18)This is the bypass / agglomeration effect, conceded. The report frames it as a risk that supportive policy might manage. For a region with tracks and no station, it is the predictable default, not a managed exception.
    “HSR alone is rarely sufficient to generate sustained tourism development; realized impacts depend on coordinated local strategies.” (p.18)Even the modelled gains require destination marketing, event programming, accommodation, and last-mile connections that ALTO neither funds nor controls. Absent that coordination, the report’s own logic points to the low scenario or below.
    International tourist numbers see “limited to no change” (p.22 note); nearly all modelled gains are in-corridor domestic visitors making shorter trips.The projected uplift is largely Ontario and Quebec residents travelling more within their own provinces — a reshuffling of where Canadians already spend, not clearly net-new national tourism. The report never tests whether this is displacement.

    Read together, these are not stray caveats. They are the analytical spine of the report. ALTO’s consultant has confirmed the station/no-station distinction, conceded that non-station places can lose activity, and acknowledged that the benefits depend on conditions outside ALTO’s gift.

    Update · July 2026

    A second commissioned study, and what it says about the first

    This brief was published in June 2026, days after ALTO released the CPCS tourism study. On July 13, 2026 ALTO published a second commissioned economic study — An Overview of the Structural Economic Impacts of Alto, prepared by Aviseo Consulting — alongside a blog post summarising it. That study answers a question this brief left open, and it answers it against ALTO’s own tourism claim.

    The displacement question, answered by ALTO’s other consultant

    This brief noted that the modelled tourism gains are largely in-corridor domestic visitors, that international numbers show limited to no change, and that the CPCS report never tests whether this is displacement rather than net-new national tourism.

    The Aviseo study does test it, and reaches the opposite conclusion. It counts international tourism only, on the stated ground that increased domestic tourism would at least partly reflect substitution from existing household expenditure, with limited net effect at the macroeconomic level. In its own words, the driver of national GDP is the net inflow of foreign spending.

    The category that produces the CPCS headline is therefore the category ALTO’s other consultant sets aside as largely a reshuffling of money Canadians would have spent anyway.

    Aviseo — $0.8 billionCPCS — $1.0 billion
    International visitors only. Domestic tourism excluded as substitution with limited national effect. Estimated using a general equilibrium model, which nets out activity displaced from elsewhere in the economy.Medium scenario driven predominantly by in-corridor domestic travel. Estimated using Statistics Canada input-output multipliers including induced effects, which aggregate gross activity without netting displacement.
    Result:Two figures that cannot be combined

    A third figure circulates alongside them. ALTO’s FAQ page advertises $800 million a year in tourism revenue. That corresponds to Aviseo’s contribution-to-GDP figure, which is a value-added measure rather than revenue, and matches no revenue figure in either report.

    In the base case, two station cities receive nothing

    This brief established that the rural corridor regions are outside the study’s frame. The per-city results, at Tables 13 and 15 of the CPCS report, show that the scope problem does not stop at the regions left out. It reaches two of the station cities that were included.

    CityAdditional annual tourism spending
    Toronto$37M under low coordination; up to $1,500M under high
    Québec City$50M under low coordination; up to $500M under high
    Montréal (incl. Laval)$44M under low coordination; up to $900M under high
    Ottawa-Gatineau$21M under low coordination; up to $560M under high
    Trois-Rivières$0 under low coordination; up to $25M under high
    Peterborough$0 under low coordination; up to $35M under high
    Low coordination:Nothing for the two smallest station cities

    The GDP table records the same outcome: under low coordination Peterborough remains unchanged at $475 million and Trois-Rivières unchanged at $318 million. Even under full corridor-wide policy coordination, Peterborough reaches up to $35 million against Toronto’s $1.5 billion — a ratio of roughly 43 to 1.

    The blog post with which ALTO announced this study is titled “How High-Speed Rail Will Boost Tourism from Big Cities to Small Towns.”

    The summary reverses the report’s own caution

    This brief quoted the report’s statement that its scenarios are illustrative and should not be interpreted as forecasts. ALTO’s June 8 blog post describes the same scenarios as forecasts, says the report contains tangible projections, and states that ALTO engaged CPCS to provide real-world, objective results. It reports the medium scenario figures and does not mention the low scenario at all.

    An unreported finding: faster trains can reduce hotel revenue

    Under low coordination, business tourism spending falls in Montréal, Ottawa-Gatineau and Québec City, as high-speed rail converts overnight business trips into same-day return trips. The report cites the Paris–Lyon case, where average stays fell from 2.3 nights to 1.7 once same-day return became practical. This appears in no public summary of the study.

    The Initiative examines the second study, the treatment of both in ALTO’s public materials, and the arithmetic of the 1.1 per cent GDP claim in a companion economics brief. Two Point Two Trillion

    The Cost Side

    Everything the study does not count

    A tourism impact assessment that names a benefit but no cost is a half-ledger. The report’s title promises “potential impacts”; what it delivers is potential gains at the seven stops. The costs documented in this initiative’s earlier research — and in submissions from affected regions — appear nowhere in it.

    Cost the corridor imposesHow ALTO’s tourism study treats it
    Construction-phase disruption. Eight to ten years of blasting, dust, night lighting, truck traffic, road closures, and trail severance through tourism-dependent rural areas — documented in this initiative’s RTO 9 submission and the snowmobile-trail brief.Absent. The scenarios model an operating railway “if Alto were in service today.” The decade of construction that precedes any operating benefit is not in the analysis at all.
    Treatment:Not counted
    Trail and active-tourism loss. The Cataraqui Trail (a 104 km segment of the Trans-Canada Trail) and the organized snowmobile network of OFSC Districts 1, 2 and 6 — an estimated $220–270 million in direct expenditure and $450–540 million in total annual activity — run through the corridor.Absent. The study’s tourism universe is the six metropolitan CMAs. Rural rail-trail and winter-tourism economies are not in its scope, so their potential loss does not register against the modelled urban gains.
    Treatment:Not counted
    The at-risk regional economy. RTO 9 recorded $1.8 billion in tourism spending in the first nine months of 2024; the Rideau Heritage Route sustains roughly $695 million in GDP and 8,744 jobs. Both sit in the southern corridor’s path.Absent. Neither figure appears. The regions that generate them are not among the six CMAs studied, so the report’s GDP and jobs gains are not netted against any of this exposure.
    Treatment:Not counted
    VIA Rail displacement — regional and national. MP Scott Reid has confirmed in writing that either corridor option is likely to reduce VIA ridership and trigger service cuts through Kingston, Brockville, and other southeastern Ontario towns — the low-carbon access mode visitors use to reach these destinations without a car. The risk is also national: then–NDP transport critic Taylor Bachrach (Skeena–Bulkley Valley) warned that VIA earns more than 80% of its revenue and carries more than 90% of its passengers on the Quebec City–Windsor corridor, and that handing that corridor to a private operator would leave VIA with “a fraction of the revenue” it uses to cross-subsidize long-distance rural routes across the Prairies, the West, and the Maritimes.Absent. The report does not consider the loss of existing rail access to non-station communities, even as it counts new rail access as a benefit to station communities. Nor does it weigh the wider risk to the national VIA network that the corridor’s revenue currently helps sustain.
    Treatment:Not counted
    Visitors drawn away from non-station regions. The bypass effect the report concedes on page 18 — activity migrating to larger centres with stations.Conceded but not quantified. The report names the risk and then models only the upside at the stations that would gain. The corresponding loss elsewhere is acknowledged in prose and excluded from the numbers.
    Treatment:Acknowledged, not measured
    How Robust Are the Numbers?

    Assumption-driven scenarios, not forecasts

    Even taken on its own terms, the report’s headline number is softer than it will sound in a press release. Five features of the method are worth keeping in view.

    The headline is the middle scenario, not a central estimate

    The “$1 billion / 11,500 jobs” figure is the medium coordination scenario. It requires dedicated tourism policy in every city, improved last-mile connections, and rising convention and event activity. The report’s own framing makes clear these are conditions to be met, not outcomes of the railway itself.

    The gains are scenario assumptions, not a Canadian model

    The arrival, length-of-stay, and spending percentages in Appendix B are judgmental selections from the international literature, applied to Canadian baseline data. They are not derived from a Canadian demand model or validated against Canadian outturns. The outputs are functions of the chosen inputs.

    No reference-class or outturn discipline

    The tourism uplift is bracketed by three policy scenarios chosen to span a positive range. There is no reference-class comparison to what comparable HSR projects actually delivered — the same optimism-friendly structure this initiative has critiqued in ALTO’s ridership and cost work.

    Shorter stays can reduce spending even as arrivals rise

    The report concedes that average length of stay falls in some cities even in the medium scenario, as shorter-staying in-corridor visitors displace longer-staying international ones, and that accommodation spending can drop even when arrival counts go up.

    The report’s own “structural differences” section undercuts transfer

    Page 19 lists the reasons the European evidence may not transfer to Canada: dispersed attractions, lower base tourism, car-dominant travel (85–98% of corridor visitors drive today; train is about 6% to Toronto and ~2% elsewhere), and an immature rail network. It concludes “early impacts may take longer to be realized.”

    Where Things Stand · June 2026

    Summary ledger

    Measuring ALTO’s tourism study against what an honest tourism assessment of the corridor would have to show:

    Confirmed
    Benefits accrue to stations, not tracks. ALTO’s consultant builds the entire study on the six station CMAs and states that station cities are the destinations most likely to be affected (p.7).
    Confirmed
    Non-station places can lose activity. The report concedes the bypass / agglomeration risk in its own words (p.18).
    Confirmed
    HSR alone is not sufficient. Benefits depend on policy coordination, last-mile connections, and destination readiness that ALTO does not fund (p.18).
    Confirmed
    The scope problem reaches inside the study. Under low coordination, Peterborough and Trois-Rivières — two of the six CMAs the report does cover — receive $0 additional tourism spending and $0 additional GDP (Tables 13 and 15).
    Soft
    The headline figure is the medium scenario, not a central estimate; the low scenario is roughly one-sixth of it. The numbers are scenario assumptions, explicitly “not forecasts.”
    Soft
    Gains are largely in-corridor domestic, with international numbers showing little change — raising an unanswered displacement question.
    Omitted
    Construction-phase disruption (8–10 years): not in the analysis.
    Omitted
    Trail and winter-tourism loss (Cataraqui Trail; OFSC Districts 1/2/6, $450–540M total activity): not in scope.
    Omitted
    At-risk regional economy (RTO 9 $1.8B; Rideau Heritage Route $695M GDP / 8,744 jobs): not netted against modelled gains.
    Omitted
    VIA Rail displacement: loss of existing rail access to non-station communities not considered — nor the national risk to VIA, which earns 80%+ of its revenue on this corridor.
    Omitted
    Bypass losses: conceded in prose (p.18) but excluded from the numbers.
    Contradicted
    ALTO’s two consultants disagree on the headline category. The Aviseo study (July 2026) counts international tourism only, treating domestic tourism as substitution with limited net national effect — the category that drives the CPCS figure. The two estimates use methods that cannot be combined.
    Reversed
    “Should not be interpreted as forecasts.” ALTO’s own June 8 blog post describes the same scenarios as forecasts and tangible projections giving real-world, objective results, and reports the medium scenario alone.

    ALTO has now produced its own tourism study, and it confirms three things this initiative has argued throughout. Tourism benefits accrue to stations, not to tracks. The rural corridor regions are not in the study. And the report contains no cost side at all. ALTO’s consultant has, in effect, validated the station/no-station distinction while declining to measure the half of the ledger that falls on Eastern Ontario. A benefits-only study of the seven stops is not a tourism impact assessment of the corridor.

    Download Full Brief
    Benefits for Stations, Costs for the Corridor (PDF)
    Complete reading of ALTO’s tourism study for decision-makers, RTO 9, MTCG, MPs, and constituents tracking the tourism file
    Download PDF
    Sources

    Primary documents

    1.
    CPCS, in association with HDR, for ALTO. Tourism in the Alto Corridor: Current Conditions and Potential Impacts. June 2026. (Scenario results, pp.21–24; policy-coordination conclusions, p.18; study scope, p.7; structural differences, p.19; baseline, p.5.)
    2.
    ALTO HSR Citizen Research Initiative. The Tourism Economy at Risk. citizenresearch.ca/tourism-economy
    3.
    ALTO HSR Citizen Research Initiative. Snowmobile Trails and High-Speed Rail. citizenresearch.ca/snowmobile-trails
    4.
    Submission to RTO 9 — ALTO High-Speed Rail Southern Corridor: Tourism & Economic Impacts for Southeastern Ontario. February 2026. (RTO 9 regional tourism spending, Jan–Sep 2024.)
    5.
    OFSC 2022–2023 Economic Impact Study (Harry Cummings & Associates, using the Ontario Ministry of Tourism TREIM model); district-level apportionment for Districts 1, 2 and 6.
    6.
    MP Scott Reid, correspondence to constituents (2026), re: VIA Rail displacement risk from HSR corridor selection.
    7.
    CBC News, “NDP warns privatizing high-speed rail from Toronto to Quebec could kill passenger trains in rest of Canada,” February 19, 2025 — carries MP Taylor Bachrach’s warning and VIA’s corridor revenue and passenger shares. cbc.ca
    8.
    ALTO, “Embark on a culinary adventure from Toronto to Quebec City” — Facebook advertisement, February 2026 (alto-hsr.ca).