Tag: ridership

  • Reading the ledger

    Reading the Ledger

    The single equation every operating rail corridor has to balance — and what it tells us about ALTO.

    ◆ Foundational Framework

    Most public discussion of major rail projects gets lost in the detail of individual numbers — capital cost, ridership, ticket price, subsidy, projected GDP impact. Each is presented as a standalone claim, defended or contested on its own terms. The result is a debate that produces heat without resolution.

    There is a simpler approach. Every operating rail corridor in the world, public or private, has to balance the same equation every year. The five terms in that equation are not negotiable; the equation is an accounting identity. What is negotiable is which terms are filled in, which are left implicit, and which are quietly set to zero by the proponent’s framing.

    Critical Finding

    Every operating rail corridor has to balance the same five-term equation every year. Choose any three of the four right-hand terms, and the fourth is fixed by arithmetic — not by political assertion. ALTO’s published materials supply numbers for some of the five terms, leave others implicit, and assume one — land value capture — is zero. The result, when written out, does not balance.

    This brief sets out the equation, walks through what anchors each of its five terms, and applies it to ALTO. The point is not to settle the project on a single number. It is to give the reader a structure for reading any major rail project’s published materials and asking the simple question: do the numbers balance?

    Download Full Methodology Paper
    A Framework for Independent Evaluation of the ALTO HSR Project (PDF)
    The annual fiscal ledger framework, the seven-stage analytical pipeline, and the supporting research notes underpinning each ledger term — the full apparatus this brief summarises

    Download PDF

    The Equation

    The five terms every corridor balances

    The ledger looks like this:

    The Annual Fiscal Ledger
    Capex × CRF+O&M and fleet capital=Ridership × Fare+Public subsidy+Land value capture
    annual debt service+annual operating cost=annual farebox+annual subsidy+annual LVC

    In words: the cost of running the corridor in a given year — debt service on the capital outlay, plus operations and maintenance, plus the periodic replacement of the train fleet — must equal the revenue collected from those who ride, plus the public subsidy required to close any remaining gap, plus whatever supplementary revenue is captured from land value uplift around stations.

    The identity is an accounting truism. What makes it analytically useful is that each of its five terms is independently anchored. None can be set at will. Each has a defensible value that emerges from a specific empirical or engineering methodology, rather than from political assertion. A claim that does not specify all five terms is incomplete by construction.

    The five terms group naturally into three sections. The cost side has two: capital service and operating cost. The earned revenue side has one: farebox. The gap-closing section has two: public subsidy and land value capture. Each section is anchored by a distinct methodology, and each gives a particular reader a particular handle on the project.

    Section 01 · The Cost Side

    What it costs to run the corridor each year

    The two cost terms — capital service and operating cost — are anchored by entirely separate methodologies. Both have to be answered before any debate about ticket prices or ridership begins.

    ~$4.9B
    annual capital service at the proponent-stated capex
    $75B capex, 5% / 30-yr CRF
    ~$9.3B
    annual capital service at the reference-class central capex
    $143B central RCF estimate
    ~$2.15B
    annual operating cost: O&M + fleet capital
    Stage 4 bottom-up at MID service

    Capital service (Capex × CRF) is the annual cost of paying back the capital outlay. It is the capital expenditure multiplied by the capital recovery factor, which reflects the cost of capital and the amortisation period. At the proponent-stated $75 billion capex and a representative 5% / 30-year CRF, this is approximately $4.9 billion per year. At the reference-class-adjusted central capex of $143 billion — derived from international cost-overrun patterns calibrated by the corridor’s engineering and community complexity — the same calculation produces approximately $9.3 billion per year.

    Operating cost (O&M and fleet capital) is the annual recurring cost of running the corridor, built bottom-up from corridor asset inventory and service-level inputs across three streams: infrastructure maintenance and renewals, operating categories (traincrew, traction energy, station operations, network control, commercial, insurance, general overhead), and the periodic replacement of trainsets. At MID service intensity this produces approximately $2.15 billion per year — $1.27 billion in infrastructure maintenance, $700 million in operations, and $180 million in fleet capital recapitalisation. International comparators (SNCF Réseau, Network Rail HS1, California HSRA, Spanish ADIF) are used at the end of the build for cross-validation, not as the primary estimating method.

    The crucial methodological point: operating cost is built independently of capital cost. The bottom-up engineering estimate of recurring annual cost does not depend on whatever capex figure the proponent adopts. It is therefore independent of the optimism bias that pervades capital cost estimation in the cost-overrun reference class.

    Why this matters

    A reader who is told only the capital cost has been given half the cost picture. A reader who is told operating cost will be covered by farebox has been given an answer that depends on the next section. Neither of these is a complete account of the cost side of the ledger.

    Section 02 · The Earned Revenue

    What the corridor can actually sell

    The earned revenue side of the ledger has one term: farebox. It is the only revenue source that can in principle be raised by selling something to a willing buyer; everything else on the right-hand side is either a transfer from the treasury or a charge on third parties.

    ~$1.3B
    annual farebox revenue at the welfare-efficient operating point
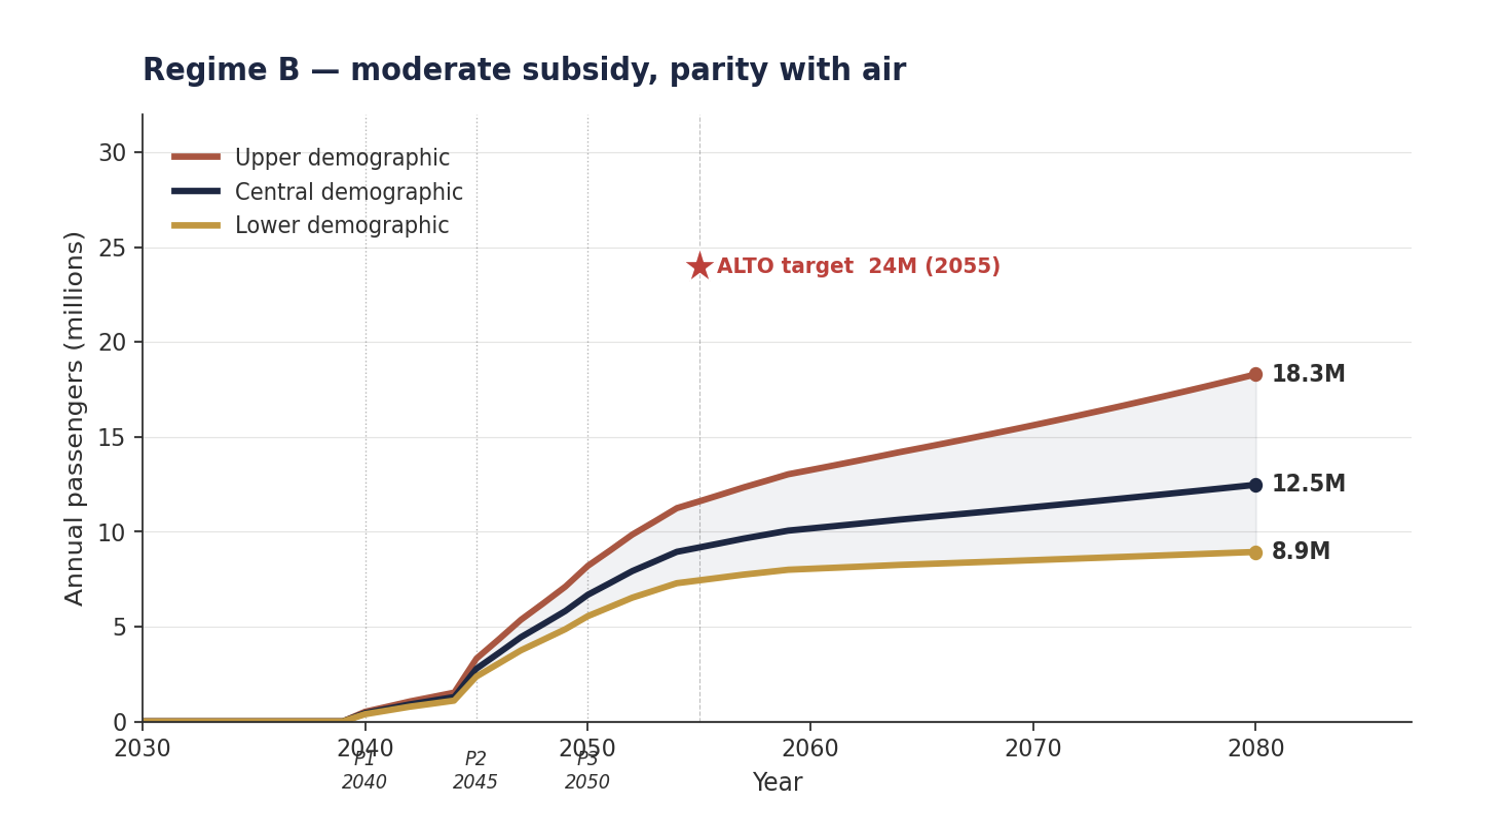
    Regime B: ~8M riders at fare parity with air
    5–12M
    annual ridership envelope across the operating-regime spectrum
    Stage 5 modal-shift frontier
    24–43M
    ridership figures in ALTO’s published materials
    all sit outside the achievable frontier

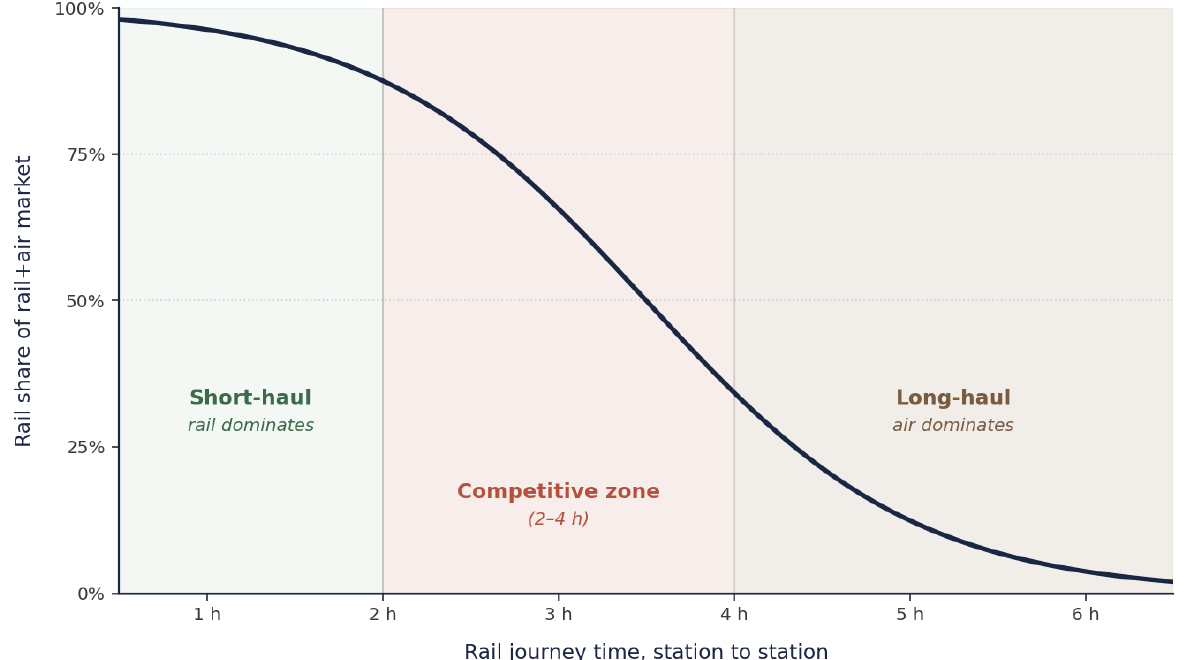
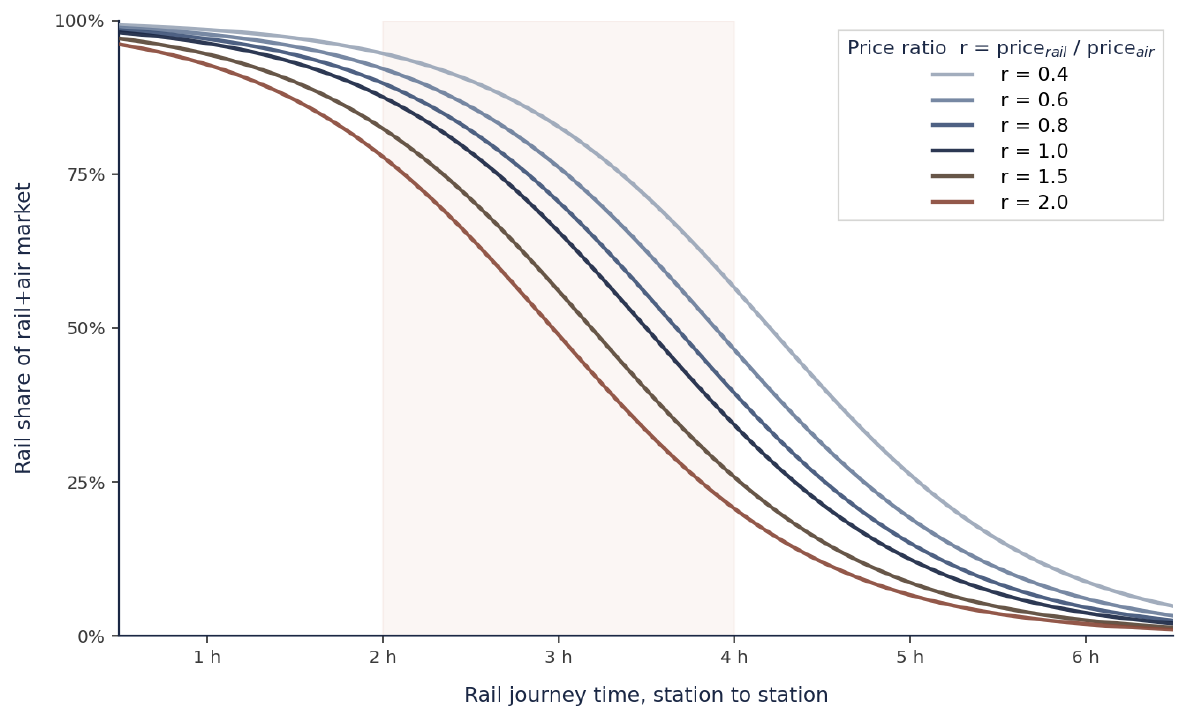
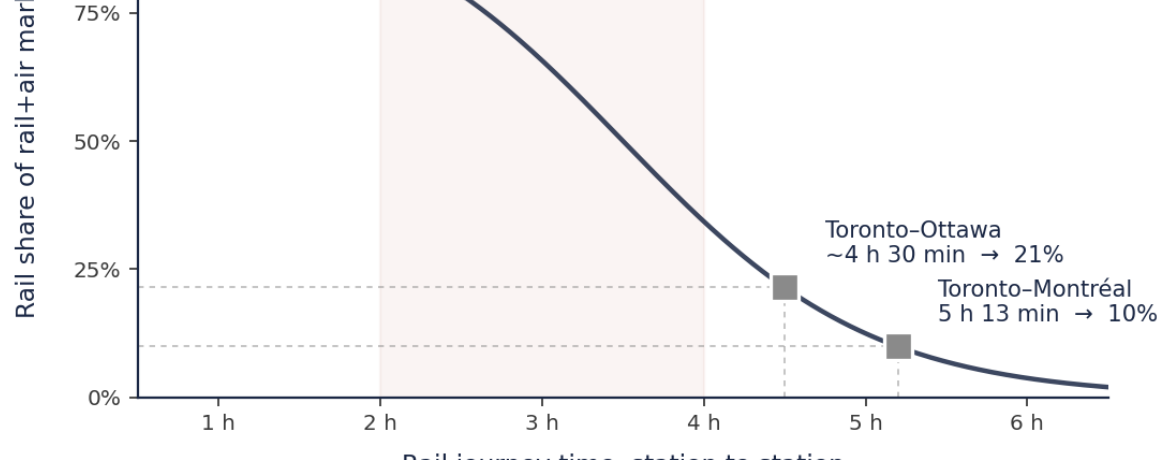
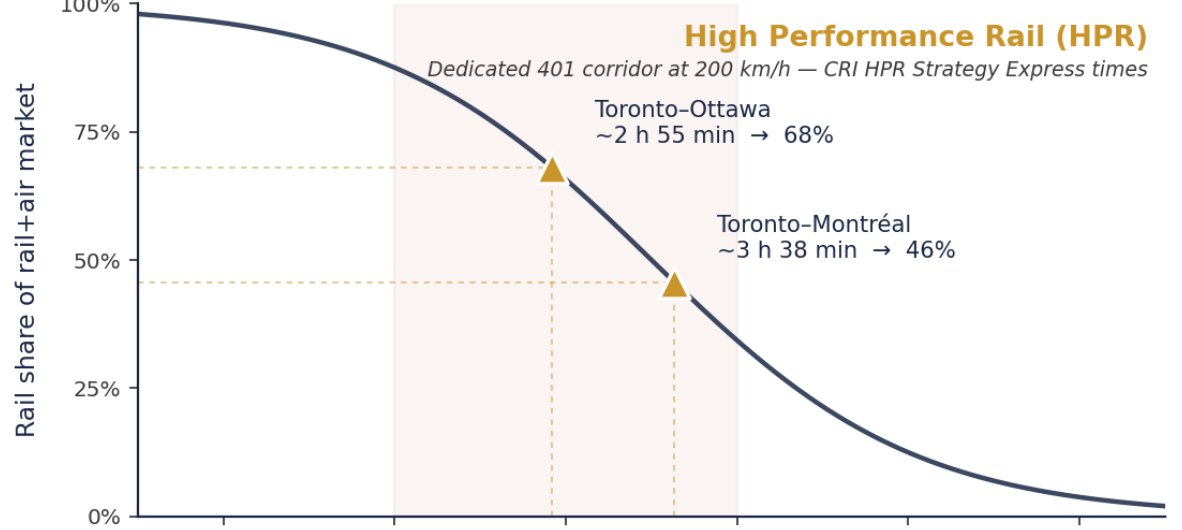
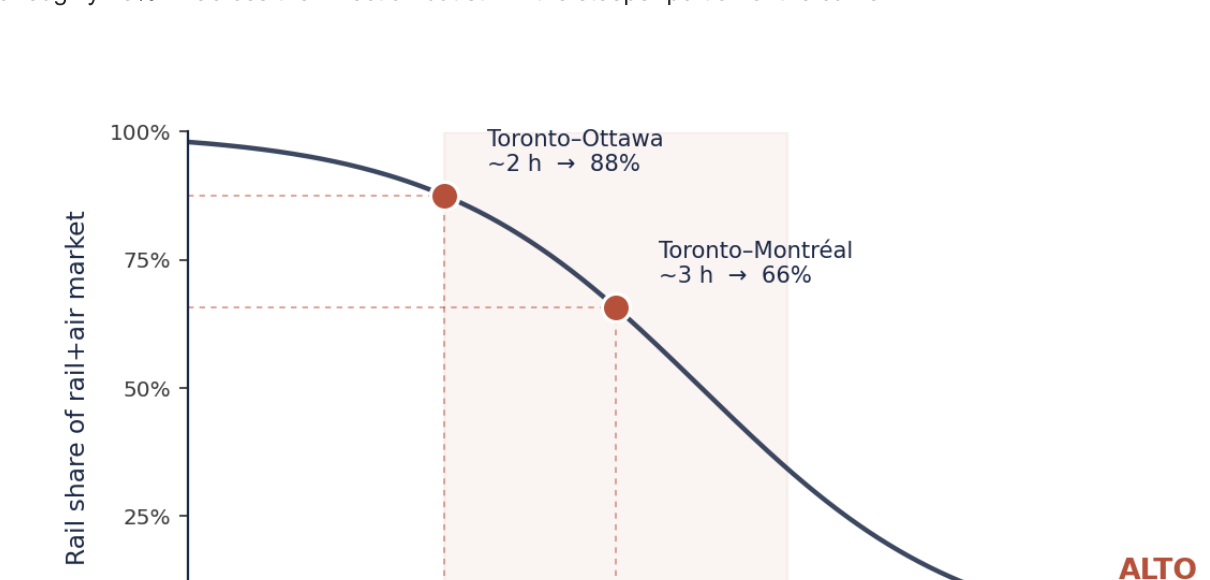
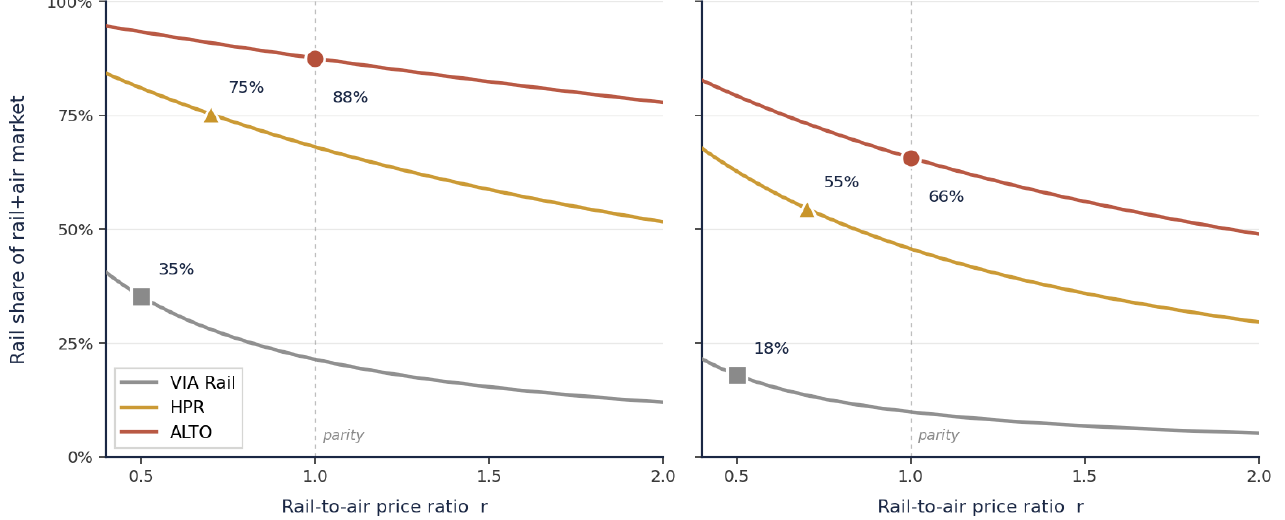
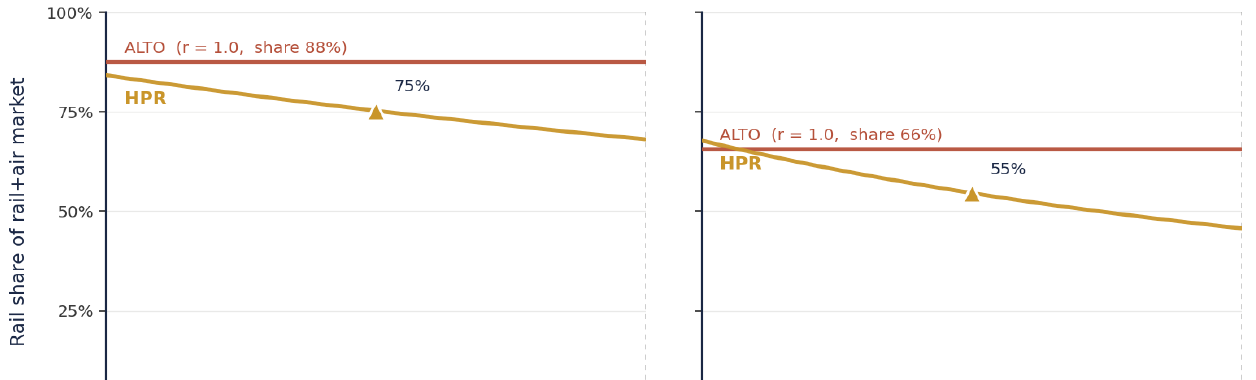
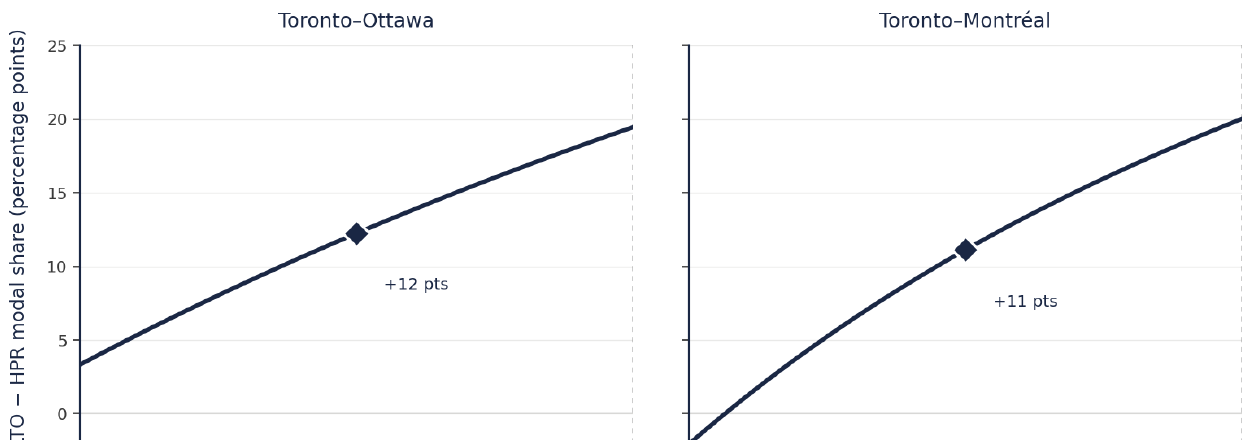
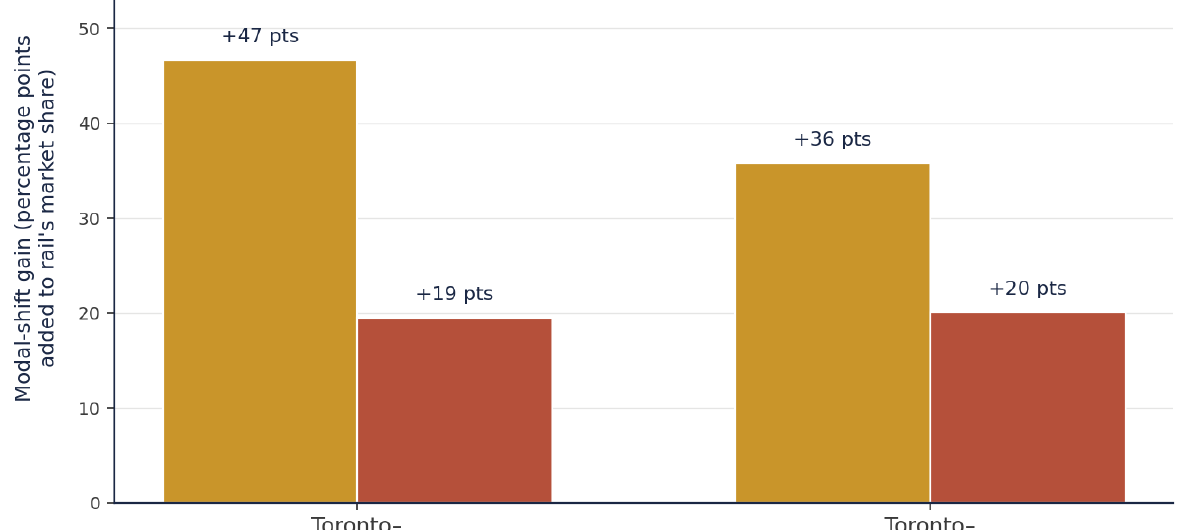
    Farebox revenue (Ridership × Fare) is the product of two variables that cannot be chosen independently. Raising fares reduces ridership along the air-rail and road-rail modal-shift S-curves; lowering fares reduces revenue per rider. The achievable combinations of ridership, fare, and corresponding subsidy lie on a one-dimensional frontier through a four-variable space. Choose any one variable, and the other three are fixed by the modal-shift relationships and the corridor’s demographics.

    For ALTO, the modal-shift frontier produces three discrete operating regimes. Regime A (heavy subsidy, deep fare discount to air) lands at approximately 12 million annual riders, $5 billion annual operating subsidy. Regime B (welfare-efficient, fare parity with air) lands at approximately 8 million annual riders, $2 billion annual operating subsidy, with peak fare revenue of approximately $1.29 billion. Regime C (minimal subsidy, yield-managed premium fare) lands at approximately 5 million annual riders, $1 billion annual operating subsidy.

    The Government’s published ridership figures — 24 million annually in some materials, 1.21 billion trips over the first 40 years (averaging approximately 30 million annually) and 43 million annually by 2084 in the Q-923 reply — all sit outside this achievable frontier. The reply’s $100 billion fare-revenue projection over the same forty-year window implies an average fare of approximately $83 per trip, a (fare, ridership) pair the modal-shift framework does not produce.

    Why this matters

    A claim that pairs a ridership figure with no specified fare, or a fare with no specified ridership, is not internally consistent. The two are linked by the corridor’s modal-shift mathematics. The frontier is the single-degree-of-freedom constraint that makes this so — and it is the analytical reason ALTO’s headline ridership figures cannot be defended on the modal-shift evidence.

    Section 03 · The Gap Closers

    What closes the gap between cost and earned revenue

    If farebox revenue does not equal cost — and at every operating point on the modal-shift frontier for ALTO, it does not — the gap has to be closed by something. Two instruments are available.

    $3.6–10.2B
    implied annual public subsidy across the cost and operating-regime range
    the residual that closes the ledger
    5–15%
    share of capital service typically funded by LVC in international comparators
    HS1, Crossrail, MTR, Japan
    $0
    land value capture under ALTO’s currently published scope
    no disclosed LVC instrument

    Public subsidy is the dominant gap-closer in every operational HSR network in the world. Every HSR system except the four highest-density Japanese and Chinese trunks operates with a structural annual operating subsidy on top of capital service support. Even those four required the full capital outlay from public funding. Public subsidy is the residual term in the ledger: whatever closes the gap between annual cost and the sum of farebox plus LVC. It is bounded below by zero (the corridor cannot pay passengers to board) and above by total cost.

    Land value capture is the only large-scale supplementary mechanism with an empirical track record. The known instruments — HS1’s station-area development uplift, Crossrail’s Business Rate Supplement, Hong Kong’s MTR Rail+Property model, Japan’s private-railway joint development arrangements — produce typically five to fifteen per cent of capital service requirements across these comparators. The remainder, in every case, closes through public subsidy.

    ALTO’s published materials disclose no LVC mechanism. Bill C-15 (the High-Speed Rail Network Act) provides streamlined expropriation and right-of-first-refusal authority but no betterment levy, tax-increment financing district, special assessment district, joint development framework, or air-rights regime. The forecast 60,000 to 63,000 new residential units around stations is invoked as a downstream property-tax benefit accruing to municipalities — not as a financing source for the corridor. The Senior Director, Commercial and First Nations Financial Participation role addresses Indigenous equity in Alto itself, not station-area land value capture.

    Under the current published scope, therefore, the LVC term is zero. The entire gap closes through public subsidy.

    Why this matters

    A claim that does not name a mechanism for closing the gap is implicitly claiming that public subsidy will close it. A claim that the corridor will be “self-sustaining” is a claim about a specific term — operating cost coverage by farebox — that says nothing about the much larger term of capital service. The reader who treats “self-sustaining” as a description of the project’s lifetime public cost is reading it against the narrowest available technical definition.

    Side by Side · ALTO’s Ledger

    The published numbers, written out

    Plug ALTO’s published numbers into the equation. The result, in central-case figures for the full corridor at maturity, looks like this:

    Ledger term What ALTO has disclosed
    Capex × CRF — annual capital service. At the proponent-stated $75B capex and a representative 5% / 30-yr CRF, approximately $4.9B per year. At the reference-class central capex ($143B), approximately $9.3B per year. ALTO has disclosed the capex range ($60–90B, AACE Class 5), but has not disclosed the annual capital service figure or the amortisation assumption behind it. The Q-923 reply addressed in Reading the Answer describes operations as “self-sustaining”, a claim that is silent on capital service.
    Term status:Capex disclosed, debt service not
    O&M and fleet capital — annual operating cost, built bottom-up from corridor asset inventory at MID service: ~$2.15B per year. ALTO refers in Q-923 to bottom-up O&M built from operational benchmarks and lifecycle profiles, but no figure has been published. The Stage 4 bottom-up engineering estimate in the methodology paper supplies a defensible ~$2.15B per year.
    Term status:Method described, figure not disclosed
    Ridership × Fare — annual farebox revenue. At the welfare-efficient operating point (Regime B), approximately $1.29B per year. ALTO has disclosed multiple, non-reconciled ridership figures (24M annually, 30M average over forty years, 43M by 2084). Average implied fare of ~$83 per trip from the Q-923 $100B / 40-year revenue figure sits outside the corridor’s achievable modal-shift frontier.
    Term status:Ridership figures non-reconciled and off-frontier
    Land value capture — supplementary revenue from station-area land value uplift. International comparators fund 5–15% of capital service this way. No disclosed mechanism. The forecast 60,000–63,000 new residential units around stations is invoked as a downstream property-tax benefit accruing to municipalities, not as a financing source. The LVC term is zero by default.
    Term status:No mechanism disclosed
    Public subsidy — the residual that closes the gap. With LVC at zero, this is approximately $5.76B per year at proponent-stated capex; approximately $10.16B per year at the reference-class central. Not disclosed in any form. The Q-923 reply asserts operations will be “financially self-sustaining” and “eliminating the need for ongoing operating subsidies.” That framing speaks to the operating cost term, which is the smaller of the two cost terms. It does not speak to the capital service term, which is approximately twice as large.
    Term status:Not disclosed; framed as zero

    At the reference-class central capex of $143 billion, the implied annual subsidy rises to approximately $10.16 billion. At the proponent-stated capex but the high-ridership operating regime (Regime A), the implied subsidy is approximately $3.6 billion per year — lower than the welfare-efficient case because Regime A places a heavier subsidy directly on the operating account, with a larger fare-revenue base offsetting some of it.

    None of these subsidy figures appears in ALTO’s published materials. None appears in the Government’s response to Order Paper Question Q-923. The framing speaks to the operating cost term, which is the smaller of the two cost terms. It does not speak to the capital service term, which is approximately twice as large.

    The Honest Answer

    Does the equation balance?

    Not in any of the operating regimes the modal-shift frontier permits. The corridor at any defensible operating posture produces fare revenue substantially below the sum of capital service and operating cost. The gap, in central-case figures, is between $3.6 billion and $10.2 billion per year — corresponding to a 60-year present value, at standard social discount rates, of roughly $80 billion to $230 billion.

    This is not, in itself, an argument against the project. Most large infrastructure projects in most countries close their gaps through public subsidy and have done so since the nineteenth century. The question is not whether the gap exists — the equation guarantees that it does — but whether the gap is being honestly disclosed and whether the public benefit justifies its size.

    The first half of that question can be answered by reading the published materials carefully. The second half is the political-economy judgment that the institutional process is supposed to support.

    What the methodology developed here does is make the first half answerable. The equation forces the disclosure. Every term is independently anchored, and a published claim that does not specify all five terms is incomplete by construction. A reader who knows what the equation looks like can ask, at every turn, what the missing terms are.

    For the Next Federal Statement

    Three questions to ask of any major rail project

    Each question follows naturally from the ledger framework. None presupposes opposition to any project. Each is the kind of question the equation requires to be answered before any reader can form a judgment.

    1. On the cost side

    What is the annual capital service figure at the stated capex, and over what amortisation period? What is the annual operating cost figure at the planned service level? Are the two reported separately, or aggregated under a single label that conflates them?

    2. On the revenue side

    At what fare is the stated ridership achievable on the relevant modal-shift S-curves? Does the (fare, ridership) pair sit on the corridor’s achievable frontier, or does it require modal-shift behaviour the international evidence does not support?

    3. On the closing terms

    What is the implied annual public subsidy at the stated capex, operating cost, and farebox revenue? Is land value capture being assumed as a financing source? If so, through what disclosed instrument? If not, is the LVC term acknowledged to be zero, and the subsidy term enlarged correspondingly?

    None of these questions presupposes a view about whether ALTO should be built. Each is the kind of question a reasonable reader would ask before forming a view. Each is also the kind of question the parliamentary record has so far not been pressed to answer in the terms the equation requires.

    Sources

    Methodology and supporting documents

    This brief is a synthesis of the analytical methodology developed in the Initiative’s full methodology paper, A Framework for Independent Evaluation of the ALTO HSR Project (May 2026). The methodology paper contains the detailed derivations, reference-class calibrations, and stage-by-stage rubrics summarised here.

    1.ALTO HSR Citizen Research Initiative, A Framework for Independent Evaluation of the ALTO HSR Project (Methodology Paper), May 2026 — the annual fiscal ledger framework, Section 2; the seven-stage analytical pipeline, Sections 3 through 7.
    2.Capital service calibration — CAPEX Notes 1 through 4: Engineering Complexity Rubric; ALTO Engineering Complexity Scorecard; Community Friction and HSR Cost (international comparative analysis); Engineering Complexity and Community Friction as joint predictors of HSR cost.
    3.Operating cost — O&M Notes 1 through 3: Infrastructure Maintenance Costs for HSR; Operating Costs for HSR; Combined Cost Recovery for ALTO HSR.
    4.Modal-shift frontier — MS Notes 1 through 4: Air-rail modal-shift S-curve; Road-rail modal-shift S-curve; ALTO HSR ridership envelope 2035–2080; Subsidy frontier and optimisation.
    5.Land value capture analysis — Methodology Paper, Section 2 (LVC paragraph); LVC Note 1 (assessing the $12 billion claim in the McGill TRAM financial model).
    6.Order Paper Question Q-923, 45th Parliament, 1st session. Asked by Philip Lawrence MP (Northumberland–Clarke), March 5, 2026; answered by the Minister of Transport, April 22, 2026; reply signed by Mike Kelloway, Parliamentary Secretary. ourcommons.ca
    7.ALTO HSR Citizen Research Initiative, Reading the Answer (Cost & Ridership Brief), May 2026 — the companion brief reading the three numerical claims in Q-923 against the academic record.
    8.ALTO HSR Citizen Research Initiative, Reading the Footnote (Cost Estimation Brief), May 2026 — the companion brief on the AACE Class 5 classification and what it implies for the $60–90 billion figure.
    9.ALTO HSR Citizen Research Initiative, The Report That Vanished (Parliamentary Process Brief), May 2026 — the parliamentary record into which the Q-923 reply was placed.
  • Reading the Answer

    Reading the Answer

    What the government tells Parliament about ALTO’s cost, ridership and subsidies — and what two independent academic studies show.

    ⚠ Document Under Analysis

    On April 22, 2026, the Minister of Transport tabled the answer to Order Paper Question Q-923, asked by Philip Lawrence (MP for Northumberland–Clarke). Three numerical claims sit at the heart of that answer.

    Two independent academic analyses of the same corridor have been published by Canadian universities — one in 2025, one in 2021. Both reach quantitatively different conclusions. This brief sets them side by side.

    Critical Finding

    None of the three claims in Q-923 is factually inaccurate. Each is constructed using the most favourable available definition, range, or horizon. The result is a headline picture meaningfully different from the academic record on the same project.

    The brief looks at each claim in turn, sets the government’s wording next to the academic finding, and asks the simple question: is the government’s framing realistic?

    Download
    Reading the Answer — Full Brief (PDF)
    The three numerical claims in Q-923 (cost, ridership, subsidies), set side by side with the published academic record from McGill and the Munk School Global Economic Policy Lab
    Download PDF
    The Three Claims

    What Q-923 says

    On March 5, 2026, MP Philip Lawrence submitted Order Paper Question Q-923, asking the government about the financial viability of the ALTO project. The Minister of Transport’s answer, tabled in the House of Commons on April 22, 2026, contained three specific numerical statements.

    On subsidies
    “Self-sustaining”
    operations expected to cover their own costs — “no need for ongoing operating subsidies”
    On cost
    $60–90 B
    stated range for total project cost — classified by ALTO as AACE Class 5 (−50%/+100% accuracy band)
    On ridership
    43 M / year
    forecast for 2084 — year 55 of operations, if construction begins in 2029 as planned

    Each of these three propositions is the subject of this brief. Each is technically defensible. Neither is, on the academic record now publicly available, the only available framing of what is being described.

    The Academic Record

    Two independent studies of the same corridor

    Two academic analyses of the ALTO corridor are publicly available. They differ in age, scope, methodology and authority. They reach quantitatively similar conclusions on the questions both address.

    McGill University — Transportation Research at McGill (2025)

    The primary academic comparator. Zhang, Negm and El-Geneidy, High-Speed Rail in Canada: Insights from a corridorwide survey and a financial analysis. Combines a 6,738-respondent travel-demand survey across six Census Metropolitan Areas with a 50-year financial model that uses ALTO’s own published cost assumptions as its inputs. Funded by Queen’s University and NSERC. Describes high-speed rail throughout in favourable terms — the study is not advocacy against the project.

    Munk School (Toronto) — Global Economic Policy Lab (2021)

    An earlier independent reference point. Bien, Iqbal, Li and Stecher, under Lab Director Professor Mark Manger. High-Speed Rail: Toronto – Montreal Economic Analysis. Prepared by graduate-level “Clean Energy Analysts” within the Lab. Not a peer-reviewed publication. Covers the Toronto–Montreal segment only (540 km), not the full corridor; figures in 2021 dollars. Written four years before the formal ALTO process began. Its value here is as an early, independent reference point reaching conclusions consistent with the more recent McGill work.

    The brief below treats McGill as the primary academic comparator. Munk is cited where it provides confirming or complementary evidence on the questions both studies address.

    Claim by Claim

    The government’s framing, beside the academic finding

    For each of the three claims in Q-923, the wording of the parliamentary answer is set beside what the McGill and Munk studies show. The pattern at all three points is the same.

    Claim 01 On subsidies
    The government says

    “Operations are expected to be financially self-sustaining, with revenues covering operations and maintenance costs and eliminating the need for ongoing operating subsidies.”

    Minister of Transport, response to Q-923 (April 22, 2026)

    The academic record shows

    McGill (2025): Operations cover their own costs at full ridership. Capital must be repaid by public funds at ~C$1.23 billion per year for 47 years, totalling approximately C$61.62 billion before full cost recovery in year 48.

    Munk (2021): Operations cover their costs at a breakeven ticket of C$109. At a more affordable C$75 ticket, the Toronto–Montreal segment alone requires C$5.08 billion in subsidy. The construction phase is publicly financed in both models.

    Why this matters The government defines “subsidy” narrowly — the operating cash transfer required to keep trains running once they are running. The academic studies extend the analysis to capital servicing, which is the much larger lifetime public obligation. A useful way to think about it: a homeowner who rents out a basement suite can truthfully say the rental income covers their utilities and property tax. But the mortgage is still being paid every month, from a different account, on a different schedule. “The suite pays for itself” is technically accurate; it is also not a complete description of the cost of owning the house. ALTO operations being “self-sustaining” is the same kind of statement. The mortgage — roughly C$1.23 billion per year, for 47 years — is still being paid by the public. A reader who treats “self-sustaining” as a description of the project’s lifetime public cost is reading it against the narrowest available technical definition.
    Claim 02 On cost
    The government says

    “Between $60 and $90 billion.”

    Q-923 (April 22, 2026). ALTO’s May 8, 2026 blog post classifies the same figure as an AACE Class 5 estimate — an accuracy range of −50% to +100%.

    The academic record shows

    McGill (2025): Total construction cost C$79.8 billion in 2025 dollars for the full corridor — sits in the upper portion of the government’s range.

    Munk (2021): C$11.94 billion in 2021 dollars for the Toronto–Montreal segment alone, with a 66% contingency already built in. Methodologies and scopes are not directly comparable; neither extrapolates straightforwardly to the other.

    Why this matters The government’s stated range is wide enough to encompass quite different methodological approaches. The accuracy band attached to the underlying Class 5 classification — addressed in the Initiative’s companion brief Reading the Footnote — extends the realistic outturn substantially beyond the stated upper bound. “$60 to $90 billion” is doing the work of multiple very different underlying assumptions. Access to Information documents published by The Canadian Press on May 28, 2025 also show that the corporation now answering for the $60–90 billion figure was, beginning in September 2023, paying a marketing firm to rebrand the project from HFR to HSR — eighteen months before any HSR-specific cost analysis had been tabled to Parliament. The companion brief The Report That Vanished sets out that record in detail.
    Claim 03 On ridership
    The government says

    “43 million annual riders by 2084.”

    Q-923 (April 22, 2026). With construction beginning in 2029, this corresponds to approximately year 55 of operations.

    The academic record shows

    McGill (2025): 20.8 million annual riders on the full corridor by year 50 of operations.

    Munk (2021): 10.45 million annual riders on the Toronto–Montreal segment by year 30. Using Munk’s own observation that this segment generates ~57% of full-corridor ridership, this implies ~18 million annual full-corridor riders by year 30. The two academic projections converge within 15%; both are approximately half the government figure.

    Why this matters The government’s 43 million figure is roughly twice the academic consensus and is attached to a horizon two to three decades later than the academic projections. By selecting the latest available year and roughly doubling the mature-corridor ridership the academic studies support, the answer constructs a number that is neither directly comparable to the published analyses nor easily falsifiable for several more decades.
    How the Project Changed

    A short chronology

    The three numerical claims in Q-923 are the most recent point in a project whose definition has shifted substantially over eight years. Understanding why the government’s figures differ from the academic record requires understanding how the thing being costed and forecast changed shape along the way. The sequence below is drawn from the public parliamentary record, principally the September 2024 committee report and the Government Response tabled in October 2025.

    2016–2021 — A VIA Rail proposal for higher frequency, not higher speed. The project began as a VIA Rail concept assessed under Budget 2018. Its defining objective was frequency and reliability on dedicated track, not top speed. A witness who had worked on the original proposal told the committee it was “decision-ready by summer of 2018” and could have been in service by 2025. The estimate publicly associated with that early concept was approximately $12 billion.

    2022–2023 — Procurement, with the scope deliberately left open. A federal Crown corporation was incorporated in late 2022 to manage the project, and a procurement phase launched. Three consortia were invited to bid. Crucially, bidders were asked to submit two options: one running at up to 200 km/h, and one with some high-speed segments to reduce overall travel time. The corporation’s own leadership repeatedly told the committee that the scope, technology, and route were not yet defined, and that it would be “imprudent to throw numbers out, because the scope is not defined.” The 2021 $12 billion figure was confirmed to the committee as “probably not adequate anymore,” but no replacement figure was offered.

    September 2024 — The committee reports, still on the frequency-first premise. The committee tabled its 18-recommendation report under the title Issues and Opportunities: High Frequency Rail in the Toronto to Quebec City Corridor. The report is framed throughout around high-frequency rail. Its recommendations asked the government to define cost and timetable (including an explicit analysis of the incremental cost between the higher-frequency and high-speed options), to release the unredacted Joint Project Office report, and to analyse the effect of a dedicated line on existing VIA Rail service. The premise of the report was that the speed question remained open and that the cost difference between the two options had not been established.

    February 2025 — The pivot to high-speed rail. The government announced on February 19, 2025 that the scope of the project would shift to delivering high-speed rail. This is the decision that resolves the speed question the committee had treated as open — and it resolves it toward the more expensive of the two procurement options, the one requiring a fully protected, fenced right-of-way without at-grade crossings. The decision was made before the committee’s requested incremental-cost analysis had been produced. Access to Information records indicate the rebranding toward this framing had been operationally under way since September 2023, some seventeen months before the public announcement.

    March–September 2025 — Partner selected, timeline halved. The procurement concluded with the selection of a private developer partner, and a Pre-Development Agreement was signed on March 19, 2025, launching a multi-year co-development phase. On September 11, 2025, the government announced that construction would now be accelerated to begin in four years rather than the original eight — even as the Government Response would shortly confirm that “all costing information remains subject to change” through co-development.

    October 2025–April 2026 — The Response, then the figures. The Government Response to the committee’s report was finally tabled on October 10, 2025, more than a year after the report itself. It agreed with the intent of all 18 recommendations but downgraded several of the most consequential — including the cost-and-timetable recommendation and the release of the unredacted Joint Project Office report — to support “in principle,” deferring substance to the co-development phase. The incremental HFR-versus-HSR cost analysis the committee had asked for was never produced as such. Q-923, answered on April 22, 2026, then placed firm-sounding figures — $60 to $90 billion, 43 million riders, no operating subsidy — on a project whose own governing documents still described its costs as undefined.

    The throughline is this: the project began as a frequency-first concept with a roughly $12 billion estimate, was procured with its scope deliberately undefined, was redirected to high-speed rail before the cost comparison the committee requested had been done, had its construction timeline halved while its costs were still officially “subject to change,” and only then acquired the specific $60–90 billion and 43-million-rider figures that Q-923 presents. The figures did not emerge from a defined scope; the scope was redefined around an ambition, and the figures followed. That is the context the academic comparison in this brief is read against.

    The Disclosure Context

    The parliamentary record Q-923 sits in

    Q-923 was answered on April 22, 2026. As the chronology above sets out, the parliamentary record on ALTO that surrounds it is materially thinner than it might otherwise have been. The committee’s 18-recommendation report asked specifically for an HFR-versus-HSR cost analysis (Recommendation 4), the release of the Joint Project Office’s full unredacted report (Recommendation 6), and an analysis of the impact of a dedicated rail line on existing VIA Rail service (Recommendation 8). The first of these was never produced as such; the second was downgraded to release “in principle” in redacted form. The $60–90 billion figure cited in Q-923 therefore sits within a disclosure context in which the central cost question the committee posed was redirected rather than answered.

    The Initiative’s companion brief The Report That Vanished sets out this parliamentary-process record in detail — the documentary evidence on the marketing-led pivot, the procedural mechanics of prorogation, and the parliamentary mechanisms by which the unanswered recommendations remain available to be revived. The two briefs are intended to be read together: Reading the Answer documents the headline framing of the three specific numerical claims in Q-923, and The Report That Vanished documents the parliamentary record into which those claims were placed.

    Side by Side

    Same project, three different pictures

    Read as one comparison, the three claim cards point in the same direction at every turn. The government’s number describes the largest, latest, or narrowest-defined version of each quantity. The academic record describes a more constrained or more comprehensively defined version.

    Subsidies

    Gov:No operating subsidies

    Acad:~C$61.6 B over 47 yrs (capital)

    Cost

    Gov:$60–90 B (Class 5)

    Acad:C$11.9 B (T–M) — C$79.8 B (full)

    Ridership

    Gov:43 M/yr by 2084 (yr 55)

    Acad:~18–21 M/yr (yr 30–50)

    No single divergence, taken alone, would carry the weight of an argument. Stacked together — cost, ridership, subsidies, all framed in the most favourable way each can be framed — they describe a pattern. The pattern is the brief’s subject.

    The honest answer

    Is the government’s framing realistic?

    The answer depends on what “realistic” is asked to mean.

    If realistic means technically defensible — yes. Each of the three figures in Q-923 can be constructed using some defensible technical methodology. The Minister’s answer is a carefully drafted parliamentary response that would survive most reasonable tests of literal accuracy.

    If realistic means consistent with the picture an informed reader would expect — the answer is more complicated. Two independent academic studies, written by different teams under different funding, with no involvement in the ALTO process, converge on a project that:

    • carries roughly half the ridership the government’s 2084 figure implies, at a horizon two to three decades earlier;
    • requires substantial sustained public capital subsidy over four to five decades, even when operations cover their own costs;
    • could plausibly cost as much as the upper end of the government’s range, or, depending on methodology, materially less.

    The framing in Q-923 is technically defensible. It is not the only available framing of the same underlying material. It is the framing that produces the most favourable headline impression at each of the three points where a choice could be made. Whether to characterise it as “realistic” is finally a judgment for the reader. What this brief documents is that the framing is a choice, and that the academic record provides the basis for reading what each statement leaves out.

    For the next federal statement

    Three questions to ask

    Where the next federal statement on ALTO is concerned — whether in a future Order Paper answer, a ministerial statement, a corporate plan summary, or a public communication from ALTO itself — three questions follow naturally.

    1. On subsidies: What definition is being applied? Does the figure cover operations only, or operations and capital servicing? If capital servicing is excluded, what is its size and duration, and over what time horizon is the public obligation expected to extend?
    2. On cost: What is the basis of the figure? Bottom-up engineering estimate, reference-class-adjusted estimate, or some other methodology? What accuracy band does it carry? Where does the figure sit relative to comparable international HSR projects, adjusted for distance, geography, and construction context?
    3. On ridership: At what horizon is the figure cited? How does it compare to the academic projections at the same horizon? If the comparison is unfavourable, on what basis is the higher figure defended? What sensitivity analysis has been conducted, and what does it show?

    None of these questions presupposes opposition to the project. Each is the kind of question a reasonable reader would ask before forming a view. Each is also the kind of question the parliamentary record has so far not been pressed to answer.

    Download Full Brief
    Reading the Answer (PDF)
    Reference document for federal decision-makers, parliamentarians, journalists, and constituents tracking the file
    Download PDF
    Sources

    Primary documents and references

    1.
    Order Paper Question Q-923, 45th Parliament, 1st session. Asked by Philip Lawrence (MP for Northumberland–Clarke), March 5, 2026; answered by the Minister of Transport and Leader of the Government in the House of Commons, April 22, 2026. ourcommons.ca
    2.
    The Canadian Press, “Via Rail subsidiary paid Quebec marketing firm $330K as it pivoted to high-speed rail,” May 28, 2025. The Globe and Mail published a parallel report on the same Access to Information disclosures the same day. theglobeandmail.com
    3.
    Zhang, B., Negm, H., & El-Geneidy, A. (2025). High-Speed Rail in Canada: Insights from a corridorwide survey and a financial analysis. Transportation Research at McGill, McGill University. Funded by Queen’s University and the Natural Sciences and Engineering Research Council of Canada (NSERC).
    4.
    Bien, P., Iqbal, S., Li, A., & Stecher, I. (2021). High-Speed Rail: Toronto – Montreal Economic Analysis. Global Economic Policy Lab, Munk School of Global Affairs & Public Policy, University of Toronto. Lab Director: Professor Mark Manger.
    5.
    ALTO, “How Much Will Alto’s High-Speed Rail Cost Canadians and how is it Funded?”, blog post published May 8, 2026 — source of the AACE Class 5 classification of the $60–90 billion figure. altotrain.ca
    6.
    ALTO HSR Citizen Research Initiative, Reading the Footnote (Cost Estimation Brief), May 2026 — the companion brief analysing the AACE Class 5 footnote in detail.
    7.
    ALTO HSR Citizen Research Initiative, The Report That Vanished (Parliamentary Process Brief), May 2026 — the companion brief setting out the TRAN Report 18 record, the documented marketing-led HFR-to-HSR pivot, and the procedural mechanisms by which the committee’s recommendations remain unanswered.
  • Two targets

    Two Targets

    Ridership figures in ALTO’s 2025-26 Corporate Plan and current public materials, side by side.

    In current ALTO materials

    ALTO’s Corporate Plan Summary 2025-2026 to 2029-30 — the formal accountability document submitted to the Minister of Transport for Treasury Board approval, signed by the Chief Financial Officer in January 2025 — cites a Project Outcome of at least 17 million annual passenger trips by 2059, defined to include “both Alto Passenger Rail Services and Local Services.”

    ALTO’s consultation website, as of May 6, 2026, continues to host a CEO opinion piece projecting 24 million passengers annually by 2055, “fully consistent with international outcomes.” A Globe and Mail editorial citing the same source extended this to 43 million by the 2080s. altotrain.ca

    Summary

    Two ridership figures currently appear in ALTO documents. The figure listed as Project Outcome #1 in the Corporate Plan submitted for Treasury Board approval is 17 million by 2059, defined to include both Alto Passenger Rail Services and the continuation of VIA Rail’s conventional Local Services. The figure in current public-facing materials is 24 million by 2055, rising to 43 million by 2084, presented in reference to Alto.

    The 17 million figure is the same target set in the 2023 Request for Qualifications, when the project was specified as 177 km/h High Frequency Rail at an estimated capital cost of $27.7 billion. It carries forward into the current Corporate Plan, which describes the project as 300 km/h high-speed rail at a Class 4 capital cost estimate of $60–90 billion. The Corporate Plan does not record a formal revision of the figure when the specification changed.

    This brief sets out what each document says, when each figure was published, and what other publicly available evidence indicates about ridership at the corridor scale. It does not draw conclusions about which figure is the operative one. The purpose is to make the documentary record visible.

    Download
    Two Targets — Full Brief (PDF)
    Documentary record of ALTO ridership figures across 2021–2026 publications
    Download PDF
    The Setting

    Why ridership figures matter for accountability

    A megaproject’s ridership projection anchors several other figures: the revenue model, the benefit-cost ratio, the modal-shift carbon argument, and the agglomeration economic case. When a ridership projection moves, related figures move with it.

    For ALTO, two ridership figures are currently visible in the public record. They appear in different documents, communicated to different audiences. This brief sets the two figures alongside each other, with the document trail and the available comparator evidence, and identifies the questions that would resolve which figure is the operative one.

    The brief is not an assessment of either figure on the merits. It is an assemblage of what has been published, in chronological order, with the structural definitions of each figure made explicit. Readers are invited to draw their own conclusions.

    A note on dating the Corporate Plan

    The Corporate Plan Summary 2025-26 to 2029-30 carries a CFO attestation dated January 7, 2025. Several elements of its content, however, post-date that signature: it describes the February 2025 HSR announcement and Cadence selection, the March 2025 PDA execution, Stage 1 of Co-Development as having “occurred from April 2025 to July 2025,” and workforce figures “as of May 2025.” Appendix 12’s chronology ends with August 2025. The document was therefore finalised in approximately mid-2025, with the CFO attestation date preserved as the formal accountability anchor. References in this brief to the Corporate Plan should be read with that timing in mind.

    Side by Side

    The two figures, in their own words

    Both figures appear in current ALTO materials. Both are being communicated to different audiences in May 2026.

    Public Materials · May 6, 2026Corporate Plan to Treasury Board · 2025-26
    24 million by 2055, rising to 43 million by 2084

    From the Imbleau opinion piece originally published in the Toronto Star and La Presse on April 17, 2026, reposted on the consultation site as of May 6, 2026:

    “Alto’s projected 24 million passengers annually by 2055 is fully consistent with international outcomes, based on the modelling used worldwide.”

    The Globe and Mail editorial citing the same source extended this to “43 million by the 2080s, up from three million today.”

    This figure is referenced in connection with the project’s benefit-cost claims, the 1.1% GDP uplift estimate, and the 50,000-job projection.
    At least 17 million by 2059

    From the Corporate Plan Summary 2025-26 to 2029-30, Project Outcome #1, signed by the CFO January 7, 2025:

    “Significantly Increase Intercity Rail Passengers to at least 17 million by 2059 through both the new passenger rail services (NPRS Services) and Local Services through increased annual seat capacity.”

    The same figure appears in Appendix 9 (Long-term Outcomes) as: “up from 4.8 million in 2019, including both Alto Passenger Rail Services and Local Services.”

    This is the figure listed as a Project Outcome in the document submitted for Treasury Board approval.

    Three observations about the two figures, drawn from the documents themselves:

    The 17 million figure includes Local Services

    The Corporate Plan target counts “Alto Passenger Rail Services and Local Services” together. Local Services is the planning term, defined in the Corporate Plan’s glossary, for VIA Rail’s continuing conventional service in the Quebec City–Windsor corridor. The 24 million public figure, as presented, is referenced in connection with Alto. The two figures therefore measure across different scopes.

    The 17 million figure carries forward unchanged from the 2023 RFQ

    17 million by 2059 was the Project Outcome attached to the 2023 Request for Qualifications, when the project was specified as 177 km/h High Frequency Rail at an estimated capital cost of $27.7 billion. The same figure, with the same target year, appears in the Corporate Plan that describes the project as 300 km/h high-speed rail at a Class 4 cost estimate of $60–90 billion. Project Outcomes are formally established in procurement documents and are not trivially revised; the Corporate Plan does not record a revision to this figure on either the specification change or the cost-envelope change.

    The two figures use different baseline years

    The Corporate Plan cites a 4.8 million baseline from 2019 (pre-COVID). The Imbleau opinion piece cites “three million today.” VIA Rail’s 2024 Annual Report records 4.19 million corridor passengers, of which 3.34 million on Corridor East. The growth multiplier from each baseline to its corresponding target therefore differs.

    Document Trail

    When each figure was published

    The chronology below sets out the principal ALTO ridership figures in the public record, in order of publication.

    DateDocumentHeadline ridership figure
    December 2021 JPO Business Case Update v.002
    VIA / CIB internal (released via ATI, November 2025)
    405M cumulative30-year cumulative trips 2030–2059 for HFR Electric scenario, an average of approximately 13.5 million per year. BCR ~ 0.4. NPV −$21.1 billion.
    February 2023 Request for Qualifications (HFR)
    PSPC, 126 pp.
    17M by 2059The Project Outcome attached to the 177 km/h HFR specification at an approximate $27.7B capital cost. Zero operating subsidy was a parallel commitment.
    February 2025 HSR announcement
    Government of Canada
    Specification changeProject rebranded from 177 km/h HFR to 300 km/h HSR. Cadence selected as Private Developer Partner. $3.9B Co-Development Phase funding announced.
    March 2025 Fast Forward: Shaping Canada’s Future
    ALTO public document
    24M by 2055
    43M by 2084
    Stated baseline of “3 million today.” Used in subsequent ALTO public materials and consultation graphics; cited in the Globe and Mail editorial.
    CFO signature
    Jan 7, 2025
    (finalised
    mid-2025)
    Corporate Plan Summary 2025-26 to 2029-30
    Treasury Board submission
    17M by 2059Listed as Project Outcome #1. Defined to include “both Alto Passenger Rail Services and Local Services.” 4.8M (2019) baseline. CFO attestation dated January 7, 2025; document content references events through summer 2025.
    April 17, 2026 Imbleau opinion piece
    Toronto Star · La Presse · ALTO website
    24M by 2055Published one week before the consultation deadline. Described as “fully consistent with international outcomes, based on the modelling used worldwide.” Reposted on ALTO’s consultation site, where it remains as of May 6, 2026.

    The chronology has a feature worth surfacing on its own. The 24 million and 43 million figures first appear in the Fast Forward document of March 2025. The Corporate Plan, finalised in approximately mid-2025, references only the 17 million figure as a Project Outcome and does not mention, footnote, or otherwise acknowledge the higher Fast Forward figures. The April 2026 Imbleau opinion piece reverts to the 24 million figure for public-facing communications.

    In other words: since at least March 2025, the two figures have been running on parallel tracks. The lower figure has appeared in formal accountability documents (the Corporate Plan submitted for Treasury Board approval). The higher figure has appeared in public-facing communications (the Fast Forward document, the consultation website, the CEO’s opinion pieces, and external commentary citing them). Neither document has reconciled the two, and neither has stated which is the operative ridership target.

    Adjacent Disclosure

    The cost figure, in the same period

    The Imbleau opinion piece of April 17, 2026 contains the following statement on the project’s capital cost:

    “In order to finalize project cost, we need to know what is being built and where. We must choose the best alignment through consultation. Then comes detailed engineering for bridges, tunnels and the design; a 320 km/h train requires millimeter level precision.”

    The publicly cited Class 4 capital cost estimate is $60–90 billion. The Co-Development Phase funding of $3.9 billion has been approved and is being expended over fiscal years 2024-25 to 2029-30 per the Corporate Plan. The CEO’s statement above appears in the same publication on the same day as the 24 million ridership figure cited earlier in this brief.

    This brief makes no inference about the relationship between the cost statement and the ridership figures. They are presented here together because they appear in the same document and are part of the documentary record currently available to the public.

    Comparator Evidence

    Other publicly available ridership analyses for the corridor

    For context, three additional sources of corridor ridership analysis are part of the public record. Each uses a different methodology and a different scope.

    Munk School Global Economic Policy Lab (Toronto–Montréal segment only)

    The University of Toronto’s Global Economic Policy Lab published an analysis projecting 9.44 million annual passengers by year 20 and 10.45 million by year 30 on the Toronto–Montréal segment, which the GEPL identified as generating 57% of total corridor ridership. Scaled to the full corridor on the GEPL’s own segment-share assumption, this implies approximately 16–17 million by year 20. This is the only independent academic modelling exercise for the corridor that has been published with a disclosed methodology.

    JPO Business Case Update v.002 (December 2021, ATI release)

    The Joint Project Office Business Case Update released through Access to Information by the Canada Infrastructure Bank in November 2025 projects 405 million cumulative trips over 30 years (2030–2059) for the HFR Electric scenario, an average of approximately 13.5 million per year. The same document records a benefit-cost ratio of approximately 0.4 and a 30-year NPV of −$21.1 billion against a $27.7B capital cost baseline.

    VIA Rail Annual Report 2024 (current corridor baseline)

    The most recent published actual corridor ridership figure is 4,191,080 passengers in 2024, of which 3,336,057 on Corridor East (Quebec City–Toronto). The Montréal–Ottawa–Toronto segment alone carried 2,314,024 passengers. These figures were achieved with on-time performance averaging 51% for the year.

    No reconciliation between the ALTO 17 million Corporate Plan figure, the ALTO 24 million public figure, and these comparator analyses has been published.

    From the Documentary Record

    Five things visible in the public record

    Without drawing inferences about motive or intent, five observations can be made directly from the documents reviewed for this brief.

    1. The two figures have been running on parallel tracks since March 2025

    The 24 million figure was introduced in the Fast Forward document of March 2025. The Corporate Plan was finalised in approximately mid-2025; it references only the 17 million figure as a Project Outcome and does not mention or footnote the Fast Forward figures. Both figures remain in active circulation in May 2026: the 17 million figure in the Corporate Plan, the 24 million figure in the consultation website and the CEO’s April 2026 opinion piece.

    2. The two figures have different scopes

    The 17 million figure is defined as “Alto Passenger Rail Services and Local Services” combined. The 24 million figure, as presented in the Imbleau opinion piece, references Alto. The Corporate Plan does not break the 17 million figure into Alto-component and Local-Services-component shares.

    3. The 17 million figure was set under the previous specification

    17 million by 2059 was the Project Outcome attached to the 2023 RFQ for the 177 km/h HFR specification at $27.7B. The same figure carries forward into the Corporate Plan that describes the project as 300 km/h HSR at $60–90B, without a recorded revision to the target.

    4. The capital cost is also presented as a working figure

    The CEO has publicly stated that “in order to finalize project cost, we need to know what is being built and where.” The Class 4 estimate of $60–90 billion is, on this account, a working figure pending corridor selection and detailed engineering. The Co-Development Phase funding of $3.9 billion has been approved and is being expended.

    5. Independent ridership review remains unpublished

    The Parliamentary Budget Officer has not published a review of either the cost or the ridership figures. The only independent academic modelling exercise for the corridor with a disclosed methodology, the Munk School GEPL analysis, projects approximately 16–17 million for the full corridor by year 20 of operation.

    Where things stand · May 6, 2026

    Disclosure ledger

    The following items are, or are not, currently in the public record.

    Disclosed
    Corporate Plan ridership figure: 17 million by 2059, including Alto Passenger Rail Services and Local Services. Corporate Plan Summary 2025-26 to 2029-30, Project Outcome #1.
    Disclosed
    Public-facing ridership figure: 24 million by 2055, rising to 43 million by 2084. Fast Forward (March 2025); Imbleau opinion piece (April 2026); ALTO consultation website (current).
    Partial
    Definition of the 17M target. Disclosed in Appendix 9 of the Corporate Plan as including Local Services, but not surfaced in summary communications about the figure.
    Not disclosed
    Demand modelling methodology for either the 17 million or the 24 million figure. No model documentation, elasticity assumptions, modal-shift coefficients, or sensitivity analysis has been published for either figure.
    Not disclosed
    Reconciliation between the two figures. No public ALTO statement explaining the relationship between the Corporate Plan figure and the public-marketing figure, or stating which is intended to be the operative ridership target.
    Not disclosed
    The Alto-only share of the 17M target. The Corporate Plan does not break the 17 million into the share attributable to high-speed services and the share attributable to Local Services.
    Not disclosed
    Updated benefit-cost ratio for the current 300 km/h HSR specification at $60–90 billion capital cost against the 17M ridership target. The last published BCR (~0.4) was calculated against the $27.7B HFR specification.
    Not disclosed
    Door-to-door journey time projection from representative origin points, accounting for the now-likely suburban Toronto station and Tremblay Ottawa terminus. The 24M figure is presumed to assume downtown-to-downtown service that is no longer the operating reality.
    Not disclosed
    Independent demand audit results from the Parliamentary Budget Officer or comparable independent body, against either the 17M or the 24M figure.
    Download Full Brief
    Two Targets (PDF)
    Documentary record of ALTO ridership figures, with comparator analyses
    Download PDF
    Questions for the Minister and the PBO

    Six questions that would resolve the disclosure gaps

    The following questions, addressed to the Minister of Transport and to the Parliamentary Budget Officer, would surface the items currently undisclosed.

    Question 1 “Which is ALTO’s operative ridership target: the 17 million by 2059 figure in the Corporate Plan submitted for Treasury Board approval, or the 24 million by 2055 figure in the Corporation’s consultation materials and the CEO’s opinion pieces?”
    Question 2 “Will ALTO publish a breakdown of the 17 million Project Outcome figure into the share attributable to Alto Passenger Rail Services and the share attributable to Local Services?”
    Question 3 “Will ALTO publish the demand modelling methodology, elasticity assumptions, modal-shift coefficients, and sensitivity ranges underpinning both the 17 million and the 24 million figures?”
    Question 4 “What is the updated benefit-cost ratio for the current 300 km/h high-speed rail specification at the Class 4 capital cost estimate of $60–90 billion, calculated against the 17 million Treasury Board ridership target?”
    Question 5 “Has the Parliamentary Budget Officer been asked to review the ridership and cost figures underpinning ALTO’s benefit-cost case, and if so, what is the expected timeline for publication of that review?”
    Question 6 “Given the Corporation’s acknowledgment that ‘in order to finalize project cost, we need to know what is being built and where,’ what is the formal status of the $60–90 billion capital cost figure relative to the $3.9 billion in Co-Development Phase funding already committed?”
    Sources

    Primary documents

    1.
    VIA HFR–VIA TGF Inc. (Alto), “Corporate Plan Summary 2025-2026 to 2029-30,” submitted to the Minister of Transport for Treasury Board approval, signed by the Chief Financial Officer January 7, 2025. Project Outcome #1 (Executive Summary, Appendix 2, Appendix 9, Appendix 13).
    2.
    Martin Imbleau, “High-speed rail is not a leap of faith: Why it matters for Canada’s growth,” opinion piece published Toronto Star and La Presse, April 17, 2026; reposted on ALTO consultation website. altotrain.ca (retrieved May 6, 2026)
    3.
    ALTO, “Fast Forward: Shaping Canada’s Future with a High-Speed Rail Network,” explanatory document, March 2025.
    4.
    Public Services and Procurement Canada, “Request for Qualifications — High Frequency Rail Project (RFQ No. T8128-210188/C),” February 17, 2023. Project Outcomes including 17M ridership by 2059 and zero operating subsidy. 126 pages.
    5.
    VIA Rail Canada / Canada Infrastructure Bank, “JPO Business Case Update v.002,” December 2021. Released through Access to Information by CIB, November 2025. Source for 405M cumulative trips, BCR ~0.4, and 30-year NPV of −$21.1B for HFR Electric option.
    6.
    VIA Rail Canada, “Annual Report 2024,” published 2025. 2024 actual corridor ridership: 4,191,080 passengers; Corridor East subtotal: 3,336,057; Montréal–Ottawa–Toronto segment: 2,314,024.
    7.
    The Globe and Mail, editorial referencing ALTO ridership projections: “projected ridership numbers – 24 million trips annually, in the 2050s, rising to 43 million by the 2080s, up from three million today.”
    8.
    Munk School of Global Affairs and Public Policy, University of Toronto, Global Economic Policy Lab analysis of Toronto–Montréal HSR ridership: 9.44 million by year 20; 10.45 million by year 30 on Toronto–Montréal segment (57% of corridor).