Category: Post-consultation

  • Modal shift synthesis

    ALTO Ridership Against the Modal-Shift Evidence

    What the published 24-million target implies for how many travellers must abandon air and car for the train — and what the modal-shift evidence, the demographic baseline, and the operating-subsidy frontier say is actually reachable on the corridor.

    ⚠ What This Brief Synthesises

    This brief draws together four CRI research notes — on rail–air substitution (Note 1), rail–car substitution (Note 2), the ALTO ridership envelope (Note 3), and the operating-subsidy frontier (Note 4) — into a single test of one number: ALTO’s published target of 24 million annual passengers by 2055.

    Each note is built from the same starting point as the proponent’s own forecasts, but corrected for two things older studies omit: the North-American calibration of modal-shift behaviour, and the 2024 federal cap on non-permanent residents that broke the corridor’s demographic trajectory.

    Headline Finding

    ALTO’s published target of 24 million annual passengers by 2055 sits 2.6× above the CRI central case of 9.2 million, and is incompatible with every other independent forecast for the corridor.

    The gap is not a matter of optimism versus pessimism. Reaching 24M requires a modal share above the ceiling the modal-shift curves allow in a North-American setting; it assumes a population trajectory the federal government’s own immigration policy has already foreclosed; and pushing ridership toward the target through deeply discounted fares drives operating subsidy past $5 billion a year. The target fails three independent feasibility tests at once.

    Download
    ALTO Ridership Against the Modal-Shift Evidence — Full Slide Deck (PDF)
    Seven slides synthesising the modal-shift S-curves, the price families, the 2055 ridership envelope, and the three-test verdict on the 24-million target
    Download Deck
    The Four Underlying Notes
    The Question

    How many people would actually have to switch?

    A ridership target is, underneath, a claim about behaviour. To carry 24 million passengers a year, the corridor must persuade a very large share of the people now flying or driving between Toronto, Ottawa, Montreal and Quebec City to take the train instead. That share — the modal shift — is the quantity every forecast turns on, and it is the quantity this brief examines first.

    Modal shift is not a free parameter. Decades of evidence from operating high-speed lines show it follows a predictable shape: rail captures most of the market on short, fast journeys and loses it on long ones, with a sharp transition in between. The question for ALTO is not whether modal shift happens — it plainly does — but how high the curve can realistically reach on this corridor, in this country, at the fares the project would have to charge.

    Three forces set that ceiling: the journey-time geometry against air, the harder competition against the car in a North-American setting, and the price the traveller actually faces. The notes treat each in turn before combining them into a ridership envelope and testing the 24-million figure against it.

    Note 1 · Rail vs Air

    Modal shift versus air follows a logistic S-curve

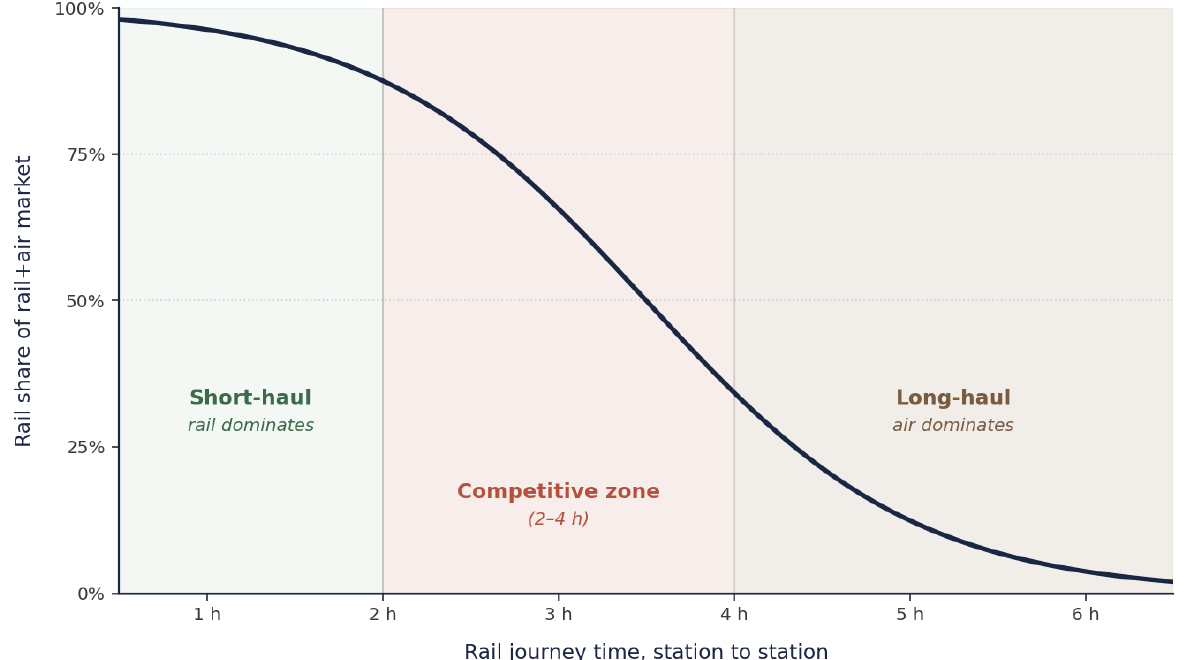
    Against air, rail’s market share is governed almost entirely by station-to-station journey time. The relationship is a logistic S-curve: below about two hours rail dominates, between two and four hours the two modes compete and infrastructure quality is decisive, and beyond about five hours rail share collapses to only the price-sensitive or rail-loyal traveller. The inflection point — where rail and air split the market evenly — sits at roughly 3.5 hours.

    < 2 h
    Rail dominates — near-full capture of the rail+air market
    2–4 h
    Competitive zone — 60–80% rail share, infrastructure decisive
    > 5 h
    Rail share collapses — only price-sensitive or rail-loyal travellers

    This is not theory. The world’s operating high-speed lines trace the same curve, and they are the empirical anchors the note is calibrated against:

    • Paris–Lyon (TGV): rail share rose from 40% to 72% after high-speed service opened.
    • Madrid–Barcelona (AVE): roughly 75% rail share at a 2 h 30 min journey time.
    • Madrid–Seville: rail share rose from 16% to 52%.
    • Beijing–Shanghai: 1,318 km covered in 4 h 18 min, rail-dominant despite the distance.

    For ALTO, the implication is straightforward: the air-substitution share the corridor can win is bounded by where each city-pair sits on this curve. Pairs that fall inside the two-to-four-hour competitive zone can deliver strong rail capture; pairs that fall outside it cannot, regardless of how the target is set.

    Note 2 · Rail vs Car

    Modal shift versus the car is harder in North America

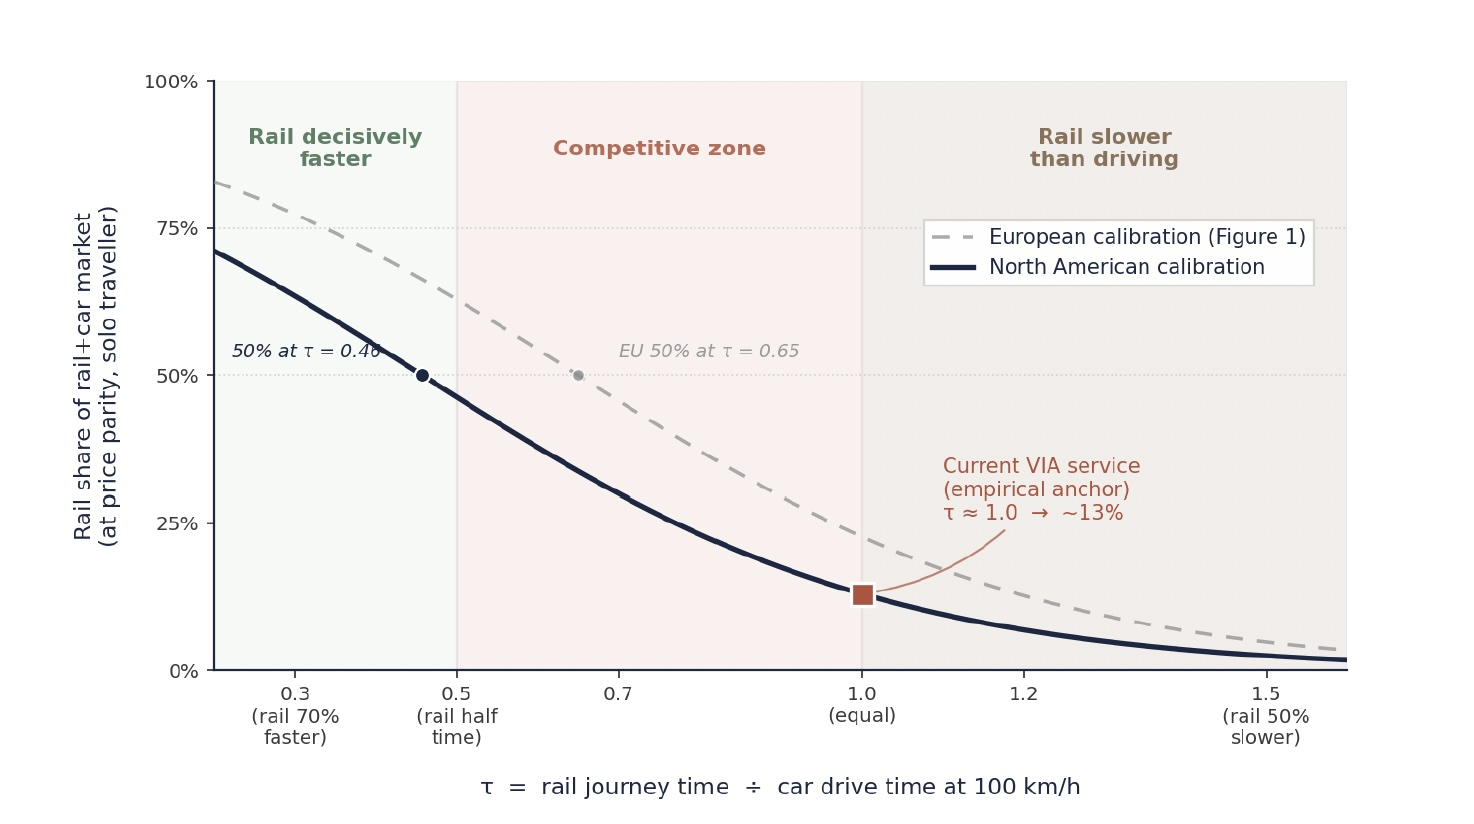
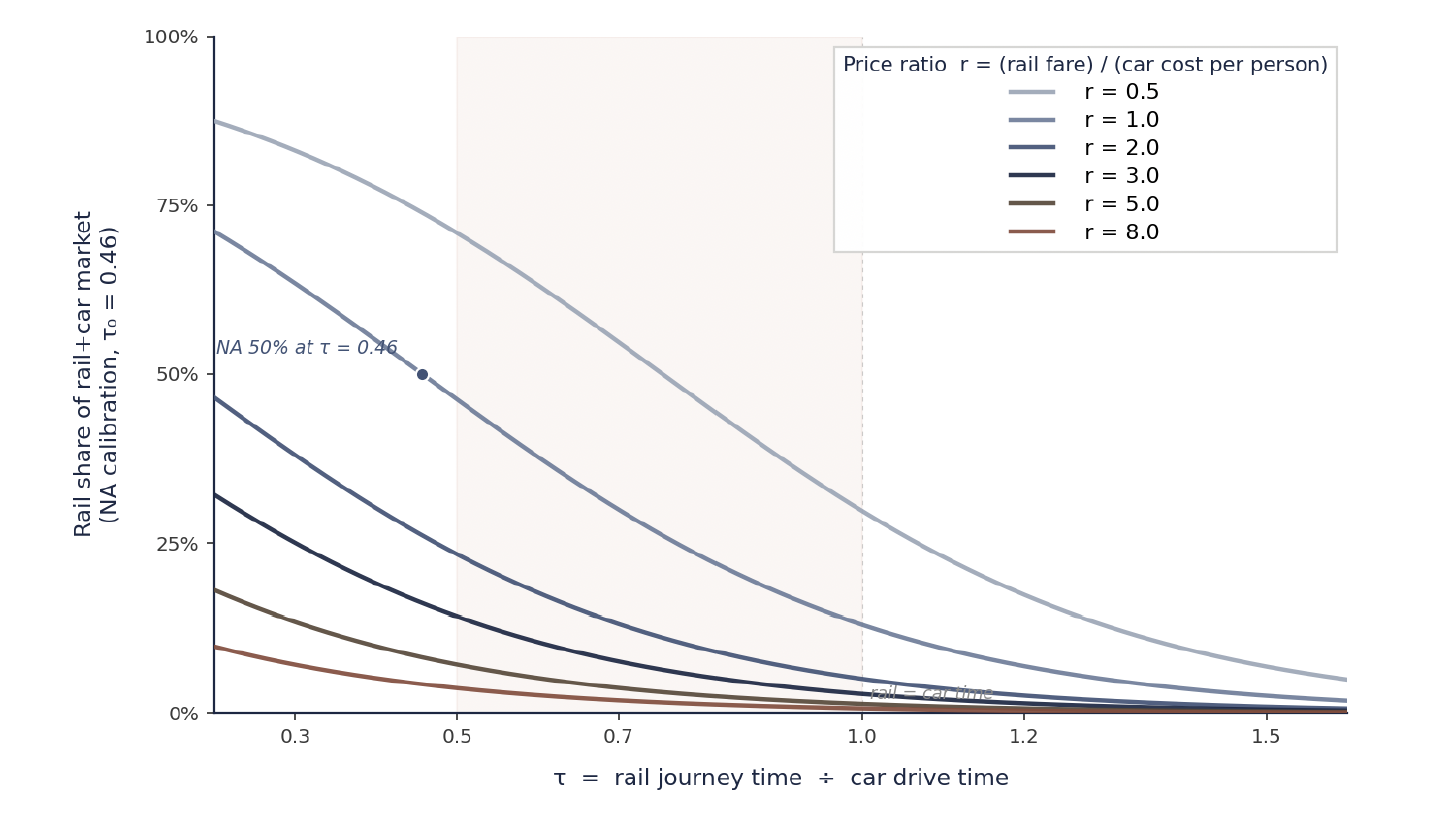
    The car is the larger and more stubborn competitor, and here the North-American context shifts the whole curve against rail. The note re-calibrates the rail-vs-car S-curve on VIA Rail’s observed performance — a rail share of roughly 13% against road — and finds the inflection point moves sharply left: from τ = 0.65 in the European setting to τ = 0.46 in the North-American one, a 19-point shift.

    Why North America shifts the curve

    Toll-free highways run the 401/A20 corridor end to end. Fuel taxes are roughly one-third of European levels. There is no congestion charging anywhere in Canada. And family-car economics are decisive: per-person car cost divides among the occupants, while rail charges per ticket.

    What this does to predicted share

    The same corridor that would capture a healthy rail share in Europe captures materially less here. The gap between the European and North-American readings is the single largest correction separating the CRI work from the older forecasts.

    Carried through to the ALTO city-pairs, the North-American calibration produces predicted rail shares of the rail+car market that sit well below the European equivalents:

    • ALTO Toronto–Ottawa (τ ≈ 0.44): about 51% North-American versus 67% European.
    • ALTO Toronto–Montreal (τ ≈ 0.56): about 41% North-American versus 58% European.
    • HPR on both pairs (τ ≈ 0.65–0.67): about 33% North-American versus 50% European.

    The lesson is that a forecast borrowed from European experience — as the older studies effectively are — systematically overstates how much of the road market the corridor can win. The car does not behave here the way it behaves there.

    Notes 1 & 2 · Price

    Price shifts the whole modal-shift curve

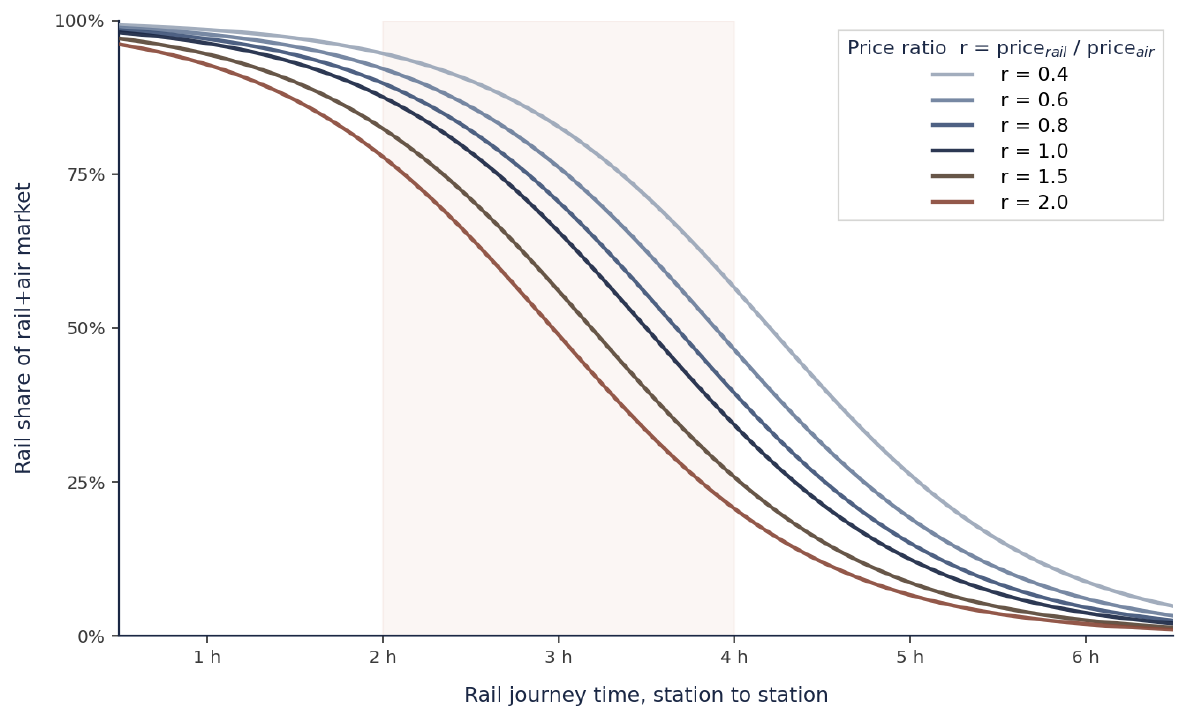
    Journey time fixes the shape of the S-curve; price selects which curve in the family the corridor actually sits on. The relevant variable is the fare-to-comparator price ratio (r) — rail’s price relative to the air fare or the per-person car cost it competes with. A lower ratio lifts the entire curve; a higher ratio depresses it.

    Elasticity differs by mode

    Road–rail substitution is more price-sensitive than air–rail (γ = 1.5 versus 1.0). Travellers deciding between train and car respond more sharply to fare changes than those choosing between train and plane.

    Group travel hurts rail

    Per-person car cost divides among the occupants; rail charges per ticket. A family of four therefore faces an effective price ratio roughly four times higher than a solo traveller — pushing them down the curve toward the car.

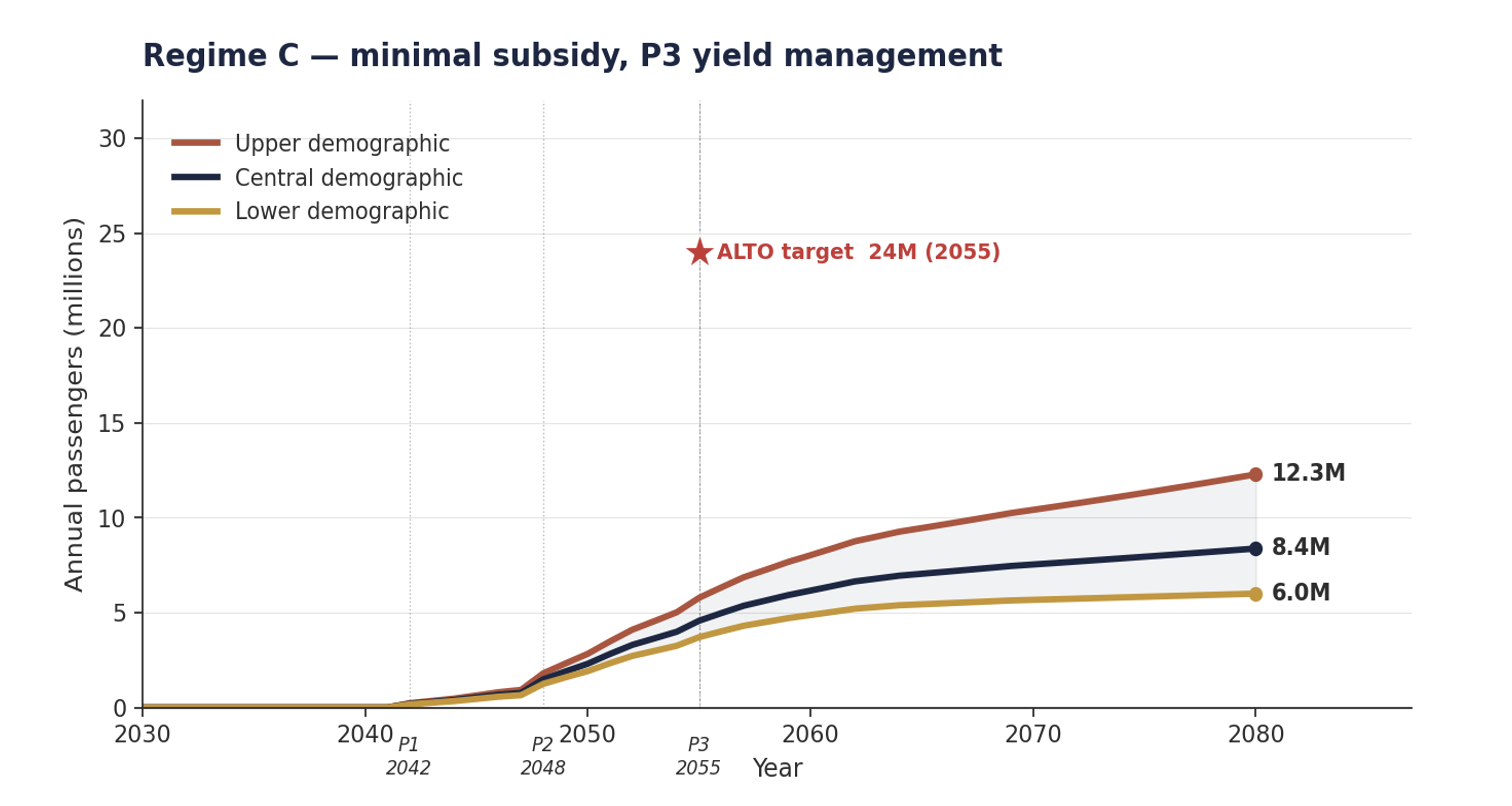
    The note maps three fare regimes onto the curve family. Regime A (r ≈ 0.55) is deeply discounted, lifting share but requiring heavy subsidy. Regime B (r ≈ 1.0) sets fares at parity with air. Regime C (r ≈ 1.4) prices above the comparator. Each selects a different curve — and, as Note 4 shows, a different point on the subsidy frontier. The crucial consequence is that the high-share outcomes the 24-million target needs are only available at the discounted end, where the fares no longer cover the cost of carrying the passenger.

    Note 3 · The Ridership Envelope

    The 2055 envelope is 3.7 to 17.2 million

    Combining the modal-shift ceiling with the corridor’s demographics produces a ridership envelope, not a single number. The framework is deliberately transparent: ridership = population × per-capita trips × modal share × ramp-up. Each input is drawn from published data and stated openly.

    9.2M
    CRI central case at 2055, Regime B (fares at parity with air)
    3.7–17.2M
    Full 2055 ridership envelope across regimes and demographic paths
    24M
    ALTO’s published target — 2.6× the central case

    The demographic inputs are post-2024 and this is where the CRI analysis departs most sharply from the others. The corridor population is 14.9 million (2025), residents make about 1.68 intercity trips each, and StatCan’s low / medium / high growth scenarios run at 0.5% / 1.0% / 1.6% per year. Critically, these trajectories reflect the 2024 federal cap on non-permanent residents — a structural break the older forecasts predate.

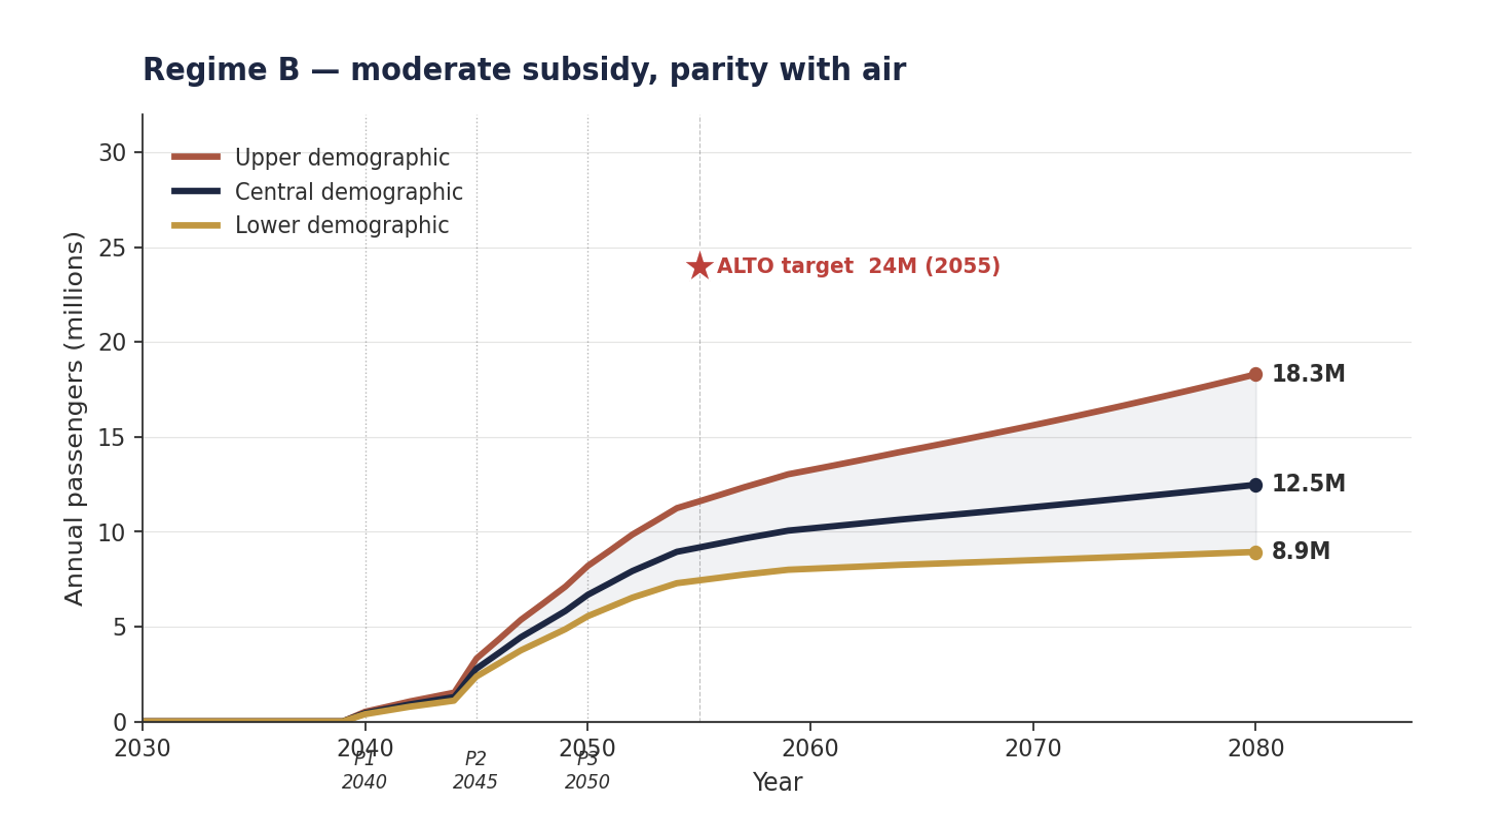
    Under Regime B, the central reading is 9.2 million in 2055, rising to a central 12.5 million by 2080 within an 8.9–18.3 million envelope. ALTO’s 24-million target sits above the top of the 2055 envelope entirely — not at its optimistic edge, but beyond it.

    Ridership envelope chart for the ALTO corridor, 2030 to 2080, showing upper, central and lower demographic trajectories under Regime B against ALTO's 24-million target
    Regime B ridership envelope, 2030–2080. The central demographic path reaches 9.2M in 2055 and 12.5M in 2080; the ALTO target of 24M (2055) sits above the upper bound of the envelope. Figure from Note 3 — Ridership envelope for the ALTO corridor.
    Note 3 · The Comparison

    The 24M target is the outlier

    Set against the independent literature, the pattern is unambiguous: every other forecast clusters near the CRI central case, and the 24-million target stands alone above all of them. The reason the CRI figure sits lower than the academic studies is not methodological pessimism — it is one correction the others have not made.

    The immigration inflection

    The 2024–25 federal cap on non-permanent residents broke the corridor’s demographic trajectory, lowering the central forecast relative to pre-2024 expectations. Only the CRI analysis incorporates the NPR cap.

    Pre-cap demographics elsewhere

    All the independent forecasts — including the 2025 McGill and C.D. Howe studies — rest on pre-2024 population assumptions. They model a population surge that federal policy has since foreclosed.

    Structural travel decline

    Hybrid work and AI-mediated meetings structurally reduce corridor business travel below the pre-2020 baseline — a head-wind absent from the older forecasts entirely.

    In other words, the daylight between ALTO’s target and the independent consensus is not a disagreement about how good high-speed rail is. It is the difference between forecasts built on a demographic future that is no longer the official plan and a forecast built on the one that is.

    The Verdict

    The 24-million target fails three independent feasibility tests

    Each note tests the target from a different direction. The target does not fail one of them narrowly — it fails all three, and each failure is sufficient on its own.

    1

    Modal-shift framework

    Reaching 24M requires a modal share above the 40 per cent ceiling implied by the North-American-calibrated S-curves in Notes 1 and 2. Even ALTO’s heaviest-subsidy regime, with deeply discounted fares, plateaus near 11–12 million annual riders at the modal-shift ceiling.

    2

    Demographic baseline

    The 2024 federal Immigration Levels Plan capped non-permanent residents, producing a structural break in corridor population growth. Pre-2024 forecasts assumed continued surge; post-2024 trajectories are materially lower. 15–25 per cent of the gap to ALTO is demographic alone.

    3

    Subsidy frontier

    Pushing past Regime A toward 24M requires operating subsidy above $5 billion per year, with full federal cost approaching $7 billion per year under the proponent’s own $75B capex base case — outside any defensible operating-regime choice on the corridor.

    Side by Side

    Three tests, one number

    Read together, the three tests converge from independent premises on the same conclusion. They are not three versions of one argument; they are three different constraints, each of which the target violates.

    Modal-shift ceiling

    Limit:~40% share ceiling (NA-calibrated)

    Reaches:~11–12M even at heaviest subsidy

    vs 24M?Falls short by half

    Demographic baseline

    Limit:Post-2024 NPR cap; 0.5–1.6%/yr growth

    Reaches:9.2M central; 3.7–17.2M envelope

    vs 24M?Above the upper bound

    Subsidy frontier

    Limit:Defensible operating regimes (A–C)

    Reaches:24M needs >$5B/yr operating subsidy

    vs 24M?Outside any defensible regime

    The convergence is the point. A target that merely sat at the optimistic edge of one analysis could be defended as ambition. A target that exceeds the modal-shift ceiling, sits above the demographic envelope, and requires an indefensible operating subsidy is not ambitious — it is, on the evidence of all four notes, 2.6× above what the corridor can carry.

    For the next federal statement

    Three questions to ask

    Where the next federal or proponent statement on ALTO ridership is concerned — whether in a business case, a consultation report, or a public communication — three questions follow directly from the notes.

    1. On modal share: What rail share of the rail+air and rail+car markets does the 24-million target assume on each city-pair, and is that share calibrated on North-American or European travel behaviour?
    2. On demographics: Does the ridership forecast incorporate the 2024 federal cap on non-permanent residents, or does it rest on pre-2024 population assumptions that the cap has since superseded?
    3. On subsidy: At the fare level required to reach the target, what is the projected annual operating subsidy — and how does it compare with the $5 billion-plus the subsidy frontier implies under the proponent’s own capex base case?

    None of these questions presupposes opposition to passenger rail, which is a widely shared public good. Each asks only that the project reconcile its headline number with the same evidence base — modal-shift behaviour, the demographic baseline, and the operating economics — that every other forecast for the corridor is built on.

    Download Full Deck
    ALTO Ridership Against the Modal-Shift Evidence (PDF)
    Reference deck for federal decision-makers, parliamentarians, journalists, and residents along the corridor
    Download Deck
    Where Things Stand

    Two numbers, one of them public

    As of May 2026, ALTO’s public ridership figure is 24 million annual passengers by 2055. The independent evidence base — modal-shift behaviour calibrated to North America, a demographic baseline corrected for the 2024 immigration cap, and an operating-subsidy frontier built from the proponent’s own cost figures — places the corridor’s central case at 9.2 million. The two numbers are not a matter of optimism versus caution. The lower one incorporates evidence the higher one omits, and only the higher one has been put to the public.

    Sources

    Underlying notes and references

    1.
    Note 1 — Modal shift between high-speed rail and air on the ALTO corridor. ALTO HSR Citizen Research Initiative. Source of the logistic rail–air S-curve, the 3.5-hour inflection, the short-haul / competitive-zone / long-haul thresholds, and the Paris–Lyon, Madrid–Barcelona, Madrid–Seville and Beijing–Shanghai empirical anchors.
    2.
    Note 2 — Modal shift between rail and car on the ALTO corridor. ALTO HSR Citizen Research Initiative. Source of the North-American-calibrated rail–car S-curve anchored on VIA Rail’s ~13% road share, the inflection shift from τ = 0.65 (EU) to τ = 0.46 (NA), and the predicted rail shares for the Toronto–Ottawa, Toronto–Montreal and HPR city-pairs.
    3.
    Note 3 — Ridership envelope for the ALTO corridor, 2035–2080. ALTO HSR Citizen Research Initiative. Source of the ridership framework (population × per-capita trips × modal share × ramp-up), the post-2024 demographic inputs reflecting the federal NPR cap, the 9.2M central case, and the 3.7–17.2M envelope.
    4.
    Note 4 — Operating-subsidy frontier for the ALTO corridor. ALTO HSR Citizen Research Initiative. Source of the Regime A/B/C fare mapping, the subsidy frontier corrected to be operating-cost-consistent, and the >$5B/yr operating subsidy (~$7B/yr full federal cost) implied by pushing ridership toward 24M under the $75B capex base case.
    5.
    El-Geneidy, A., et al. Transportation Research at McGill (TRAM), McGill University (2025). Independent corridor ridership forecast built on pre-2024 population assumptions. tram.mcgill.ca
    6.
    C.D. Howe Institute (2025). Independent assessment of the high-speed rail corridor, using pre-2024 demographic inputs. cdhowe.org
    7.
    Statistics Canada — population projections (low-growth / medium / high-growth scenarios) and the corridor population base; and the 2024 Immigration Levels Plan establishing the cap on non-permanent residents. statcan.gc.ca
    8.
    ALTO HSR Citizen Research Initiative companion briefs: Reading the Answer (cost, ridership and subsidy claims) and The Report That Vanished. This brief is intended to be read alongside them.
  • Modal shift HSR car

    Citizen Research Initiative · Modal Shift Analysis · Note 2

    Modal Shift Between Rail and Car on the ALTO Corridor

    The car competes with rail at every distance, costs are weighed on fuel rather than full economics, and a full car of four tilts the comparison decisively toward driving. Why North American road–rail substitution is structurally harder — and how much of it ALTO’s speed actually buys.

    ⚠ What This Note Examines

    This note applies the evidence on rail–car substitution to the two principal corridor pairs — Toronto–Ottawa and Toronto–Montréal — in the North American context, comparing current VIA Rail, a High Performance Rail (HPR) alternative at 200 km/h, and ALTO at 300+ km/h.

    The road–rail comparison differs structurally from the rail–air analysis in Note 1: the car carries no fixed access penalty, perceived driving cost is dominated by fuel rather than full lifecycle cost, group travel decisively favours the car, and modal choice is more responsive to price than to time.

    Summary

    The right competitive variable is not absolute rail time but the ratio τ of rail time to car drive time: τ = 0.5 means rail takes half as long as driving, τ = 1.0 means equal time. Because car drive time scales with distance, the same τ implies the same competitive geometry on any route length.

    The corridor’s road-substitutable demand is far larger than its air-substitutable demand — highway flow on the 401 between Toronto, Kingston, Ottawa and Montréal is several times the corridor’s annual air person-trips. Three structural features make North-American competition harder than European comparators: the 401/A20 is toll-free end-to-end, there is no congestion charging anywhere in Canada, and per-person car cost divides among occupants while rail charges per ticket. A family of four faces a per-person rail-to-car price ratio four times higher than a solo traveller.

    Under canonical conditions — solo traveller, current Canadian gas prices, near-parity pricing — on a North-American–calibrated curve anchored on VIA’s ~13% rail share, the model predicts ALTO captures about 51% of the rail+car market on Toronto–Ottawa and 41% on Toronto–Montréal; HPR captures about 33% on both. European-equivalent upper bounds — readings that would apply only if North American transport policy shifted toward European fuel taxes, tolls and station-area land use — are 67% and 58% for ALTO and around 50% for HPR.

    Download
    Modal Shift Note 2 — Road–Rail Research Note (PDF)
    The full 26-page note with all eleven figures, the European and North-American calibrations, the group-size and gas-price levers, the reliability analysis, and the methodology and sources
    Download PDF
    1 · Travel Time

    The competitive zone for road

    The literature on rail–car substitution differs sharply from the rail–air literature. The car carries no fixed time penalty equivalent to airport access, security and downtown-airport transit; parked at origin and arriving at destination, it has near-zero access cost on both ends, and its line-haul time degrades only slightly across the 100–1,000 km range. The result is that car competes against rail at every distance — including short-haul corridors where rail would dominate the air comparison.

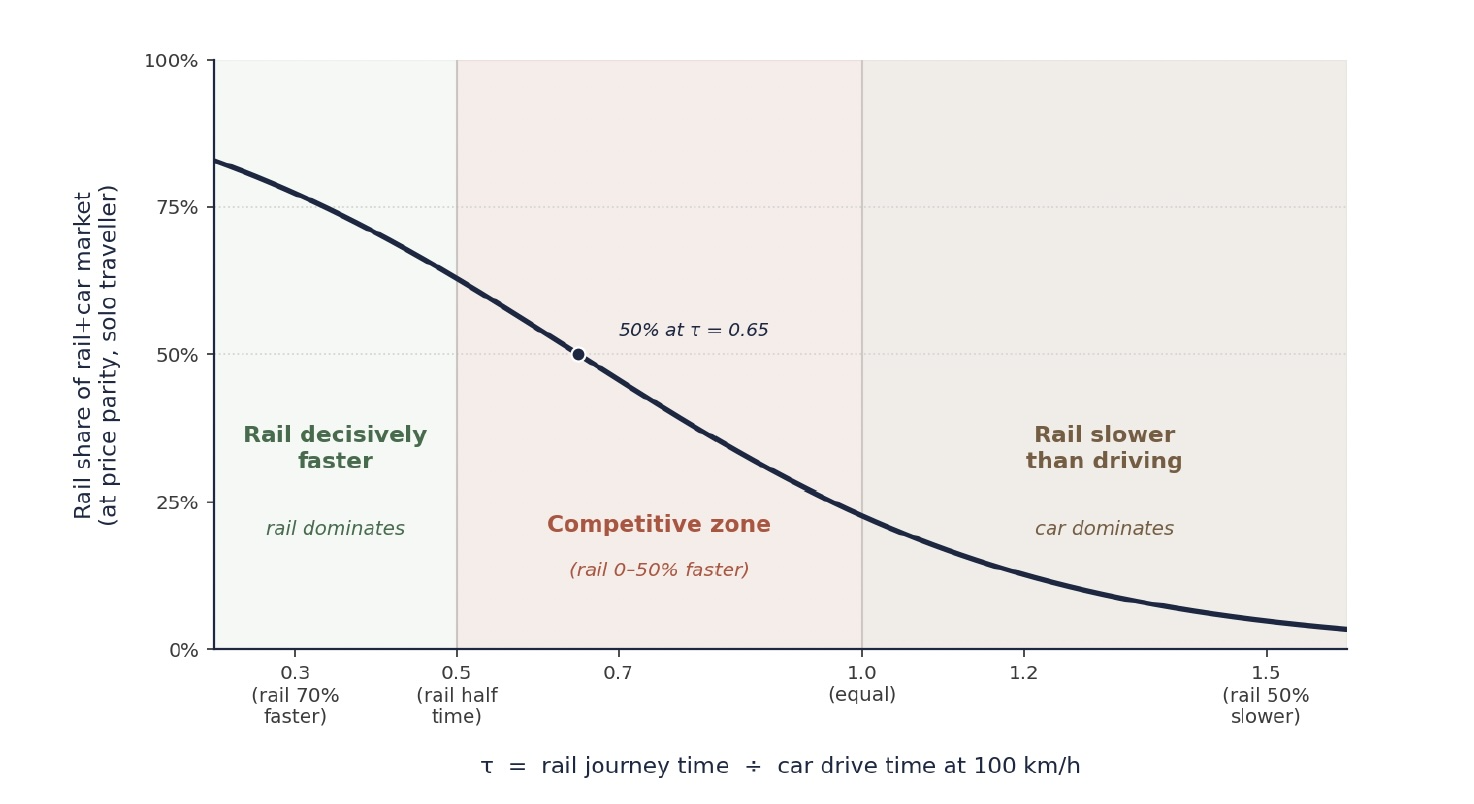
    The right measure is therefore not absolute rail journey time but the ratio of rail time to car time. Defining τ = (rail time) ÷ (car drive time at 100 km/h) gives a distance-invariant measure of rail’s advantage: τ = 0.5 means rail takes half as long as driving; τ = 1.0 means equal time; τ > 1.0 means rail is slower. A 3-hour rail journey on a 540 km route (τ = 0.56) is competitively equivalent to a 1.5-hour journey on a 270 km route. This is the key structural difference from the rail-vs-air analysis, where rail’s fixed advantage at the access stage means absolute time is what matters.

    Road-rail modal-shift S-curve plotting rail share of the rail+car market against the time ratio tau, European calibration
    Figure 1. Modal-shift S-curve for rail–car substitution, plotting rail’s predicted share of the combined rail+car market against the time ratio τ = (rail journey time) ÷ (car drive time at 100 km/h). Logistic curve fitted with inflection at τ = 0.65 (rail captures 50% at price parity when ~35% faster than driving). Three zones: rail decisively faster (τ < 0.5); the competitive zone (0.5 < τ < 1.0); and rail slower than driving (τ > 1.0). Calibrated against the TGV Paris–Lyon pre/post comparison.

    The European calibration in Figure 1 represents what rail can achieve under conditions that favour modal shift — high fuel taxes, congestion charging, dense feeder transit, central stations, and a cultural baseline of rail use. North American conditions are systematically less favourable, and the same τ produces lower rail shares.

    North-American-calibrated S-curve anchored on current VIA Rail's 13% rail share, with the European curve shown for comparison
    Figure 1b. North-American–calibrated S-curve, anchored on current VIA Rail service (~13% rail share of the rail+car market at τ ≈ 1.0). The faded grey dashed curve is the European calibration from Figure 1. Inflection shifts left from τ = 0.65 to τ = 0.46: under North American conditions, rail must be ~54% faster than driving — rather than 35% — to capture half the market at parity. Equivalent to a constant utility penalty α ≈ 0.67 reflecting toll-free highways, low fuel taxes, free parking, dispersed land use, weak feeder transit, and a cultural autonomy preference.

    Read together, Figures 1 and 1b bracket the realistic range. The European curve represents what is achievable in principle if rail-favourable conditions were created; the NA curve gives what is achievable under prevailing structural conditions. The remainder of this note uses the NA calibration, with European-equivalent figures quoted alongside where the comparison is informative. The gap between them is policy-relevant: roughly 10 to 15 percentage points of modal share depend not on which infrastructure is built but on whether the broader transport-policy environment supports modal shift.

    Empirical anchors and the North American context

    The Paris–Lyon TGV cut journey time from ~4 hours to under 2 and lifted rail’s share against road from ~30% to ~67% — a 37-point shift. Madrid–Barcelona AVE and Tokyo–Osaka Shinkansen deliver comparable shares against parallel highways. But all operate under conditions the corridor does not share. North America carries none of these reinforcements: the 401/A20 is toll-free end-to-end, Canadian fuel taxes are roughly one-third of European levels, there is no congestion charging in any Canadian city, and land use at both ends is car-oriented. The cross-elasticity literature confirms rail and car barely substitute — a 10% rise in fuel prices produces only a 1 to 4% rise in transit ridership.

    Rail’s competitive position against the car turns on the time ratio τ, not absolute journey time. The North American absence of tolls, congestion charges, and high fuel taxes means realised modal share will likely sit substantially below the European-anchored model’s predictions.
    2 · Price

    Elasticity, group size, and perceived cost

    The road–rail price comparison differs from rail–air in three ways: the elasticity of substitution is higher, the per-person ratio depends decisively on group size, and the cost of driving travellers actually weigh is the perceived cost (mostly fuel), not the full economic cost. The same logit form applies, but with a larger price coefficient (γ = 1.5 against 1.0 for rail–air), reflecting own-price elasticities of −1.0 to −1.6 for leisure demand against −0.4 to −0.7 for business.

    European price family

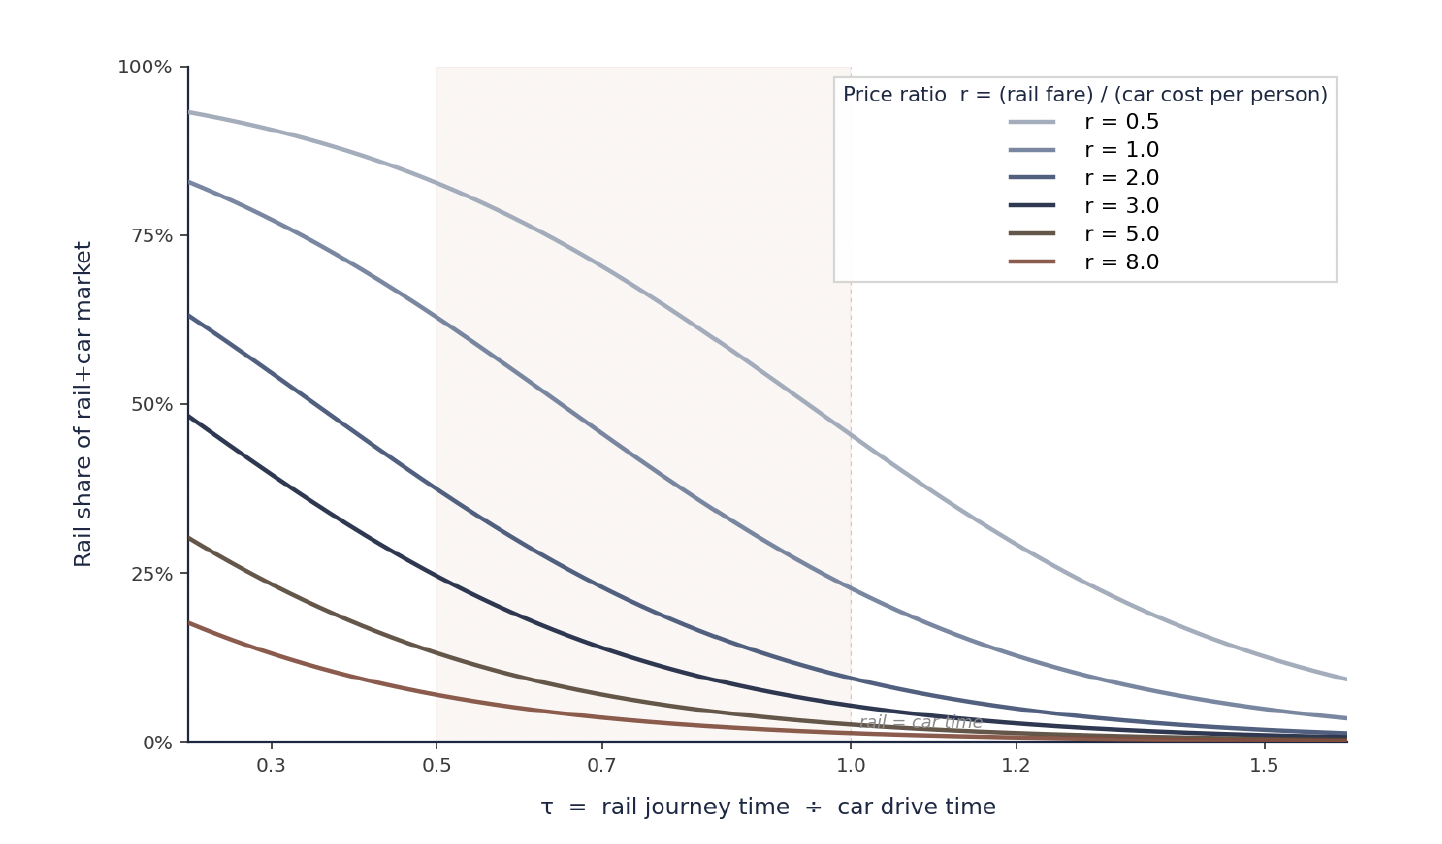
    Figure 2a shows the curve family at six price ratios under the European calibration. The wide range (0.5 to 8.0) reflects that group travel can drive the per-person ratio well above 5 even at parity-pricing intentions, since car cost divides among occupants while rail fare does not.

    North American price family

    Figure 2b applies the same six ratios under the NA calibration (τ₀ = 0.46). Each curve sits 15 to 20 points below its European counterpart at every τ. This family drives the corridor predictions in the rest of the note.

    Family of road-rail S-curves at six rail-to-car price ratios, European calibration
    Figure 2a. Family of road–rail S-curves at six rail-to-car-per-person price ratios (r = rail fare ÷ car cost per person), European calibration. The middle navy curve at r = 1.0 is price parity. The family spans 0.5 to 8.0, reflecting that group travel can push the per-person ratio well above 5.
    Family of road-rail S-curves at six price ratios, North American calibration
    Figure 2b. The same six ratios under the North American calibration (τ₀ = 0.46). Each curve sits 15 to 20 points below its European counterpart. This family is used throughout the rest of the note.

    Perceived versus full cost of driving

    Drivers compare rail fare against the perceived cost of driving, not the full economic cost. On Toronto–Montréal, one-way fuel for a typical car (9.4 L/100 km at ~$1.65/L) is about $84; the full economic cost — depreciation, insurance, maintenance — is more than three times that, around $300. But fixed costs are not perceived at the moment of choice; the car is owned regardless. A VIA Economy fare of ~$80 against perceived car cost of $84 produces a price ratio near 1.0 for a solo traveller. Against full cost the same fare would imply a ratio of 0.27 — and would predict a far larger rail share than the corridor actually carries, the empirical tell that perceived cost is the right input.

    The group-size effect

    Cars carry one to four passengers at a single fuel cost; rail charges per ticket. The per-person rail-to-car ratio is therefore ~1.0 for a solo traveller, 1.9 for a couple, 2.9 for three, and 3.8 for a full car of four. Family travel and any leisure trip with two or more travellers structurally favours the car — a multiplier with no analogue in the rail–air comparison. At parity pricing, ALTO’s Toronto–Ottawa share drops from ~51% solo to ~12% for a family of four; on Toronto–Montréal from 41% to 8%.

    Gas price as a modal-shift lever

    Because perceived car cost is dominated by fuel, the price ratio is sensitive to gas prices in a way the air comparison is not. A swing from $1.30 to $2.00/L — well within historic range — moves the solo Toronto–Montréal ratio from 1.21 to 0.79. Carbon pricing and fuel-tax policy are levers on rail modal share that operate as strongly as line-haul speed, at much lower capital cost.

    Group-size effects can suppress predicted rail share by 75 to 90 per cent; gas-price swings can move it by 10 to 20 percentage points. These dimensions matter as much as infrastructure choice.
    3 · Travel Time on the Corridor

    Where the corridor sits on the curve

    The same two principal pairs carry the bulk of rail-substitutable demand, but the absolute road flow is very large. The 401 between Toronto, Kingston, Ottawa and Montréal carries tens of millions of person-trips a year — several times the corridor’s air person-trips. Even a small percentage shift represents a meaningful absolute volume.

    Table 1. Approximate annual person-trip volumes (both directions) by mode on each principal pair, and resulting current modal shares. Order-of-magnitude estimates (±25% air/rail, ±30% car). Bus volumes excluded for clarity.
    City pairAirRail (VIA)CarRail share of rail+airRail share of rail+car
    Toronto–Montréal~1.9 M~800 K~6 M~30%~13%
    Toronto–Ottawa~0.9 M~800 K~4.5 M~47%~14%
    Ottawa–Montréal~0.45 M~525 K~4 M~54%~12%

    Three observations follow. The road-substitutable market dwarfs the air-substitutable market on every pair — car volumes are three to ten times rail+air combined. Current rail-vs-air shares are already meaningful (~30% on Toronto–Montréal, ~half on the shorter pairs), but rail-vs-car shares sit in the 12 to 14% range across all three. And the structural similarity of road–rail shares despite very different distances confirms the τ-normalisation: current VIA service produces τ values close to 1.0 on every pair.

    Table 2. Approximate segment-level travel times for car (driving on 401/A20, no congestion) alongside rail under three scenarios. *Toronto–Montréal under current VIA runs 5 h 13 min on the 538 km direct routing; the parallel car drive is ~5 h 30 min.
    City pairDistanceCar (401)VIA currentHPR (200 km/h)ALTO (300+ km/h)
    Toronto–Ottawa~450 km~4 h 30 min~4 h 30 min~2 h 55 min~2 h
    Toronto–Montréal~540 km~5 h 30 min5 h 13 min*~3 h 38 min~3 h
    Ottawa–Montréal~190 km~2 h~1 h 55 min~1 h 30 min~1 h
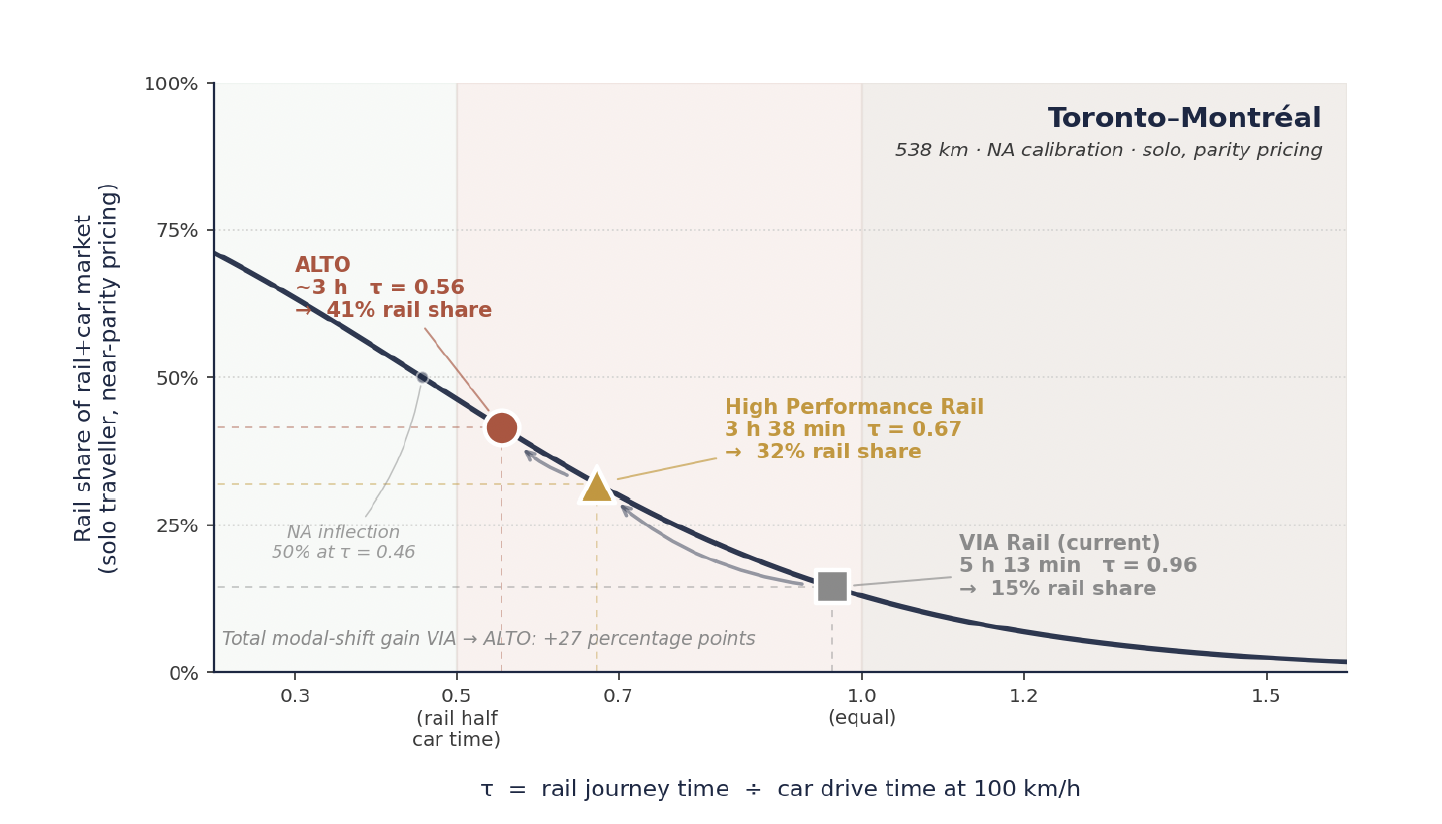
    Modal-shift progression for Toronto-Montreal under VIA, HPR and ALTO at solo, near-parity pricing on the NA-calibrated curve
    Figure 3. Modal-shift progression for Toronto–Montréal under the three rail scenarios, plotted on the North-American–calibrated S-curve at solo traveller and near-parity pricing. Predicted rail share of the rail+car market rises from ~15% under VIA, to 32% under HPR, to 41% under ALTO — a total gain of ~27 points, of which 17 points (about two-thirds) are captured by the HPR step alone.
    Table 3. Predicted rail share of the combined rail+car market on each principal pair under each scenario (NA calibration, near-parity, solo, current gas, current VIA-equivalent fares). The VIA shares match the Table 1 anchors, validating the calibration. HPR/ALTO values are order-of-magnitude estimates.
    City pairVIA currentHPR (200 km/h)ALTO (300+ km/h)
    Toronto–Ottawa~13%~34%~51%
    Toronto–Montréal~15%~32%~41%

    These are the time-only readings under the most favourable price configuration. Real corridor traffic is a mix of solo, couple and family travel, with fares that may rise above current VIA levels if HPR or ALTO recover more capital from passengers. Section 4 produces a more realistic envelope.

    4 · Price and Group Size on the Corridor

    Where the corridor sits on the price axis

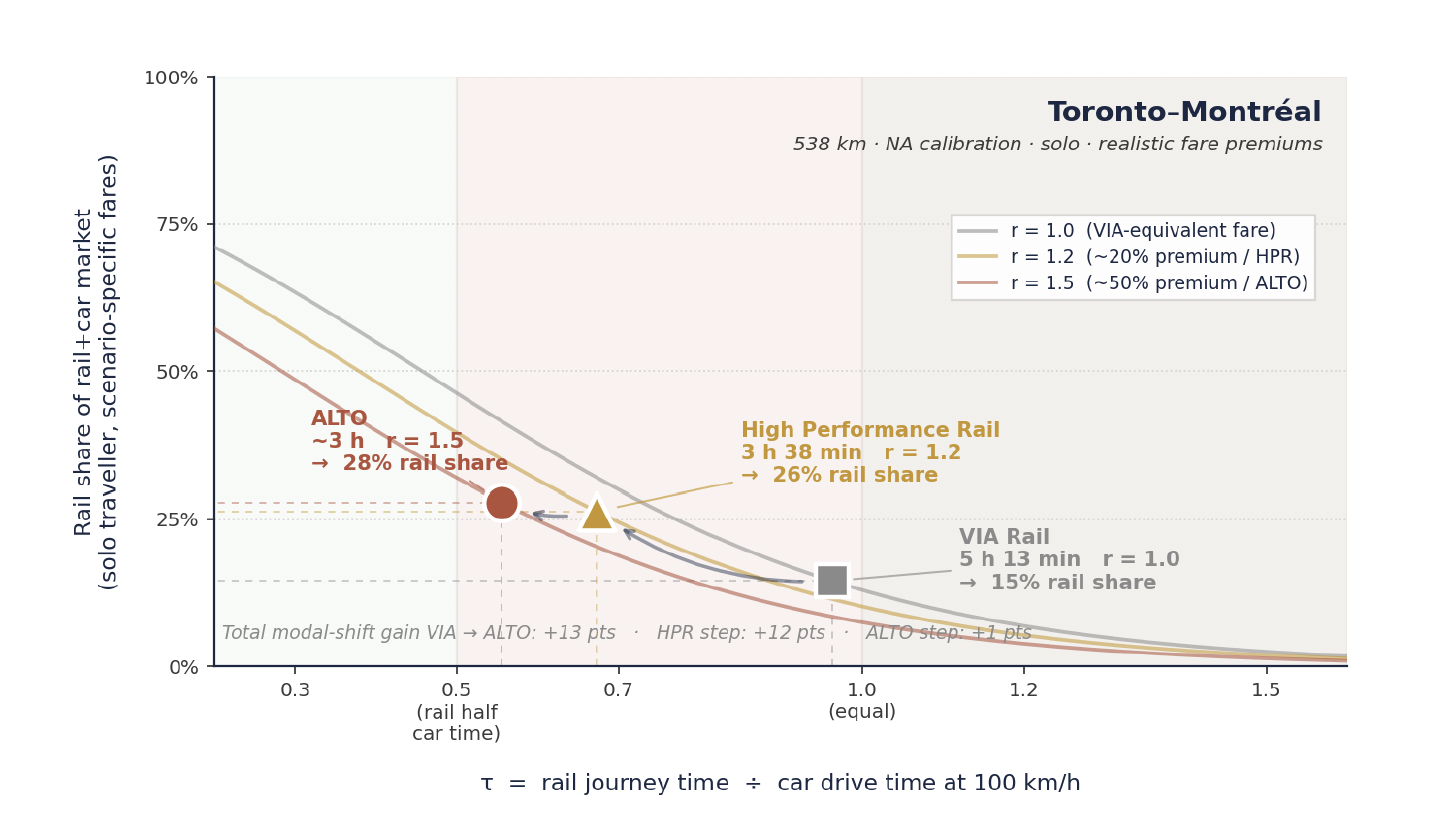
    Figure 3 plotted the scenarios at price parity — the most favourable assumption for rail. But HPR and ALTO carry higher capital and operating costs than VIA’s shared-track service, and any realistic operating model recovers part of that from passengers. International HSR and the Brightline comparator place premium fares 30 to 80% above conventional rail. This analysis takes a moderate set: HPR at ~20% premium (r = 1.2), ALTO at ~50% premium (r = 1.5).

    Modal-shift progression for Toronto-Montreal with realistic fare premiums applied: VIA r=1.0, HPR r=1.2, ALTO r=1.5
    Figure 4. Toronto–Montréal under realistic scenario-specific fare premiums — VIA at r = 1.0, HPR at ~20% premium (r = 1.2), ALTO at ~50% premium (r = 1.5). Predicted shares: VIA 15%, HPR 26%, ALTO 28%. The total VIA → ALTO gain collapses from +27 points at parity to +13 points, with the HPR step doing essentially all the work (+12 pts) and the ALTO step adding only +1 to +2.

    Three observations follow. First, ALTO’s modal-share advantage over HPR — already modest at parity (+9 points on Toronto–Montréal) — essentially disappears once realistic fare premiums are applied, the two converging to within a point of each other. Second, this is robust: sensitivity at ALTO premiums between 30 and 80% produces ALTO shares between 30 and 24%, all within a few points of the HPR 26% reading. Third, the HPR step from current VIA to a dedicated 200 km/h corridor at VIA-equivalent fares captures essentially all of the realistically achievable road–rail modal shift; ALTO’s 300+ km/h capability is real but largely cancelled by the fare premium needed to fund it.

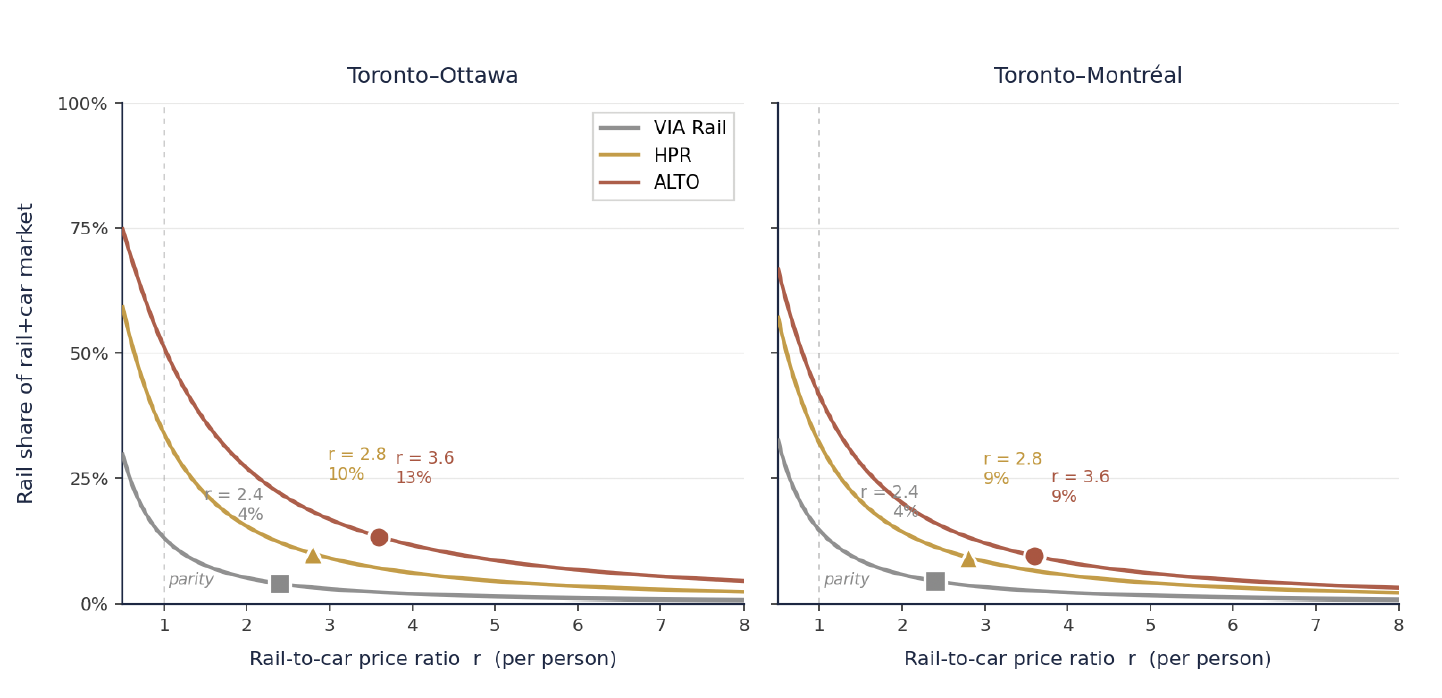
    Modal share as a function of per-person rail-to-car price ratio for each scenario on both Toronto pairs
    Figure 5. Modal share as a function of per-person rail-to-car price ratio, travel time held fixed. Reference operating points combine the solo/current-gas baseline with the realistic premiums: VIA at r = 2.4, HPR at r = 2.8, ALTO at r = 3.6. Predicted shares: VIA ~4% on both pairs; HPR ~10% (Toronto–Ottawa) and ~9% (Toronto–Montréal); ALTO ~13% and ~9%. Share falls steeply as the ratio rises, reflecting the higher price coefficient.
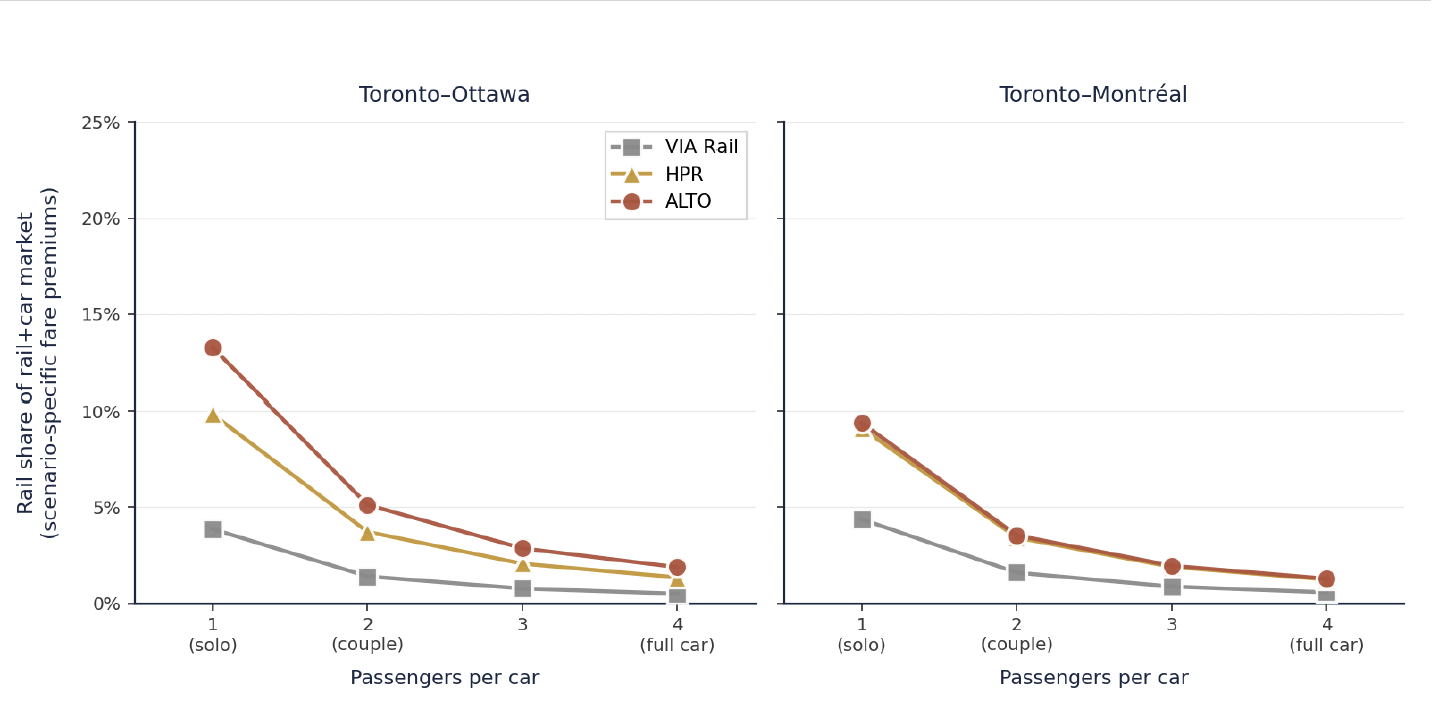
    Modal share as a function of group size from 1 to 4 passengers per car for each scenario
    Figure 6. Modal share against group size (1 to 4 passengers per car), each scenario scaling linearly from its base ratio. Toronto–Ottawa solo shares of 4% (VIA), 10% (HPR), 13% (ALTO) fall to ~1% across all three for a family of four; Toronto–Montréal similarly. The HPR and ALTO lines converge rapidly — a couple essentially eliminates the ALTO advantage.

    The rail-substitutable portion of corridor road traffic is concentrated on solo travellers paying single-person fares against per-person fuel costs. A second passenger halves rail share again; a car of three or four cannot be captured at any travel time or defensible fare. This narrows the realistic market to a small fraction of total road flow — predominantly business, single-traveller leisure, and downtown-to-downtown trips.

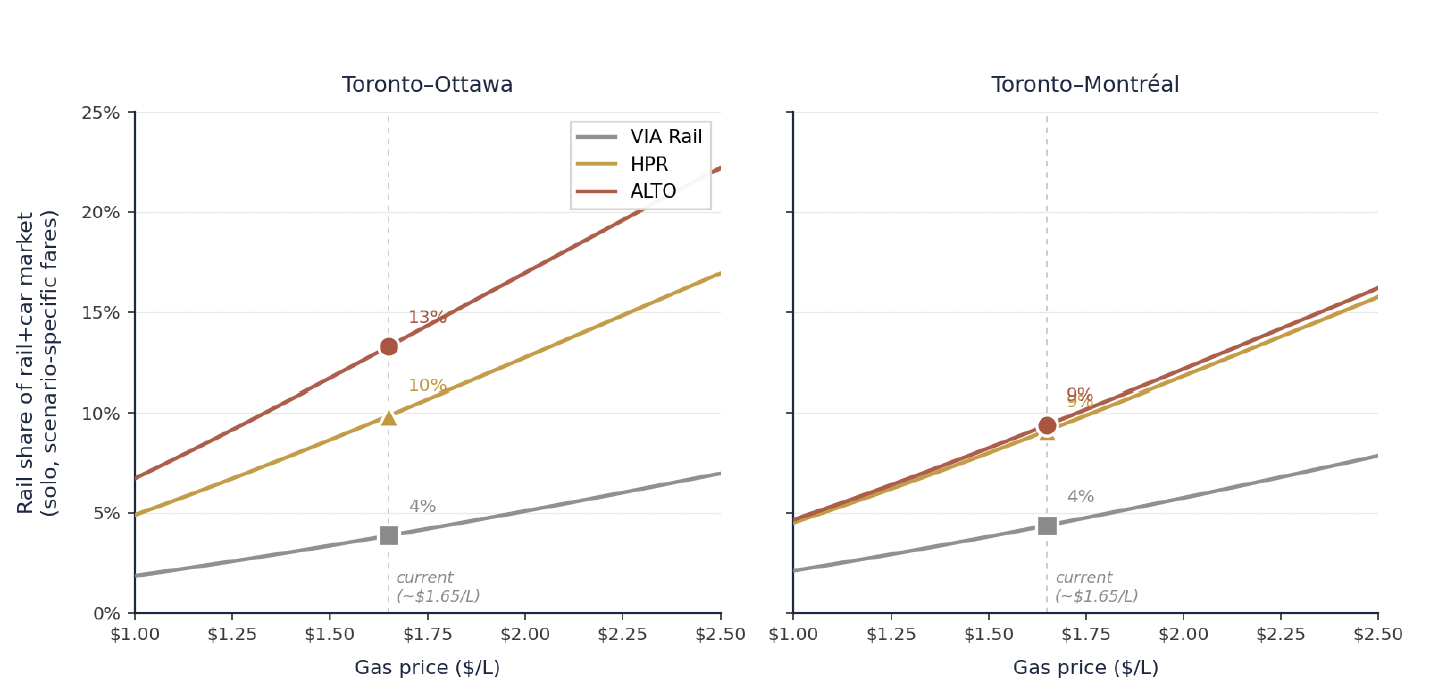
    Modal share as a function of gas price from $1.00 to $2.50 per litre for each scenario
    Figure 7. Modal share against gas price ($/L) at solo travel, anchored at the current ~$1.65/L (VIA r = 2.4, HPR r = 2.8, ALTO r = 3.6). A swing from $1.00 to $2.50 roughly triples rail share for each scenario, but absolute levels remain modest. HPR and ALTO converge almost exactly on Toronto–Montréal at all gas prices — fare premiums largely cancel ALTO’s speed advantage.

    Two policy implications follow. The corridor’s modal-shift outcomes are not solely a function of which infrastructure is chosen — they also depend on fuel pricing, carbon pricing and the broader transport-policy environment. And the comparative performance of HPR and ALTO is roughly stable across the gas-price range, so the scenario comparison is robust to fuel-price assumptions even if the absolute levels are not.

    5 · Reliability

    On-time performance and reliability

    Reliability operates as an effective time penalty whenever on-time performance (OTP) drops below a threshold travellers can rely on. Unreliable service makes travellers take an earlier departure than schedule alone requires, inflating their effective journey time by the buffer they carry. The model adds a utility term δ·(OTP_ref − OTP), with δ = 2.0 (the Wardman midpoint) and OTP_ref = 0.85 (VIA’s 2023 reported figure).

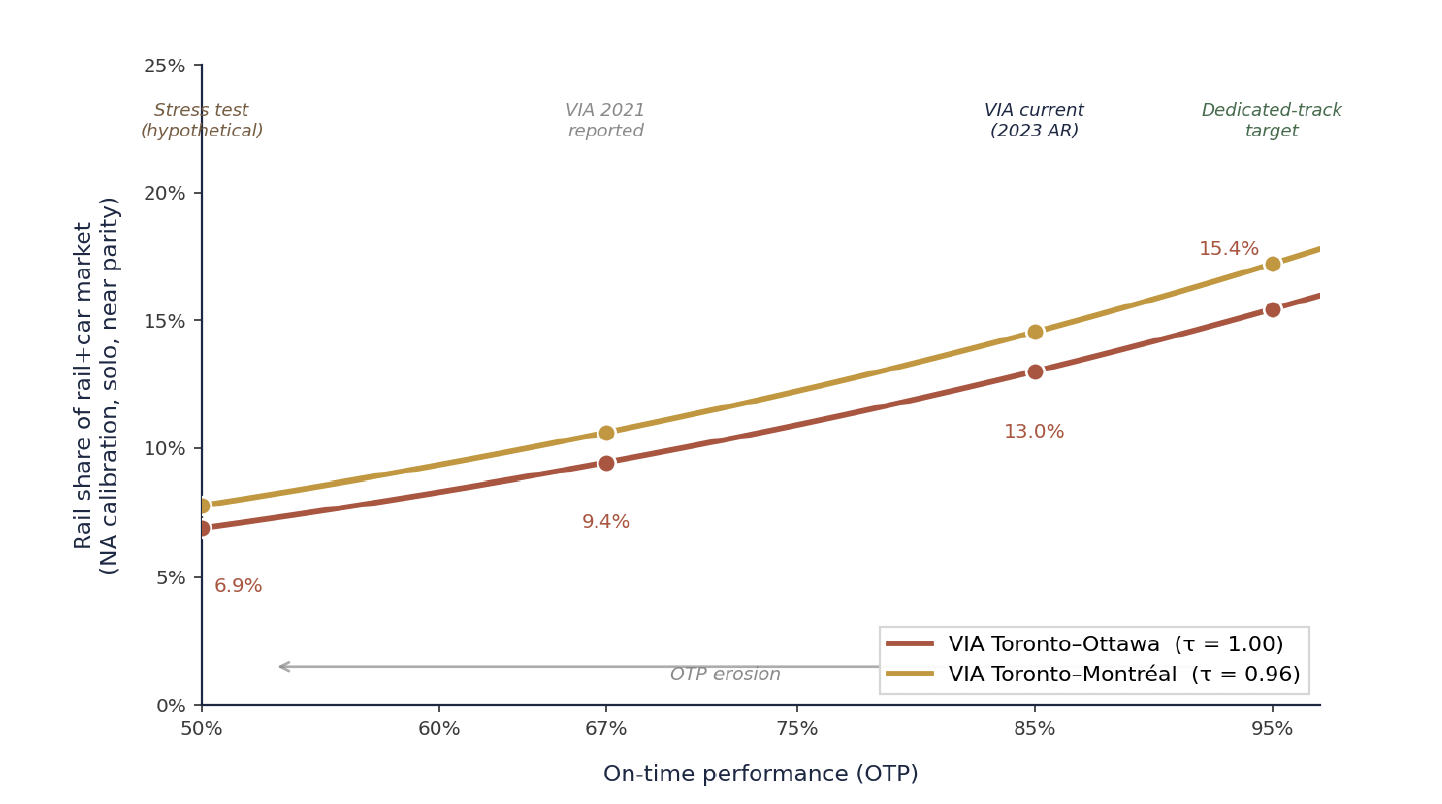
    Rail share of the rail+car market as on-time performance varies from 95% down to 50% for both Toronto pairs
    Figure 8. Rail share of the rail+car market for VIA Toronto–Ottawa and Toronto–Montréal as OTP varies from a 95% dedicated-track target down to a 50% stress-test floor. Reference points: dedicated-track target (95%), current VIA (85%), VIA’s 2021 figure (~67%, during heavy freight conflict), and a 50% stress test. As OTP erodes from 95 to 50%, Toronto–Ottawa share roughly halves (15.4% to 6.9%); Toronto–Montréal falls 17.2% to 7.8%.

    Three points follow. OTP is a meaningful but not dominant lever — its dynamic range across the observed band is about ±5 points, comparable to a $0.50/L fuel swing or a solo-to-couple shift. OTP and price are partial substitutes: a 10-point OTP improvement is worth roughly a 14% fare cut, which is why Brightline advertises 92% OTP precisely to support a fare premium. And crucially, the OTP gain inheres in the dedicated-track step, not the speed step — both HPR and ALTO eliminate the freight-train conflicts on shared CN track that cause VIA’s reliability problems, so OTP is not a differentiator between them.

    OTP erosion from 95 to 50 per cent halves VIA’s predicted rail share. The reliability gap between shared-track service and a dedicated alternative is real, but it is captured equally by HPR and ALTO — the speed step adds nothing to reliability.
    6 · Where the Returns Sit

    Where the modal-shift returns sit on the curve

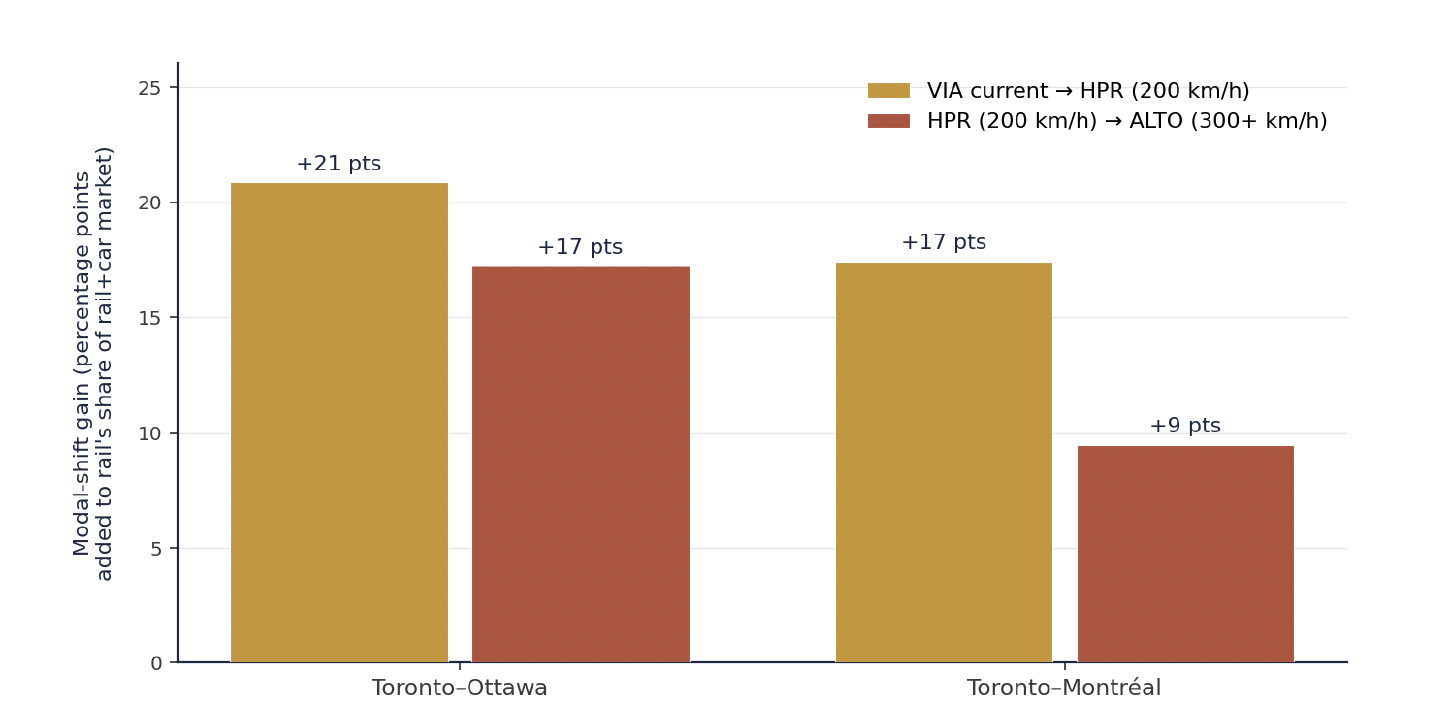
    Because the curve is logistic, the value of additional time savings depends on where a route starts. On Toronto–Ottawa under the NA calibration, moving from VIA (τ = 1.00, ~13%) to HPR (τ = 0.65, ~34%) approaches the inflection and delivers the largest single increment; the move to ALTO (τ = 0.44, ~51%) adds another as the curve crosses its inflection. On Toronto–Montréal, the moves go from VIA at ~15% to HPR at ~32% to ALTO at ~41%.

    Decomposition of road-rail modal-shift gain by investment step: VIA to HPR versus HPR to ALTO on each pair
    Figure 9. Decomposition of road–rail modal-shift gain by investment step (solo, near-parity, NA calibration). Gold bars show the gain from VIA to HPR; terracotta bars the additional gain from HPR to ALTO. The HPR step adds 21 points on Toronto–Ottawa and 17 on Toronto–Montréal; the ALTO step adds 17 and 9. Under the European calibration the comparable figures would be 27/23 (HPR) and 17/10 (ALTO).
    17–21
    Percentage points captured by the VIA → HPR step (NA, near-parity)
    9–17
    Additional points from HPR → ALTO — shrinking under realistic premiums
    $2.5–8B
    Incremental capital cost per percentage point of ALTO-only road–rail shift

    The cost-effectiveness comparison is more challenging for ALTO than for HPR. ALTO’s $60–90 billion envelope is an incremental investment of $40–70 billion above the HPR option. Spread across the additional 9 to 17 points ALTO captures over HPR at canonical NA conditions, that works out to roughly $2.5 billion to $8 billion per percentage point — with the important caveat that road–rail shift, in absolute trip volumes, represents a much larger total person-trip diversion than the air–rail equivalent.

    The corridor’s road traffic is several times its air traffic, and even an NA-realistic 30 to 50 per cent rail share of rail+car represents a larger absolute volume than full capture of the rail+air market.
    7 · Implications

    What this means for the corridor decision

    Six conclusions follow from putting the road–rail evidence alongside the air–rail analysis.

    Structurally different from rail-vs-air

    The car competes at all distances; the competitive zone is narrower (1.5 to 3 hours); perceived cost is dominated by fuel; group travel tilts decisively toward driving; cross-elasticities are remarkably low; and structural North American conditions all suppress rail’s position relative to European comparators.

    The road prize is bigger

    Despite the headwinds, road-substitutable demand is far larger in absolute terms than air-substitutable demand. Even modest rail shares translate to large absolute diversions — between 1.4 and 3 million additional rail trips a year on the principal pairs. The road prize is bigger; it is just structurally harder to capture.

    Policy levers rival infrastructure

    Group size and fuel pricing are levers as substantial as the HPR/ALTO choice. Family travel suppresses rail share by ~75%; sustained higher fuel prices lift it by 15 to 30 points. Carbon pricing, fuel tax, congestion charging and parking pricing operate at much lower capital cost.

    Reliability is a dedicated-track gain

    OTP is substantial but bounded, and the gap between shared-track and dedicated service is captured by the move from VIA to either HPR or ALTO. The OTP step is inherent in the dedicated-track decision, not the speed decision.

    Sixth, this is the regime in which the High Performance Rail framework is most defensible on modal-shift grounds. The HPR step from VIA’s shared-track service to a dedicated, electrified 200 km/h corridor at VIA-style fares captures the majority of the road–rail opportunity on both pairs — adding 21 points on Toronto–Ottawa and 17 on Toronto–Montréal. ALTO’s additional speed adds 9 to 17 points at solo, near-parity conditions, but those points cost $40–70 billion above HPR, and under realistic group-mix and price assumptions the incremental advantage shrinks further.

    Taken together with the parallel rail–air analysis, the corridor decision turns on whether the right framework is being used. Modal-shift performance is multi-dimensional — time, price, group size, fuel cost, traveller type, structural context — and the headline time-only advantage that motivates ALTO’s case shrinks substantially once these dimensions are admitted. The High Performance Rail framework delivers the bulk of the corridor’s achievable modal-shift outcomes — on both the air market and the road market — at roughly a quarter of ALTO’s capital cost.

    Download Full Note
    Modal Shift Note 2 — Road–Rail Research Note (PDF)
    Reference document with the full methodology, both calibrations, sensitivity analysis, and the complete source list
    Download PDF
    Methodology

    Modelling approach

    The S-curve is a standard logistic of the form S(τ) = 1 / (1 + exp(K·(τ − τ₀))), where S(τ) is rail’s share of the combined rail+car market as a function of the time ratio τ = (rail time) ÷ (car drive time at 100 km/h). The τ-normalisation is a meaningful departure from the absolute-time framing of the rail–air analysis: because the car comparator scales with distance, τ gives a distance-invariant measure of rail’s competitive position. Parameters are K = 3.5 and τ₀ = 0.65 (European). The price family adds a utility term: S(τ, r) = 1 / (1 + exp(K·(τ − τ₀) + γ·ln r)), with γ = 1.5 — larger than the rail–air γ = 1.0, reflecting higher own-price elasticities for car-vs-rail substitution. For group travel, r_effective = r_solo × n.

    Two calibrations are presented. The European calibration (τ₀ = 0.65) is fitted to the TGV Paris–Lyon pre/post comparison. The North American calibration (τ₀ = 0.46) is anchored on current VIA’s ~13% rail share at τ ≈ 1.0; the two differ only in τ₀, the shift equivalent to a constant penalty α ≈ 0.67. The parameters are illustrative rather than predictive; sensitivity at K between 2.5 and 4.5, τ₀ between 0.40 and 0.75, and γ between 1.2 and 1.8 produces the same qualitative conclusions. An important caveat: the binary-logit model captures time-and-price geometry but not the structural North American factors — free parking, dispersed land use, weak feeder transit, family-travel norms, cultural autonomy preference — that suppress rail share. Model predictions should be read as upper bounds; realised share is likely 30 to 50% below them. Brightline Miami–Orlando, the closest North American analogue, is in extended ramp-up with bond ratings downgraded to CCC+, indirect confirmation that achievable shares emerge slowly here.

    Sources

    Principal sources

    1.
    ALTO HSR Citizen Research Initiative (2026). HPR Strategy, Chapter 4 — High Performance Passenger Rail (Express journey times). citizenresearch.ca
    2.
    VIA Rail Canada Annual Report 2023; published timetables, station-pair travel times and Economy fare ranges; ridership via Statista (2024) — Montréal–Ottawa–Toronto triangle at 2.1 million passengers.
    3.
    Cirium aviation analytics (2025), via Simple Flying — Toronto Pearson top destinations by capacity; ~930,000 one-way Toronto–Montréal seats on YYZ–YUL alone.
    4.
    Quebec City–Windsor Corridor reference data — ~108 flights per workday within the Toronto–Ottawa–Montréal triangle.
    5.
    Ministry of Transportation of Ontario (2019, 2024). Highway 401 Annual Average Daily Traffic counts; Toronto-area AADT exceeds 450,000 vehicles/day.
    6.
    Statistics Canada Tables 23-10-0253-01 (Air passenger traffic) and 51-204-X (Air Passenger Origin and Destination, Domestic).
    7.
    Currie, G. & Phung, J. (2007). Transit Ridership, Auto Gas Prices, and World Events. Transportation Research Record, 1992. — and Lago, A.M., Mayworm, P.D. & McEnroe, J.M. (1992). Ridership Response to Changes in Transit Services. Transportation Research Record, 818.
    8.
    Wardman, M. (2014). Price Elasticities of Surface Travel Demand: A Meta-analysis of UK Evidence. Journal of Transport Economics and Policy, 48.
    9.
    Mineta Transportation Institute (2017). Modal Shift and High-Speed Rail. P. Haas. — and Moeckel, R. et al. (2013). Mode Choice Modeling for Long-Distance Travel (nested logit, TSRC).
    10.
    Federal Highway Administration (2015). Analysis of Automobile Travel Demand Elasticities With Respect To Travel Cost. — and Litman, T. (VTPI). Transportation Elasticities. vtpi.org
    11.
    International Transport Forum (2019). Roundtable 176: What is the Value of Saving Travel Time? OECD/ITF.
    12.
    Brightline Florida (2024–2026). Monthly Revenue and Ridership Reports; KBRA bond rating actions. — and Geotab (2025). Travel Time vs. Toll Costs: Toronto’s 407 and 401.
    13.
    Ben-Akiva, M. & Lerman, S. (1985). Discrete Choice Analysis. MIT Press. — and Train, K. (2009). Discrete Choice Methods with Simulation, 2nd ed. Cambridge University Press.
    14.
    ALTO HSR Citizen Research Initiative companion notes: Note 1 — Modal shift between high-speed rail and air, and the Modal Shift & Ridership synthesis brief that sets this note alongside Notes 1, 3 and 4.
  • Modal shift HSR air

    Citizen Research Initiative · Modal Shift Analysis · Note 1

    Modal Shift Between High-Speed Rail and Air on the ALTO Corridor

    When does rail substitute for air — and how much of that substitution does ALTO’s 300+ km/h capability actually buy, once the price of the ticket is admitted into the analysis?

    ⚠ What This Note Examines

    This note applies the international evidence on rail–air substitution to the two corridor pairs that account for the bulk of air-substitutable demand — Toronto–Ottawa and Toronto–Montréal — and compares three scenarios on both travel time and price: current VIA Rail service, a High Performance Rail (HPR) alternative at 200 km/h, and ALTO at 300+ km/h.

    The headline question is not whether modal shift happens — the evidence is clear that it does — but where the modal-shift returns sit on the curve, and whether ALTO’s incremental speed is a cost-effective way to capture them.

    Summary

    The international literature converges on a logistic S-curve: rail captures the majority of the combined rail+air market on city pairs with station-to-station times of two to four hours, and rail’s share collapses rapidly above five hours. Both principal Toronto pairs fall inside that competitive zone under any modern dedicated-track scenario.

    The majority of the achievable modal shift on each pair is captured by moving from VIA’s current shared-track service to a dedicated, electrified HPR corridor at conventional 200 km/h speeds. ALTO’s additional 300+ km/h capability captures a further 19 to 20 percentage points at price parity — a real but residual gain.

    Once price enters the analysis, the picture shifts. Under canonical price assumptions — VIA at r ≈ 0.5, HPR at r ≈ 0.7, ALTO at r ≈ 1.0 — ALTO’s apparent 19–20-point time-only advantage shrinks to 11–13 points on the principal Toronto pairs. The cost-per-point of that incremental modal shift is several billion dollars; the cost-per-point of the larger HPR step that precedes it is much lower.

    Download
    Modal Shift Note 1 — Air–Rail Research Note (PDF)
    The full 16-page note with all seven figures, the segment-level travel-time and price analysis, and the methodology and sources
    Download PDF
    1 · Travel Time

    The competitive zone

    The empirical literature on rail–air substitution converges on a consistent set of travel-time thresholds. Studies in Europe, China and Japan identify a competitive break-even of roughly 400 to 600 km (about 2 to 3 hours door-to-door) for short-haul routes, beyond which aviation begins to regain a time advantage. Medium-distance corridors of 600 to 1,100 km show the greatest demand elasticity. Long-haul segments above 1,400 km show minimal substitution — typically below 10 per cent.

    The mechanism is the door-to-door time calculation. Below roughly 700 km, the overhead of reaching the airport, checking in, clearing security, boarding, taxiing and reaching the destination city centre adds enough that total air journey time matches or exceeds high-speed rail. Above this distance, air’s faster line-haul speed begins to dominate, and rail’s share falls steeply once journeys exceed about 4.5 hours.

    This relationship is conventionally modelled as a logistic S-curve. The shape is characteristic: under two hours rail captures essentially the entire air market; between three and four hours rail typically captures 60 to 80 per cent; between four and five hours rail’s share collapses; above five hours rail captures only a residual share. Frequency, station centrality, fare structure and reliability shift the curve up or down by several points but do not change its overall shape.

    Modal-shift S-curve: rail share of the combined rail+air market against station-to-station rail journey time, with short-haul, competitive and long-haul zones marked
    Figure 1. Modal-shift S-curve showing rail’s share of the combined rail+air market as a function of station-to-station rail journey time. Logistic curve fitted with inflection at 3.5 hours and steepness parameter k = 1.3. A short-haul band below 2 hours where rail dominates; a competitive zone between 2 and 4 hours where infrastructure investment can decisively shift modal share; and a long-haul band above 4 hours where rail’s share collapses. All major HSR services in the competitive zone achieve rail shares of 70 to 85 per cent on the rail-vs-air pair.

    Empirical anchors

    Three European routes anchor the baseline. On Paris–Lyon, the TGV cut travel time from almost four hours to about two; rail’s share of the rail+air market rose from 40 to 72 per cent, while air collapsed from 31 to 7 per cent. On Madrid–Seville (471 km, completed 1992), rail share rose from 16 to 52 per cent of all modes. The Madrid–Barcelona AVE — at 621 km and 2 h 30 min the cleanest modern parallel to ALTO’s longer pairs — now carries roughly 75 per cent of travellers on the rail-vs-air pair.

    Asian comparators reach further. The 2019 World Bank review found Chinese 350 km/h services remain competitive with air up to about 1,200 km. Beijing–Shanghai (1,318 km, 4 h 18 min) is the canonical case where high frequency and operating speed maintain rail dominance at distances that would normally favour air; Tokyo–Osaka (552 km, 2 h 22 min) is another textbook 80+ per cent rail-dominant pair.

    Rail wins decisively under three hours, competes strongly at three to four hours, and degrades rapidly after that — with high frequency and central-station access being decisive variables alongside line-haul time.
    2 · Price

    The elasticity factor

    The S-curve in Figure 1 holds prices implicitly at parity. Real modal choice is two-dimensional: passengers weigh both time and price, and the relative price of rail to air shifts the entire curve up or down. A logit choice model with a price-utility term captures this directly — each doubling of the rail-to-air price ratio shifts the curve’s inflection point earlier by an amount that depends on the price coefficient.

    Family of modal-shift S-curves at six rail-to-air price ratios from r=0.4 to r=2.0
    Figure 2. Family of modal-shift S-curves at six rail-to-air price ratios (r = rail price ÷ air price). The middle navy curve is the r = 1.0 parity case from Figure 1. Curves above it show rail priced below air — the whole curve lifts; curves below show rail priced above air, and a corresponding loss of share. The shift is symmetric in log-price.

    How to read the chart

    The simplest use of Figure 2 is as a lookup. Pick a travel time, pick the curve matching the route’s price ratio, and read off the predicted share. A 3-hour journey at parity (r = 1.0) sits at roughly 60 per cent; the same journey at half the air fare (r = 0.5) sits closer to 75 per cent; at 1.5× the air fare (r = 1.5) it drops to around 45 per cent. A faster service at a higher price can deliver lower share than a slower service at a lower price — the family shows how the two effects combine.

    Price sensitivity differs by traveller

    Business travellers show much lower price sensitivity than leisure travellers — elasticities of roughly −0.4 to −0.7 for business against −1.0 to −1.6 for leisure. Each curve is really a weighted average of a flatter business curve and a steeper leisure one.

    Air’s connecting-flight advantage

    Air retains a structural edge the simple model misses: the connecting-flight network. Travellers continuing to long-haul destinations face mode-switching friction at the hub. The modal-share envelope should be read as a ceiling for the rail-substitutable portion of the market, not the air market as a whole.

    On the empirical side, the high-share international routes combine competitive times with rail fares well below air: Madrid–Barcelona AVE Básico fares of €40–70 against air fares of €100–200 put the price ratio in the 0.4–0.6 band. Tokyo–Osaka is the contrasting case — prices roughly comparable (0.7–0.9), but central-station access and reliability sustain rail dominance without a price advantage.

    Modal share depends on time, price, traveller type, and itinerary structure. The family of S-curves captures the first two; the third and fourth shift the realistic envelope further.
    3 · Travel Time on the Corridor

    Where the corridor sits on the curve

    The corridor is not a single market. It is a sequence of overlapping city pairs whose distances place each segment in a different position on the curve. The bulk of air-substitutable demand is concentrated in two pairs: Toronto–Ottawa and Toronto–Montréal. The Toronto–Montréal air market alone runs 900,000+ annual seats. ALTO’s published target times — about 2 hours Toronto–Ottawa and just over 3 hours Toronto–Montréal — both fall inside the zone where international comparators capture 70 to 90 per cent of the rail+air market.

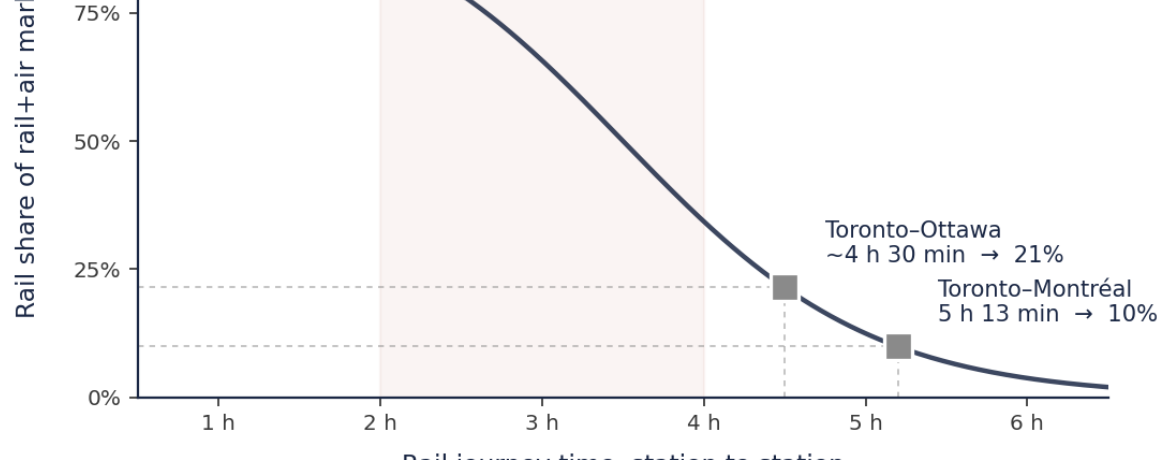
    VIA’s existing Corridor service sits well outside that zone. Toronto–Montréal averages 5 h 13 min over 538 km; Toronto–Ottawa runs 4 to 4.5 hours. Trains are limited to 160 km/h on track shared with CN freight — the principal cause of both slow line-haul speed and poor reliability (on-time performance around 67 per cent as of 2021). Yet the Corridor is VIA’s commercial backbone, contributing 81 per cent of revenue and 95 per cent of ridership.

    Table 1. Indicative travel times for the principal corridor city pairs under each scenario. HPR values are Express journey times published in the CRI HPR Strategy (a dedicated, electrified 401-corridor mainline at 200 km/h); ALTO values are the published targets for the 300+ km/h network. *Toronto–Montréal under current VIA service runs 5 h 13 min on the 538 km direct routing.
    City pairDistanceVIA currentHPR (200 km/h)ALTO (300+ km/h)
    Toronto–Ottawa~450 km~4 h 30 min~2 h 55 min~2 h
    Toronto–Montréal~540 km5 h 13 min*~3 h 38 min~3 h
    Ottawa–Montréal~190 km~1 h 55 min~1 h 30 min~1 h

    Plotted onto the S-curve, these times produce three pictures. Each panel highlights the two principal Toronto pairs under one scenario; the contrast between panels traces the modal-shift trajectory at price parity as corridor infrastructure improves.

    Current VIA Rail service plotted on the S-curve: Toronto-Ottawa at 21% and Toronto-Montreal at 10%
    Figure 3a. Current VIA Rail service. Both principal Toronto pairs sit well below the inflection point: Toronto–Ottawa at ~4 h 30 min captures around 21% of the rail+air market, and Toronto–Montréal at 5 h 13 min around 10%. The corridor’s air-substitutable demand is structurally outside the competitive zone.
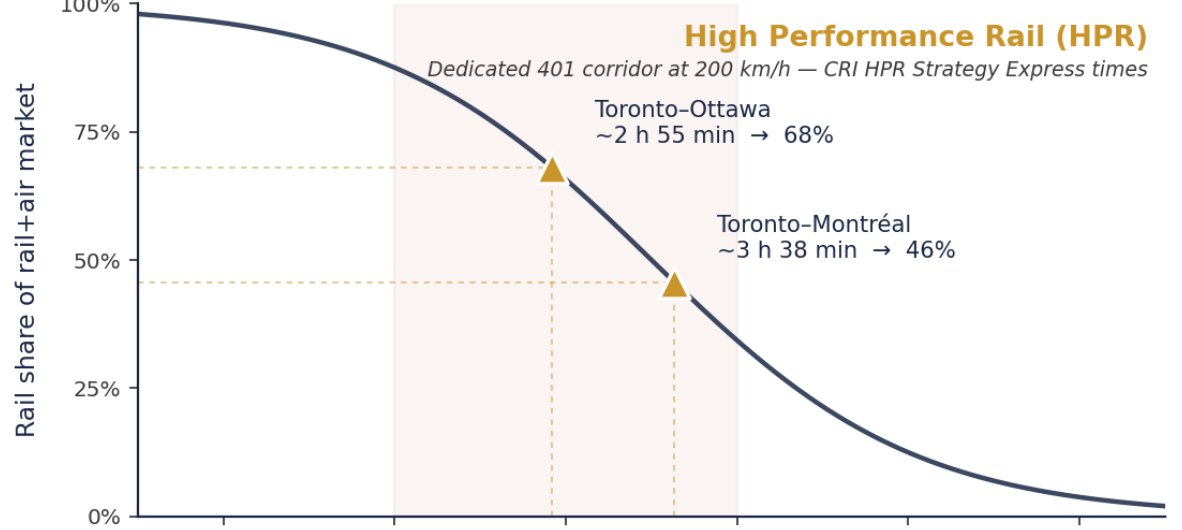
    High Performance Rail at 200 km/h on the S-curve: Toronto-Ottawa at 68% and Toronto-Montreal at 46%
    Figure 3b. High Performance Rail at 200 km/h on a dedicated, electrified 401-corridor mainline (CRI HPR Strategy Express times). Toronto–Ottawa moves to ~68% rail share at price parity; Toronto–Montréal to ~46% — across the inflection but still in the steeper portion of the curve.
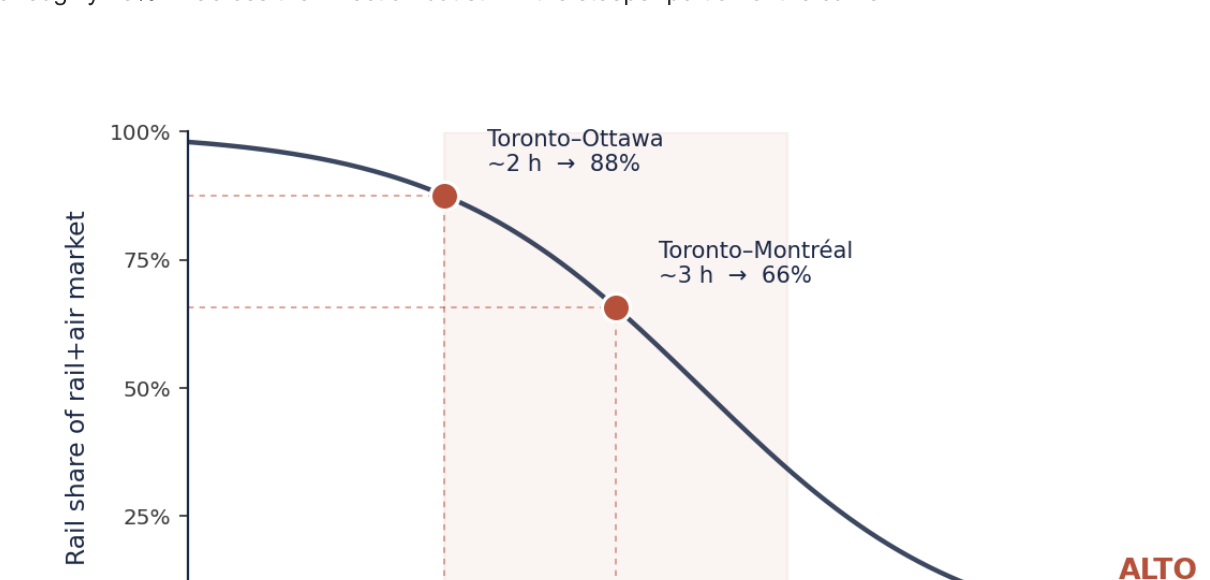
    ALTO at 300+ km/h on the S-curve: Toronto-Ottawa at 88% and Toronto-Montreal at 66%
    Figure 3c. ALTO at 300+ km/h on a dedicated 1,000 km HSR network (published targets). Toronto–Ottawa moves onto the upper plateau at ~88% rail share at price parity; Toronto–Montréal to ~66% — still on the steeper portion, where additional time savings continue to produce meaningful gains.
    Table 2. Predicted rail share of the combined rail+air market on each principal pair under each scenario, derived from the logistic curve in Figure 1 with prices held at parity. Order-of-magnitude estimates; actual shares would also depend on fare structure, frequency, reliability, station accessibility, and traveller mix.
    City pairVIA currentHPR (200 km/h)ALTO (300+ km/h)
    Toronto–Ottawa~21%~68%~88%
    Toronto–Montréal~10%~46%~66%

    These are the time-only readings — what each scenario would deliver if its fares matched air. In practice, fares depend on capital structure, and the three scenarios sit at quite different points on the price axis.

    4 · Price on the Corridor

    Where the corridor sits on the price axis

    Current VIA Toronto–Montréal Economy fares of $80–120 against Air Canada fares of $200–400 put VIA at a price ratio of roughly 0.5 — the same band as Madrid–Barcelona. The structural fare advantage is already in place; the binding constraint on current rail share is travel time, not price.

    Whether each new-build scenario preserves a fare advantage depends on capital-cost recovery. The CRI HPR Strategy estimates corridor capital in the order of $19 million/km — roughly $19–25 billion for the full Windsor–Montréal programme — producing annual debt service of $1.0–1.3 billion. Under the standard public-infrastructure subsidy model, HPR fares could plausibly sit at a modest premium over current VIA, placing HPR at r ≈ 0.7. ALTO’s $60–90 billion envelope produces debt service three to four times higher; under a fare cap holding the ratio at parity, ALTO settles at r ≈ 1.0, with subsidy absorbing the capital-cost gap.

    For the corridor’s three scenarios, plausible operating price ratios are: VIA at r ≈ 0.5 (current subsidised rail), HPR at r ≈ 0.7 (modest premium, partial capital recovery), ALTO at r ≈ 1.0 (parity with air, subsidy absorbing the larger debt-service gap).
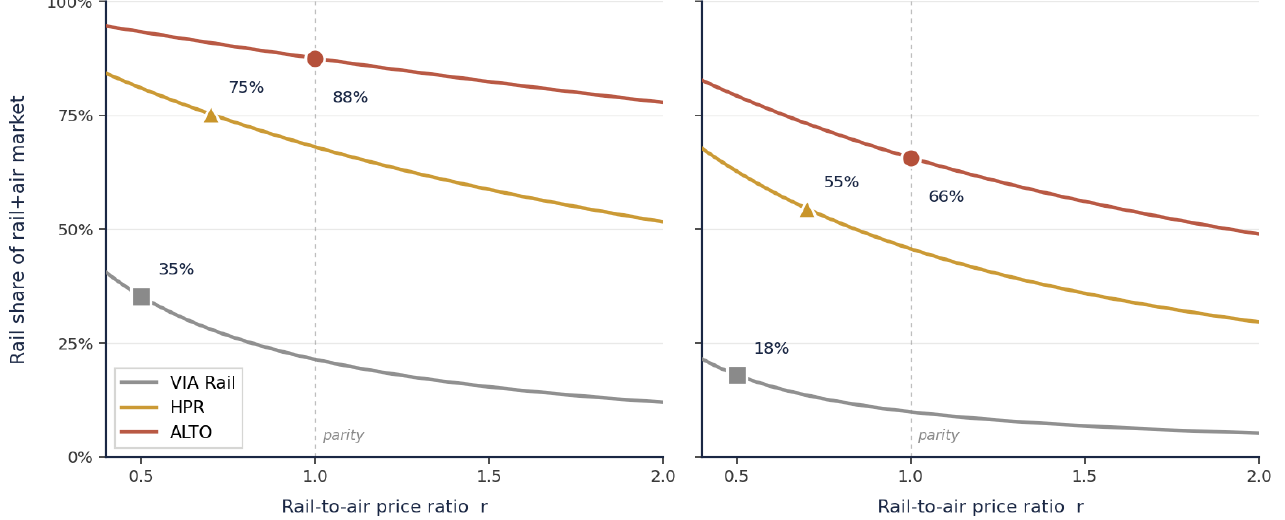
    Modal share as a function of rail-to-air price ratio for each scenario on Toronto-Ottawa and Toronto-Montreal
    Figure 4. Modal share as a function of rail-to-air price ratio, with each scenario’s travel time held fixed at its published value. Markers indicate the canonical operating ratio: VIA at r = 0.5, HPR at r = 0.7, ALTO at r = 1.0. The vertical separation between lines shows how much share is driven by infrastructure; the slope of each line shows how price-sensitive that scenario is at its operating point.

    At their canonical ratios, the Toronto–Montréal scenarios deliver 18 per cent (VIA), 55 per cent (HPR) and 66 per cent (ALTO). ALTO retains an 11-point advantage over HPR — markedly smaller than the 20-point gap the price-parity readings imply, because ALTO’s higher capital cost drags its price ratio up the curve while HPR keeps a price advantage. On Toronto–Ottawa, both new-build scenarios sit high on the curve where price effects are smaller: ALTO ~88%, HPR ~75% — a 13-point gap. If HPR were held at the current VIA ratio (r ≈ 0.5), the gaps would close to 3 and 7 points respectively.

    The HPR pricing lever, with ALTO held at parity

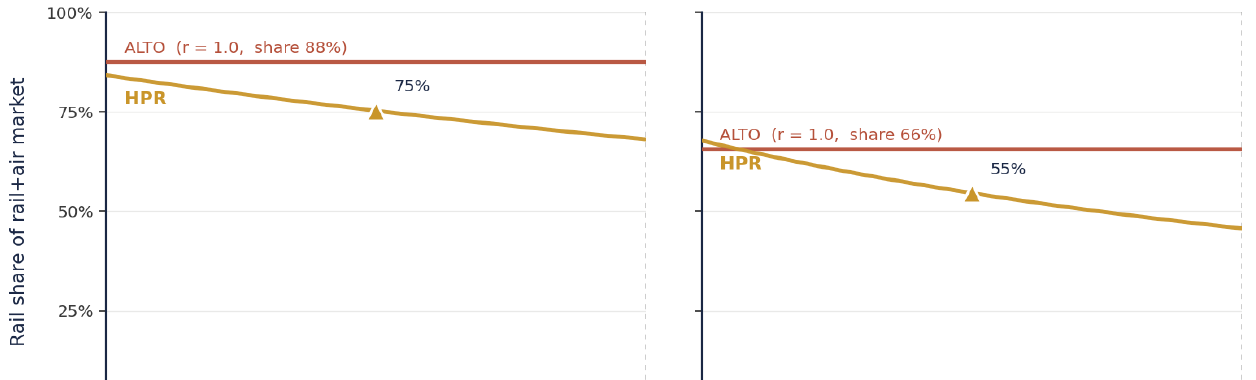
    Fixing ALTO at parity and varying HPR’s fare relative to it puts the pricing decision directly in front of the reader.

    HPR and ALTO modal share as a function of the HPR-to-ALTO fare ratio, ALTO held at parity
    Figure 5. HPR and ALTO modal share as a function of the HPR-to-ALTO fare ratio, ALTO fixed at parity (r = 1.0). ALTO’s share appears as a flat reference; HPR’s varies along the gold curve. Markers show the canonical HPR/ALTO = 0.7 operating point.
    ALTO minus HPR modal-share differential as a function of the HPR-to-ALTO fare ratio
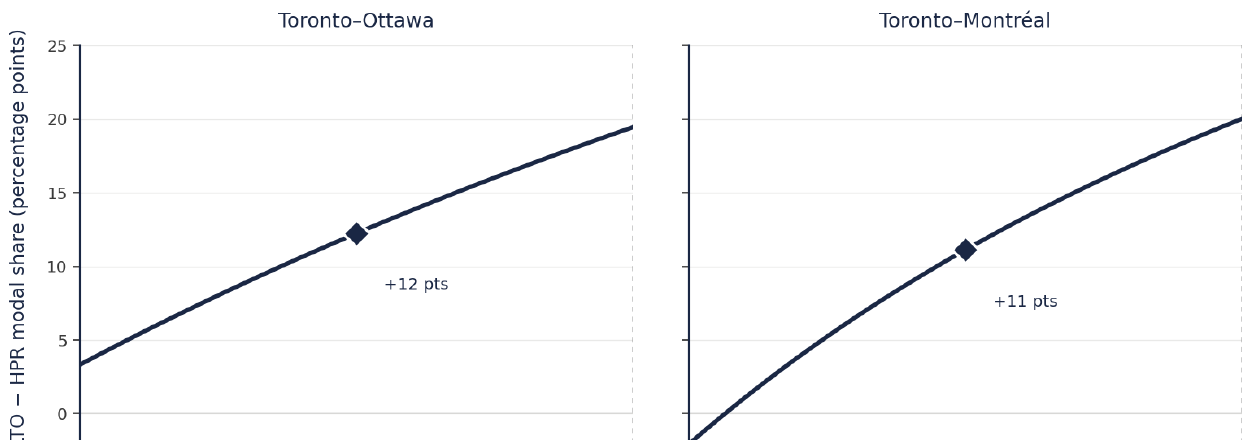
    Figure 6. ALTO − HPR modal-share differential. The gap rises from ~7 points (Toronto–Ottawa) and 3 points (Toronto–Montréal) at HPR/ALTO = 0.5, to 19–20 points at parity. The diamond marks the canonical 0.7 point: 12 points on Toronto–Ottawa, 11 on Toronto–Montréal.

    The two figures make explicit what the canonical readings imply: ALTO’s modal-shift advantage is highly contingent on HPR’s pricing model. Hold HPR fares near current VIA levels and the gap is 3 to 7 points; let them drift to 70 per cent of ALTO’s and the gap is 11 to 13; let them converge entirely and the full 19–20-point time-only advantage returns. The corridor decision is as much a question about HPR’s intended subsidy structure as about the choice of infrastructure — a question in the operator’s hands, not the engineer’s.

    5 · Where the Returns Sit

    Where the modal-shift returns sit on the curve

    Because the curve is logistic — flat at the top, steep in the middle, flat at the bottom — the value of additional time savings depends critically on where a route starts. On Toronto–Montréal, moving from VIA’s 5 h 13 min to HPR’s 3 h 38 min crosses much of the steep middle and delivers a large gain; the further move to ALTO’s 3-hour service stays in the steeper portion and adds a meaningful increment. On Toronto–Ottawa, HPR’s 2 h 55 min already places the route high on the curve, so ALTO’s 2-hour service produces smaller share gains.

    Decomposition of modal-shift gain by investment step: VIA to HPR versus HPR to ALTO on each principal pair
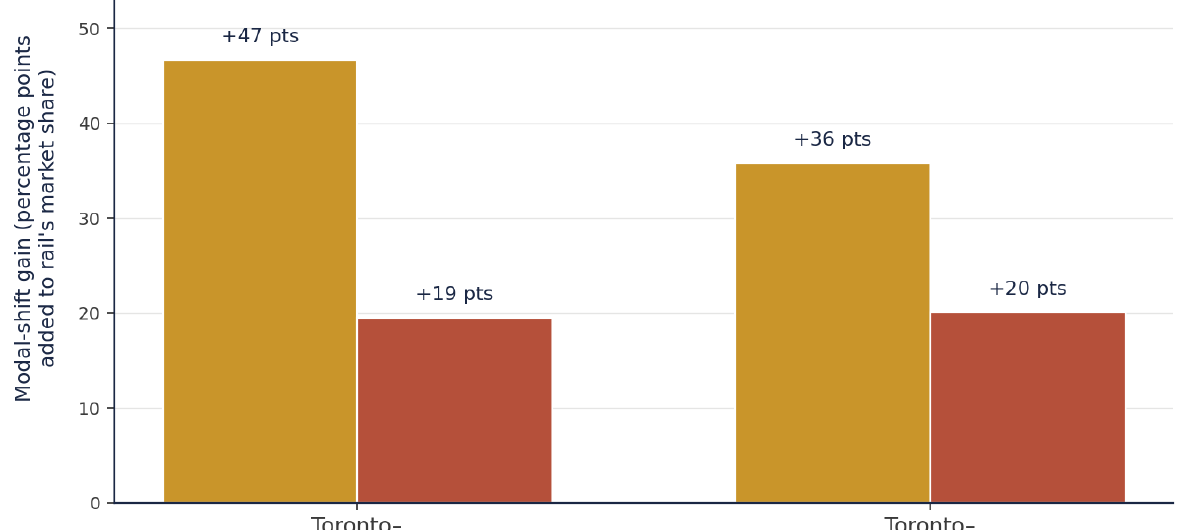
    Figure 7. Decomposition of modal-shift gain by investment step. Gold bars show the percentage-point gain from VIA to HPR; terracotta bars show the additional gain from HPR to ALTO. At price parity, the HPR step delivers 36–47 points across the two pairs; the additional ALTO step delivers 19–20 points.

    On Toronto–Ottawa, the VIA-to-HPR move captures an estimated 47 points of modal shift; the further HPR-to-ALTO move adds 19. On Toronto–Montréal, HPR captures 36 and ALTO adds 20. The HPR step delivers the majority of the achievable shift on both pairs (roughly 65 to 70 per cent of the total), but the residual ALTO increment is real at price parity.

    36–47
    Percentage points captured by the VIA → HPR step (at parity)
    19–20
    Additional points from HPR → ALTO at parity — 11–13 once priced
    $3–6B
    Incremental capital cost per percentage point of ALTO-only modal shift
    HPR delivers the majority of the achievable modal shift on both Toronto pairs at price parity. ALTO’s additional speed adds 19 to 20 percentage points — a residual that shrinks to 11 to 13 once the canonical price assumptions are applied.

    The cost-effectiveness comparison sharpens this. ALTO’s $60–90 billion envelope is an incremental investment of $40–70 billion above the HPR option. Spread across the 11 to 13 incremental points ALTO captures over HPR under realistic pricing, that works out to roughly $3 billion to $6 billion per percentage point — several times worse than the HPR step that precedes it.

    6 · Implications

    What this means for the corridor decision

    Four conclusions follow from putting the international literature, segment-level travel times, and the price dimension alongside one another.

    The opportunity is real and concentrated

    The corridor’s modal-shift potential is well-supported by international evidence and concentrated in two pairs — Toronto–Ottawa and Toronto–Montréal. Modelling the corridor as a single 1,000 km market obscures this. The real question is segment-level time and price, not headline line-haul speed.

    HPR does the larger part of the work

    On time alone, HPR’s Express times place both principal pairs into the upper portion of the curve. ALTO captures a real 19–20-point incremental gain — but residual relative to the larger HPR step, and several times more expensive per point of shift purchased.

    Price reduces ALTO’s advantage

    Under canonical ratios, ALTO’s advantage narrows from 20 points at parity to 11 points on Toronto–Montréal and 13 on Toronto–Ottawa. If HPR ran at the current VIA ratio, the gap would close further still — to 3 and 7 points.

    This is the HPR regime

    This is precisely where the literature finds frequency, reliability, station-centrality and price to matter more than headline speed. Capturing the bulk of the opportunity does not require operating at the global frontier of high-speed technology.

    The corridor is a textbook case of why high-speed-rail claims need to be unbundled. The modal-shift opportunity is genuine. The majority of it is captured by conventional high-performance speeds on a dedicated, electrified, reliable corridor priced competitively against air. ALTO’s additional 300+ km/h capability buys a real but reduced gain once realistic pricing is admitted — between 11 and 13 percentage points on the principal Toronto pairs, at an incremental capital cost of $40–70 billion. Whether the corridor decision turns on the right framework — segment-level, two-dimensional analysis of time and price — is what determines whether the public investment achieves the modal-shift outcome it is intended to produce.

    Download Full Note
    Modal Shift Note 1 — Air–Rail Research Note (PDF)
    Reference document with the full methodology, sensitivity analysis, and the complete source list
    Download PDF
    Methodology

    Modelling approach

    The S-curve is a standard logistic of the form S(t) = 1 / (1 + exp(k·(t − t₀))), where S(t) is rail’s share of the combined rail+air market as a function of station-to-station journey time t. The parameters are k = 1.3 and t₀ = 3.5 hours, calibrated by visual fit to the international comparator data. The family of curves adds a price-utility term: S(t, r) = 1 / (1 + exp(k·(t − t₀) + γ·ln r)), where r is the rail-to-air price ratio and γ = 1.0 the price coefficient.

    This binary-logit specification is the simplest defensible form of the time–price modal-choice model used routinely in transport demand work. More elaborate discrete-choice models add regressors for frequency, station access, reliability and demographics, but tend to confirm the same S-shaped relationship and the same direction of the price effect. The parameters here should be treated as illustrative rather than predictive; sensitivity analysis at k between 1.0 and 1.6, t₀ between 3.0 and 4.0 hours, and γ between 0.6 and 1.4 produces the same qualitative conclusions about HPR’s performance and ALTO’s price-driven degradation of the time advantage.

    Sources

    Principal sources

    1.
    ALTO HSR Citizen Research Initiative (2026). HPR Strategy, Chapter 4 — High Performance Passenger Rail (Express journey times). citizenresearch.ca
    2.
    International Council on Clean Transportation (2022). The bullet train to lower-carbon travel.
    3.
    Mineta Transportation Institute (2017). Modal Shift and High-Speed Rail: A Review of the Current Literature. P. Haas.
    4.
    World Bank Group (2019). China’s High-Speed Rail Development.
    5.
    Bergantino, A. & Madio, L. (2020). Intermodal competition and substitution: HSR versus air transport. Research in Transportation Economics, 79.
    6.
    AECOM (2011). High-Speed Rail Overseas Experience Report. C. Nash.
    7.
    Sun, X. et al. (2024). A review on research regarding HSR interactions with air transport. Transport Policy, 157.
    8.
    Wardman, M. (2014). Price Elasticities of Surface Travel Demand: A Meta-analysis of UK Evidence. Journal of Transport Economics and Policy, 48.
    9.
    Ben-Akiva, M. & Lerman, S. (1985). Discrete Choice Analysis: Theory and Application to Travel Demand. MIT Press. — and Train, K. (2009). Discrete Choice Methods with Simulation, 2nd ed. Cambridge University Press.
    10.
    Comisión Nacional de los Mercados y la Competencia (CNMC), annual rail market reports for Spain; VIA Rail Canada Annual Report 2023 and published timetables, travel times and Economy fare ranges; Alto Inc. published travel-time targets and corridor descriptions (February 2025 announcement).
    11.
    Energies (2025). Emission Reductions in the Aviation Sector: A Systematic Review of the Sustainability Impacts of Modal Shifts.
    12.
    ALTO HSR Citizen Research Initiative companion material: the Modal Shift & Ridership synthesis brief, which sets this note alongside Notes 2–4 (rail–car substitution, the ridership envelope, and the operating-subsidy frontier).
  • Acquiring the neighbourhood

    Acquiring the Neighbourhood

    What ALTO says publicly about land acquisition — the 60-metre right-of-way — and what a federal procurement document, released under Access to Information, shows the project was designed to do around its stations.

    ⚠ Document Under Analysis

    A Protected A federal slide deck — Subject-Specific Meeting #4B on Housing, dated April 10, 2024 — was released under Access to Information (file A-2025-00223, interim package). It was prepared for the consortia then bidding to become the project’s Private Developer Partner, roughly a year before the public consultations.

    The deck sets out a federal strategy to use the rail project as a vehicle for housing and Transit-Oriented Development around each of the proposed station locations. Its first pillar is to acquire station-area land and define a framework for its development. ALTO has made no public statement about land value capture or station-area land assembly, and frames acquisition publicly around the 60-metre right-of-way alone.

    Critical Finding

    The public discussion of ALTO expropriation runs together three different things. The first — the linear taking of a 60-metre right-of-way — is well documented. The second — fiscal and regulatory value-capture tools such as levies, charges and tax-increment financing — requires taking no one’s home. The third — station-area land assembly, in which a public body acquires a development portfolio around a station — does involve acquisition, and can reach beyond the operational footprint toward station-area homes; it is the variant urban residents have reason to watch.

    The released procurement deck shows that the third was designed into the project at the bidding stage. The honest qualification, drawn from the federal government’s own infrastructure bank, is that the financial payoff Canadian evidence supports for this kind of assembly is modest and market-dependent — which raises a value-for-money question, not only an expropriation one.

    Download
    Acquiring the Neighbourhood — Full Brief (PDF)
    The three takings — right-of-way, fiscal value capture, station-area assembly — set against the released A-2025-00223 procurement deck and the Canada Infrastructure Bank’s own land value capture evidence
    Download PDF
    The Question

    A procurement notice that asks for more than track

    In February 2026, Transport Canada published a tender for Financial Advisory Services to the high-speed rail initiative (solicitation T8080-240075). Among the advisory categories it lists are two that belong to a specific vocabulary: “Land value capture and community benefits advisory services” and “Transit-oriented Development and community benefits advisory services.” Transport Canada was, in other words, procuring the capacity to do land value capture — even though ALTO itself has said nothing public about it.

    Land value capture (LVC) is the principle that public investment — a new station — raises the value of nearby land, and that the public purse can reclaim part of that uplift to help pay for the investment that created it. It is a respectable idea with a long international history. The question this brief addresses is narrower and more practical: how likely is LVC to feature in ALTO, and what would it mean for expropriation for people who live near a prospective station in Ottawa, Toronto or Montreal?

    Until recently, the honest answer was “likely as a financing rationale, but the public record confines acquisition to the right-of-way.” A document released under Access to Information now allows a sharper answer.

    The Released Document

    What the procurement deck shows

    The deck released under file A-2025-00223 is a Protected A federal presentation, “Housing and Transit-Oriented Development (TOD) — High Frequency Rail (HFR) Project, Subject-Specific Meeting #4B,” dated April 10, 2024. Its audience was the consortia then bidding to become the Private Developer Partner (PDP). Its purpose, stated on its own opening slide, was to explore how the project “can serve as a catalyst for housing development” and to describe Canada’s vision for “leveraging Transit-Oriented Development” near railway hubs.

    Three features of the deck bear directly on the expropriation question.

    A four-pillar housing strategy

    Pillar 1, “Land & Real Property,” is to “identify lands along the proposed Alignment for station hubs and define a framework for their usage.” Pillar 4 is to leverage funding programs to “increase housing supply near station hubs.”

    An acquire-then-develop sequence

    The Provisional Guidelines slide states it plainly: “Canada would acquire the lands needed for the project and would explore with the PDP opportunities to optimize the development of station hubs.”

    A worked visual concept

    The deck renders an aerial of an Ottawa station hub ringed by mid- and high-rise towers — labelled a VIA HFR/QMOT 2023 concept, “for information and conceptual illustration only.”

    The construction of that middle sentence is the heart of the matter. Canada acquires; Canada and the PDP then develop. That public-acquisition-then-development sequence is the defining shape of the land-assembly variant of value capture — the Hong Kong “Rail + Property” family of models — not of a simple right-of-way taking. The federal housing department of the day (then Infrastructure Canada, INFC; now Housing, Infrastructure and Communities Canada, HICC) appears throughout as a named party, alongside VIA-HFR, Transport Canada and the PDP.

    This matters because it changes what kind of claim the Initiative can responsibly make. It is no longer necessary to infer a development intent from a procurement notice. The intent was set out, in a federal deck, to the people bidding to build the railway, a year before the public was consulted.

    Three Different Takings

    What “land acquisition” actually covers

    The single phrase “land acquisition” is doing the work of three quite different things. They differ in what they take, from whom, and at what scale. Distinguishing them is the whole of the analysis.

    Taking 01 The right-of-way
    What ALTO says publicly

    Acquisition is framed around a “final right-of-way” of about 60 metres in width; the corporation will seek negotiated agreements at market value before resorting to expropriation.

    ALTO public statements, May 2026

    What it is

    A linear taking: a continuous strip of land for track. The CEO has estimated the Ottawa–Montreal segment alone would cross roughly 1,700 properties, including about 500 farms.

    Bill C-15 sharpens the federal acquisition powers: first right of refusal on coveted properties, prohibition-of-work orders, the ability to skip negotiation and go straight to expropriation, with objections routed to the Minister of Transport rather than an independent hearing.

    Why this matters This is the taking the public debate already knows. It is real, it is large, and it is the source of the rural alarm along the southern corridor. But it is a strip — its footprint is the width of the line. It is not the mechanism by which a neighbourhood around a station would change hands.
    Taking 02 Fiscal & regulatory value capture
    The vocabulary in the tender

    “Land value capture and community benefits advisory services”; “Transit-oriented Development and community benefits advisory services.”

    Transport Canada tender T8080-240075, February 2026

    What it is

    Four of the five LVC classes catalogued by the Canada Infrastructure Bank are fiscal or regulatory: infrastructure levies, development charges, density bonuses, and tax increment financing.

    None of these requires taking anyone’s home. A homeowner near a station can be subject to a levy or a higher assessment without being expropriated at all. Montreal’s REM, for example, uses a $10/sq ft development charge in a zone around its stations — a tax, not a taking.

    Why this matters This is the part of “land value capture” that the alarmed reading of the tender gets wrong. Most LVC tools are taxes and zoning levers, not seizures. If ALTO’s value capture took this form, the effect on station-area residents would be financial — higher charges on new development, possibly passed through to buyers and renters — not displacement. The CIB notes the recognised downside here is “double taxation” concerns and pass-through to affordability, not expropriation.
    Taking 03 Station-area land assembly
    What the deck describes

    “Canada would acquire the lands needed for the project and would explore with the PDP opportunities to optimize the development of station hubs.”

    A-2025-00223, Provisional Guidelines slide (April 10, 2024)

    What it is

    The fifth CIB class: “Land Acquisition, Investment and Disposition” — the public body acquires a land portfolio, then sells, leases, or jointly develops it. The CIB names the Hong Kong MTR Rail + Property model as the archetype.

    The McGill TRAM study’s explicit recommendation is to “empower Alto to lead development and value capture within 2 km around the stations.” Two kilometres around a station is not a platform footprint — it is a neighbourhood.

    Why this matters This is the taking that touches urban homes, and it is the one the released deck shows was designed in. A station chosen for its “intensification potential” is, by definition, a station where the public body has reason to acquire more than the operational footprint. The C-15 powers attach to “lands needed for the project” — and the project’s own 2024 design defined “needed” to include development land for station hubs, not merely track and platform.
    Where the Threads Converge

    The Ottawa case

    Map of the Ottawa and Tremblay station area showing the Eastway Gardens neighbourhood east of the existing stations
    Ottawa and Tremblay station area, showing the Eastway Gardens neighbourhood east of the existing stations. Map by Ottawajin, via Wikimedia Commons, licensed under CC BY-SA 4.0. Unmodified.

    Eastway Gardens — the residential pocket east of the Tremblay Road stations, known locally as Ottawa’s “Alphabet Village” for its lettered avenues — is where the abstract distinction becomes concrete. Reporting in the Ottawa Citizen in May 2026 found a neighbourhood already living with the prospect: Alta Vista Councillor Marty Carr, who represents the area, said “the majority of residents in that neighbourhood think that it’s likely that a station would come there,” and described “a lot of trepidation, and a lot of unknowns,” with homeowners “very worried about expropriation.” Alto has identified the area as a potential Ottawa stop, and Carr believes “the space exists” on an empty parcel along Tremblay Road between Avenue U and St. Laurent Boulevard.

    What makes that site attractive is the most telling detail in the reporting. Rideau-Vanier Councillor Stéphanie Plante — whose ward contains the downtown alternative, the former Union Station now serving as the Senate building — recounted what Alto had explained to her about the Tremblay option: “they have the space, it can be developed, the lands are ready to go.” David Jeanes of Transport Action Canada, who attended an Alto roundtable, noted the Tremblay area’s “significant intensification potential.” These are land value capture arguments in everything but name — and, in Plante’s account, they are Alto’s own framing of why Tremblay is preferred. The McGill study’s logic — prioritise “nodes with strong redevelopment and value-appreciation prospects rather than built-out downtown cores” — is exactly that reasoning, and it runs the same direction: toward the developable, ready site and away from the constrained downtown one. Alto’s CEO has said an above-ground station at the Senate building would “completely destroy the neighbourhood”; the Transport Minister cited the 2016 Rideau Street sinkhole and “geotechnical challenges” against it while praising the existing Tremblay station.

    The expropriation question is, in the same reporting, explicitly an urban one and not only a rural one. The CEO estimated to Radio-Canada that the roughly 200 km of track between Ottawa and Montreal would cross about 1,700 properties, including some 500 farms — the linear taking. But residents along Avenue U voiced the wider worry directly, one noting the “really nice big space” between Avenue U and St. Laurent that a station might consume. The conceptual aerial in the released deck is, pointedly, an Ottawa station hub ringed by towers. A site chosen partly for its redevelopment headroom is the site where the gap between a right-of-way taking and station-area assembly is most likely to be tested. The Eastway Gardens trepidation is, on this evidence, responding to something real in the project’s own design documents — even as the public-facing messaging confines itself to the 60-metre strip.

    The Honest Qualification

    What the federal evidence says the payoff is

    The case for watching station-area assembly does not rest on assuming it will be lucrative. The opposite is closer to the truth, and it is the federal government’s own infrastructure bank that says so. The 2023 Canada Infrastructure Bank land value capture study — authored at the University of Toronto’s Infrastructure Institute — is sober about how much development-based LVC actually raises in Canada.

    Modest sums, in practice

    The study’s author characterises the record this way: rail-project value capture typically generates “tens of millions to hundreds of millions of dollars,” with only schemes catalysing large amounts of high-density development in high-value locations generating over a billion. Against an ALTO capital cost of $60–90 billion, the typical case is a rounding error per site; the billion-dollar case depends on exactly the intensification a site like Tremblay is being chosen for.

    Hong Kong does not transplant

    The Rail + Property model depends on Hong Kong’s state leasehold land tenure. The CIB is explicit that Canadian station areas have “fragmented ownership involving multiple public and private entities,” which makes the land assembly that powers the model difficult to convene.

    This cuts two ways, and the Initiative should present both. It tempers the alarm: the financial incentive for aggressive, wholesale neighbourhood acquisition is weaker in the Canadian context than the McGill 15%-of-capital scenario implies, because the revenue simply has not materialised at that scale here. But it also sharpens a different concern. If the development-revenue payoff is modest and market-dependent, then the expropriation footprint of station-area assembly may be incurred for a fiscal benefit that does not arrive. That is a value-for-money question — the same family of question the Initiative’s subsidy-frontier work raises elsewhere — and it is at least as important as the expropriation question itself.

    The McGill financial model illustrates the tension. Its self-sufficiency scenario depends on LVC contributing the equivalent of 15% of capital cost — on the order of C$12 billion against its C$79.8 billion construction estimate. The CIB’s evidence on realised Canadian deals suggests that figure is optimistic by a wide margin. The residents’ exposure, in other words, rests on a development-revenue premise that the more cautious Canadian evidence questions.

    On this point the study’s author has spoken directly to the project. In a submission to the Senate Standing Committee on Transport and Communications, Matti Siemiatycki — who broadly supports value capture “as a matter of complementary public policy” — cautioned that the revenue-generating potential of LVC on the high-speed rail line is “likely limited by the few stations that Alto is proposing.” That is the author of the very study being applied to ALTO by name, reaching the same conclusion this section reasons toward: the development-revenue case is real but constrained, and the constraint is structural. (The caution is about how much LVC will recoup, not about expropriation; the inference that a constrained payoff weakens the case for an enlarged acquisition footprint is the Initiative’s.)

    Side by Side

    Three takings, one project

    Read together, the three takings are not interchangeable. They differ in shape, in who is exposed, and in what the public record acknowledges.

    Right-of-way

    Shape:Linear strip (~60 m)

    Exposed:Corridor owners; ~1,700 properties Ott–Mtl

    Public?Acknowledged

    Fiscal capture

    Shape:Levies, charges, TIF

    Exposed:New development; no homes taken

    Public?In tender only

    Station assembly

    Shape:Beyond the footprint (McGill: up to 2 km)

    Exposed:Development land around the station

    Public?In 2024 deck; not acknowledged publicly

    The pattern is the disclosure asymmetry. The linear taking is discussed openly. The fiscal tools appear only in a procurement notice. The station-area assembly — the acquisition of development land beyond the line itself — was set out to bidders in 2024 and has not been part of any public ALTO communication since. That gap, now documented rather than inferred, is the brief’s subject.

    The honest answer

    How likely is land value capture — and what would it mean?

    As with the cost and ridership questions, the answer depends on what is being asked.

    Is LVC likely to feature in ALTO? On the evidence, yes — as a design intent. It is resourced in the tender, named in the federal housing mandate, modelled by McGill, and set out to bidders in the 2024 deck. What is not established is that it has survived into the Co-Development Phase as an executed land-assembly program. The deck is a procurement-stage document in the conditional voice — “would acquire,” “to be refined” — describing intent and a negotiating posture, not a finalised plan.

    What would it mean for expropriation? That depends entirely on which of the three takings is meant. If ALTO’s value capture takes the fiscal form — levies and charges — the effect on station-area residents is financial, not displacement. If it takes the station-assembly form the 2024 deck describes, the effect can reach beyond the line into development land around the station — how far being the unanswered question — and the C-15 powers apply to that land as “needed for the project.” The deck shows the second was designed in; it does not show it has been executed.

    The defensible position is therefore precise. The most alarming claim — “LVC means ALTO will expropriate your neighbourhood” — is not supported, and the CIB’s own evidence on modest Canadian returns argues against wholesale assembly being worth the trouble. But the reassuring claim — “acquisition is only the 60-metre right-of-way” — is contradicted by the federal government’s own procurement deck. The truth sits between the public messaging and the public fear, and the released document is what lets the Initiative locate it.

    For the next federal statement

    Three questions to ask

    Where the next federal statement on ALTO land is concerned — whether in a corporate plan, a consultation report, or a public communication from ALTO — three questions follow.

    1. On scope of acquisition: Does “land needed for the project” mean the operational right-of-way only, or does it include development land for station hubs? If the latter, what is the geographic extent around each station, and on what basis is that land “needed”?
    2. On mechanism: Which form of value capture is contemplated — fiscal tools (levies, charges, TIF) that take no homes, or land assembly that does? If assembly, what is the expected development revenue, against what acquisition cost and footprint?
    3. On the business case: Given the Canada Infrastructure Bank’s own finding that Canadian development-based LVC has typically raised tens to hundreds of millions per deal — only the largest schemes exceeding a billion — what justifies the McGill model’s assumption of LVC at 15% of a $60–90 billion capital cost, and what expropriation footprint is being incurred to chase it?

    None of these questions presupposes opposition to housing near transit, which is a widely shared public good. Each asks only that the project state plainly what its own 2024 design documents already contemplate — so that residents near a prospective station can know whether they are reading about a tax, a strip, or a neighbourhood.

    There is also a constructive remedy already on the record. In his Senate submission, Siemiatycki recommends that the Bill C-15 acquisition powers “should only be used as a last resort,” and that “the original landowners should be given first right of refusal to repurchase any expropriated land not used for the project.” That second safeguard is precisely calibrated to the concern this brief identifies: a right to repurchase land not used for the project only matters if the project might acquire more than it uses — the surplus-acquisition dynamic that station-area assembly creates. Adopting it would cost the project nothing it needs and would directly answer the station-area resident’s fear.

    Download Full Brief
    Acquiring the Neighbourhood (PDF)
    Reference document for federal decision-makers, parliamentarians, journalists, and residents near prospective station sites
    Download PDF
    Where Things Stand

    Two accounts, one of them public

    As of May 2026, ALTO’s public account of land acquisition is the 60-metre right-of-way. The federal procurement record released under Access to Information shows that, a year before the public consultations, the project was being co-developed with bidders as a vehicle for housing and Transit-Oriented Development whose first pillar was to identify and acquire station-area land. The two accounts are not contradictory, but the second is materially larger than the first — and only the first has been put to the public.

    Sources

    Primary documents and references

    1.
    Housing and Transit-Oriented Development (TOD), High Frequency Rail (HFR) Project, Subject-Specific Meeting #4B, April 10, 2024. Government of Canada slide deck (Protected A), released under the Access to Information Act, file A-2025-00223 (interim release package). The document predates the ALTO rebrand and names Infrastructure Canada (INFC), now Housing, Infrastructure and Communities Canada (HICC).
    2.
    Public Services and Procurement Canada / Transport Canada, “Financial Advisory Services to Transport Canada for the High-Speed Rail (HSR) Initiative,” solicitation T8080-240075, CanadaBuys, published February 20, 2026. Source of the “land value capture” and “transit-oriented Development” advisory categories. canadabuys.canada.ca
    3.
    Siemiatycki, M., Fagan, D., & Arku, R.N. (2023). Land Value Capture Study: Paying for Transit-Oriented Communities. Infrastructure Institute, School of Cities, University of Toronto, supported by the Canada Infrastructure Bank. Source of the five-class LVC taxonomy, the realised-deal range (tens of millions to hundreds of millions, with only the largest schemes exceeding a billion), and the fragmented-ownership finding. cib-bic.ca
    4.
    Siemiatycki, M. Submission on High-Speed Rail to the Senate Standing Committee on Transport and Communications. Infrastructure Institute, School of Cities, University of Toronto. Source of the author’s ALTO-specific judgment that LVC revenue is “likely limited by the few stations that Alto is proposing,” and of the recommendation that Bill C-15 powers be used only “as a last resort” with original landowners given first right of refusal to repurchase any expropriated land not used for the project. Distinct from the 2023 study at source 3.
    5.
    El-Geneidy, A., Anabtawi, R., Zhang, B., Carvalho, T., Negm, H., Alousi-Jones, M. & Page, M. (December 2025). Importance of Land Value Capture regarding the Canada High-speed Rail. Transportation Research at McGill (TRAM), McGill University. Source of the 15%-of-capital scenario and the “within 2 km around the stations” recommendation. tram.mcgill.ca
    6.
    Transport Canada, High-Speed Rail Initiative from Toronto to Québec City — departmental roles, including HICC’s mandate on “strategies to increase housing supply near stations” and PSPC’s responsibility for the expropriation process. tc.canada.ca
    7.
    Ben Andrews, “‘Trepidation’ in neighbourhood next to Tremblay station after Alto officials throw cold water on downtown stop,” Ottawa Citizen, May 18, 2026. Source of the Eastway Gardens accounts (Coun. Marty Carr; residents on Avenues U and T), Coun. Stéphanie Plante’s account of Alto’s Tremblay rationale (“the lands are ready to go”), David Jeanes’ “significant intensification potential” observation, CEO Martin Imbleau’s “completely destroy the neighbourhood” remark (CFRA) and his Radio-Canada estimate of ~1,700 properties / ~500 farms across the ~200 km Ottawa–Montreal segment, and Transport Minister Steven MacKinnon’s “geotechnical challenges” comments. ottawacitizen.com
    8.
    Farmers Forum, reporting on the Bill C-15 acquisition powers as analysed by expropriation counsel (Davies Howe) — first right of refusal, prohibition-of-work orders, direct-to-expropriation, and ministerial rather than independent objection routing.
    9.
    ALTO HSR Citizen Research Initiative companion briefs: Reading the Answer (cost, ridership, subsidies) and The Report That Vanished (the parliamentary record and the documented marketing-led pivot). This brief is intended to be read alongside them.
  • Engineering complexity

    Reading the Complexity

    How hard is the ALTO corridor to build — and why the answer decides whether its cost forecast can be trusted?

    ◆ Engineering-Complexity Methodology

    Cost forecasts for major rail projects are usually defended by comparison: the proponent points to a built line elsewhere, cites its per-kilometre cost, and applies it here. The comparison only holds if the two corridors are genuinely alike in how demanding they are to build. Most of the time, that question is never asked explicitly.

    This brief sets out a way to ask it. A ten-dimension rubric scores the engineering complexity of any high-speed corridor on a common 100-point scale, so that a proposed project can be placed against a worldwide database of built and under-construction lines. The point is not to produce a single number, but to make the comparator-selection step — the step where cost forecasts quietly succeed or fail — auditable.

    Critical Finding

    Scored against the rubric, the ALTO corridor reaches a composite of 82 out of 100 — in the Extreme band (81–100), and the highest of fourteen corridors in the worldwide reference database, seven points above the next-highest (California HSR, 75). No corridor at a comparable score has finished construction. ALTO therefore sits outside the range for which directly comparable delivery precedent exists.

    This matters for one reason above all: under reference-class forecasting, a project without a dimensionally matched precedent cannot be reliably costed from international benchmarks. A forecast built by borrowing the per-kilometre cost of a European or East Asian line scoring in the 40s or 50s will systematically understate what an Extreme-band corridor should be expected to cost.

    Download — The Rubric
    CAPEX Note 1: Engineering Complexity Rubric v1.0 (PDF)
    The ten-dimension framework, the five-level descriptors, the weighting rationale, the two composite indices, and the illustrative application across thirteen reference corridors
    Download PDF
    Download — The Scorecard
    CAPEX Note 2: ALTO Engineering Complexity Scorecard (PDF)
    The rubric applied dimension-by-dimension to the proposed ALTO corridor, with evidence, exposure-adjusted analysis, reference-class comparison, and sensitivity scenarios
    Download PDF
    The Framework

    Ten dimensions, one hundred points

    The rubric scores a corridor on ten dimensions, grouped into four natural clusters: the ground and climate the corridor must cross (subgrade, bedrock, hydrology, climate); the geometry and hazard of the terrain (topographic relief, seismic and geohazard exposure); the environment and community it encounters (ecological footprint, heritage and Indigenous-rights constraints); and the corridor as a delivery and integration project (land acquisition, urban engineering content).

    Each dimension carries a weight reflecting its typical role in driving capital-cost dispersion across the reference class. Four cost-dominant dimensions — bedrock, climate, topography, and urban engineering — carry the maximum weight of 15 each. Subgrade and hydrology carry 10. The remaining four carry 5. The weights sum to 100, so the composite reads directly as a score out of 100. Each dimension is then scored on a granular scale up to its weight, against five descriptor levels: Minimal, Low, Moderate, High, and Extreme.

    20–60
    Low to Moderate — routine to standard HSR engineering
    most commissioned European and East Asian lines
    61–80
    High — multiple elevated dimensions; reference-class forecasting essential
    wide cost dispersion, overrun risk absent strong governance
    81–100
    Extreme — frontier engineering on several dimensions at once
    few or no directly comparable precedents

    The rubric reports two composites that answer different questions. The Peak Severity composite sums the granular scores, treating a dimension as fully present wherever its worst severity appears on the alignment — it characterises the engineering capability the corridor must provide at its most demanding locations. The Exposure-Adjusted composite scales each dimension by the fraction of corridor length at which that peak severity is actually present — it characterises the aggregate engineering burden spread across the whole route. Both are reported, because both bear on cost and schedule.

    Why this matters

    The rubric’s primary purpose is to discipline comparator selection. The standard failure mode in infrastructure forecasting, identified in the reference-class literature, is anchoring a forecast on favourable comparators while omitting the corridors whose complexity profile actually matches the proposed project. Explicit scoring against ten dimensions makes that selection step visible and checkable — only corridors with a similar dimensional profile are admitted to the reference class.

    The Application · ALTO

    The ALTO corridor scores 82 — Extreme

    Applied to the proposed ALTO corridor, the rubric returns a Peak Severity composite of 82 out of 100. The complexity is not attributable to any single factor; it arises from the simultaneous presence of multiple elevated dimensions across the ground, climate, environment, and land-acquisition clusters — the rubric’s definition of frontier engineering. Three dimensions reach their maximum, and two more sit at granular “High-plus” levels between the High and Extreme descriptors.

    ALTO Engineering Complexity Profile — Peak Severity, score / weight
    D1 Subgrade & soil — Leda clay
    10/10Extreme
    D2 Bedrock & excavation — Shield / karst
    13/15High+
    D3 Hydrology & hydrogeology — rivers / karst
    9/10High+
    D4 Climatic regime — continental cold
    13/15High+
    D5 Topographic relief & geometry
    10/15Moderate
    D6 Seismic & geohazard — clay / seismic
    4/5High
    D7 Ecological & protected-area footprint
    5/5Extreme
    D8 Heritage & Indigenous-rights
    4/5High
    D9 Corridor integration & land — greenfield
    5/5Extreme
    D10 Urban engineering content
    9/15Moderate
    Composite 82 / 100 — Extreme band (81–100). Three dimensions at maximum (subgrade, ecological, greenfield integration); two at High-plus (bedrock, climate). Bars show score as a fraction of each dimension’s weight.

    The two maximum scores that most distinguish ALTO are the subgrade dimension (10/10) and the greenfield land-acquisition dimension (5/5). The corridor traverses extensive Champlain Sea sensitive marine clay — Leda clay — across the Ottawa and St. Lawrence lowlands, a class named explicitly in the rubric’s top descriptor and associated with documented historical quick-clay failures. And the southern alignment is predominantly greenfield through actively farmed land, with property interests expected to number in the tens of thousands. The ecological dimension also scores at maximum: federally listed endangered species with designated critical habitat, a UNESCO biosphere reserve traversal, and significant wetland complexes.

    An interaction the score does not capture

    The composite treats dimensions as independent, but one coupling on ALTO deserves explicit attention: the interaction of maximum subgrade sensitivity (10/10) with elevated geohazard exposure (4/5). Ground-improvement works in sensitive clay can themselves destabilise marginally stable slopes — a failure mode with Canadian precedent. This is not reflected in any linear composite and should be treated as an explicit risk-register item, not a footnote.

    The Comparison

    Highest of fourteen corridors — and alone in the Extreme band

    Ranked against the worldwide database, ALTO occupies the top position by composite engineering complexity, and is the only corridor of the fourteen to fall in the Extreme band. The seven-point gap to California HSR crosses the High–Extreme boundary — a more substantive difference than the raw number suggests, because it marks the line beyond which directly comparable delivery precedent runs out.

    CorridorCompositeBand
    TGV Sud-Est, Paris–Lyon (1981)44Moderate
    Madrid–Sevilla AVE (1992)50Moderate
    Beijing–Shanghai HSR (2011)56Moderate
    HS1, London–Channel Tunnel (2007)61High
    HS2 Phase 1 (under construction)63High
    Tokaido Shinkansen (1964)66High
    Harbin–Dalian HSR (2012)68High
    California HSR (under construction)75High
    ALTO (proposed)82Extreme
    Selected corridors from the fourteen-corridor reference class. Full thirteen-corridor table in CAPEX Note 2.

    The comparison also shows why no single line is a clean match. California HSR’s complexity concentrates on seismic, topographic, and urban dimensions — factors well understood in California practice — but it does not face ALTO’s maximum subgrade and greenfield-integration scores. Harbin–Dalian is the nearest cold-climate reference, but it did not encounter sensitive marine clay. Ostlänken, in Sweden, is the closest analogue on ground conditions and climate, sharing the sensitive-clay and shield-bedrock profile — but not ALTO’s Extreme ecological footprint or the cold-climate severity of eastern Quebec. No reference corridor combines ALTO’s pattern of maximum subgrade, ecological, and greenfield-integration scores.

    A Fair Reading

    Concentrated, not uniform — the exposure-adjusted view

    The Peak Severity composite of 82 treats a dimension as fully present wherever its worst severity appears. But ALTO’s complexity is not uniformly distributed: Leda clay occupies a majority of the corridor, while the hard-rock Frontenac Arch crossing is concentrated in roughly 40 km and urban engineering is confined to four metropolitan termini. The Exposure-Adjusted composite, which scales each dimension by the share of corridor length at which its peak severity is present, comes to 73 out of 100 — in the upper High band, nine points below the Peak Severity figure.

    The gap between the two indices is itself the finding: it quantifies how much of ALTO’s complexity is concentrated rather than spread along the whole route. The dimensions with the largest downward adjustment — bedrock, urban engineering, and ecological — are real, significant engineering burdens, but ones concentrated in specific segments. Reported honestly, both numbers belong in any cost forecast: Peak Severity drives the design-capability case for independent peer review; Exposure-Adjusted informs the corridor-scale cost envelope.

    The 82 is also presented as a conservative baseline, not a worst case. The scoring follows a stated conservatism principle — where evidence straddles two levels, the lower score is taken unless the higher is documentably met. Six dimensions are identified where fuller review could justify an upgrade; if all six conditions were met, the composite would rise to 92. The defensible range is therefore 82–92 — all of it within the Extreme band.

    The Alternative

    Where the High Performance Rail alternative changes the score

    The complexity score is not a fixed property of the route — it is a property of this design choice for the route. The High Performance Rail (HPR) alternative is structured to avoid the most consequential maximum-score dimensions by design, and a parallel scoring of HPR against the same rubric is recommended as a companion exercise. Preliminary assessment places it in the Moderate-to-High transition, a range for which the database provides abundant delivery precedent.

    Land acquisition (D9): 5/5 → toward 2/5

    Greenfield land acquisition — ALTO’s maximum-score dimension — is substantially replaced by upgraded use of shared existing corridors, removing the tens-of-thousands-of-property-interests problem that places ALTO at the Extreme archetype.

    Subgrade & ecology (D1, D7): materially mitigated

    Following existing corridors means the sensitive-clay and critical-habitat crossings have, in large part, already been engineered or disclosed — rather than encountered fresh along a new greenfield alignment.

    Urban engineering (D10): unchanged

    HPR uses the same existing urban rail corridors into the same metropolitan termini, so urban engineering content stays at or below its current score — a useful reminder that the alternative is not a free lunch on every dimension.

    The Honest Answer

    What does an Extreme score oblige?

    The rubric is explicit on this point, and it is not a matter of opinion: an Extreme-band project requires independent peer review and reference-class forecasting as mandatory, not discretionary. These are the mechanisms by which a frontier-engineering project is costed responsibly. They are not discharged by a public consultation, nor by a standard environmental assessment.

    The primary governance finding of the scoring exercise is the absence of those mechanisms from the current procurement trajectory. That is not, in itself, a verdict that the corridor should not be built. It is a statement that the cost number attached to it cannot yet be relied upon — because the discipline that would make an Extreme-band forecast trustworthy has not been applied to it.

    This is the same shape of argument the Initiative’s financial work makes elsewhere: the question is rarely whether a number is high or low, but whether the method behind it can be audited. A reader who knows the corridor scores in the Extreme band can ask, of any cost forecast presented for it, which comparators were used — and whether they were dimensionally matched, or merely favourable.

    For the Next Cost Estimate

    Three questions to ask of any HSR cost forecast

    Each follows directly from the rubric. None presupposes opposition to any project. Each is the kind of question the method requires to be answered before a cost figure can be trusted.

    1. Which comparators were used — and what do they score?

    A forecast anchored on lines scoring in the 40s or 50s is borrowing the cost of a fundamentally less demanding corridor. Ask for the complexity score of each comparator, and whether any of them is dimensionally matched to the proposed corridor rather than simply convenient.

    2. Has independent peer review and reference-class forecasting been done?

    For an Extreme-band corridor these are mandatory, not optional. If they have not been performed, the cost estimate is provisional by definition, however precise the headline figure looks.

    3. Have the interaction effects been costed, not just the dimensions?

    The composite treats dimensions as independent; real corridors do not behave that way. For ALTO specifically, the subgrade–geohazard coupling — remediation works in sensitive clay potentially triggering slope failures — belongs on the risk register as an explicit line item.

    None of these questions presupposes a view about whether the corridor should be built. Each is the kind of question a reasonable reader would ask before forming one — and each is a question the published cost materials have so far not been pressed to answer in the terms the method requires.

    Sources

    The two notes and their evidence base

    This brief synthesises the two engineering-complexity notes produced by the Initiative. Both are available in full below, with the complete descriptors, weighting rationale, dimension-by-dimension evidence, exposure analysis, and sensitivity scenarios summarised here.

    1.ALTO HSR Citizen Research Initiative, CAPEX Note 1: Engineering Complexity Rubric v1.0, April 2026 — the ten-dimension framework, five-level descriptors, weighting rationale, the Peak Severity and Exposure-Adjusted indices, and the illustrative application across thirteen reference corridors.
    2.ALTO HSR Citizen Research Initiative, CAPEX Note 2: ALTO Engineering Complexity Scorecard, April 2026 — the rubric applied to the ALTO corridor, with dimension-by-dimension evidence, exposure-adjusted analysis, reference-class comparison, and the 82–92 sensitivity range.
    3.Reference-class forecasting method — Flyvbjerg and colleagues on demand- and cost-forecast accuracy in transport megaprojects, and the reference-class forecasting procedure for disciplining comparator selection.
    4.Primary evidence datasets — Ontario Geological Survey and Geological Survey of Canada (geology); Natural Resources Canada 2020 seismic hazard model (seismic); Species at Risk Public Registry (species); UNESCO MAB and Ontario Parks (protected areas), as cited per dimension in CAPEX Note 2.
    5.ALTO HSR Citizen Research Initiative, Reading the Footnote (Cost Estimation Brief), May 2026 — the companion brief on the AACE Class 5 classification and what it implies for the $60–90 billion figure.
    6.ALTO HSR Citizen Research Initiative, The Cost of Running the Train (Operating-Cost Brief), May 2026 — the recurring-cost companion to this capital-cost analysis.
  • Cost of running the train

    The Cost of Running the Train

    What it costs to run a high-speed corridor every year — and the ridership it would take to pay for it.

    ◆ Operating-Cost Methodology

    The debate over a high-speed corridor usually fixes on the construction price tag. But a corridor that is built still has to be run — maintained, staffed, energised, and periodically re-equipped — for as long as it operates. That recurring cost is a separate question from the capital cost, and it is answered by a separate methodology.

    This brief sets out that methodology in three parts: the cost of keeping the fixed assets in service, the cost of running trains on them, and the cost of replacing the trains when they wear out. It then asks the single question those three costs raise together: how many passengers would the corridor need to carry to cover them?

    Critical Finding

    For a 1,000 km dedicated high-speed corridor under Canadian operating conditions, the three recurring cost streams sum to approximately $2.15 billion per year at baseline service. To cover that from fare revenue at the modelled fare and load factor, the corridor would need to carry approximately 12.5 million passengers per year. At the modelled baseline service level, fare revenue recovers only 80 per cent of recurring cost — a $439 million annual deficit, incurred before a single dollar of construction debt is serviced.

    This brief builds each of the three cost streams from international benchmarks, stacks them, and derives the break-even ridership. The point is not a verdict on the project. It is to give the reader a structure for testing any published operating-cost or ridership claim against the arithmetic that governs it.

    The Structure

    Three cost streams, three different shapes

    Recurring lifecycle cost is not one number. It is three streams with fundamentally different drivers, and they respond to traffic in opposite ways. Modelling them as a single line item — the common “O&M” or “lifecycle cost” figure — hides the structure that decides whether cost recovery is achievable at all.

    Stream 1 · Maintenance
    Keeping the assets in service
    $1.27B
    per year, MID
    Track, signalling, electrification, structures, stations — inspected, maintained, and periodically renewed. Driven by the existence of the assets, not the traffic on them. 77 per cent fixed.
    Stream 2 · Operations
    Running the trains
    $700M
    per year, MID
    Crew, energy, rolling-stock servicing, station staffing, dispatching, commercial and overhead. Driven by the act of running trains. 69 per cent variable.
    Stream 3 · Fleet capital
    Replacing the trains
    $180M
    per year, MID
    Trainsets wear out after 25–35 years and must be replaced. The acquisition cost is not one-time — it is the first cycle of a periodic recapitalisation, annuitised here for comparability.

    The first two streams have opposite sensitivity to traffic. Maintenance is dominated by the cost of having the assets there at all: patrol, inspection, and age-based renewal continue whether eighty trains run or two hundred. Operations is dominated by the cost of activity: more trains mean more crew-hours, more energy, more servicing. The third stream, fleet capital, is set by the size of the fleet needed to deliver peak service — it does not scale with utilisation at all.

    This opposite-shape structure is why a single bundled cost figure cannot be audited. A reader given only a total cannot tell how much of it is fixed — and the fixed share is precisely what determines how the cost behaves as ridership changes.

    Stream 01 · Infrastructure Maintenance

    The cost of keeping the assets in service

    Infrastructure maintenance has two parts that must be modelled separately. Routine maintenance is annual recurring spend on inspection and preventive and corrective work. Renewal is the periodic capital replacement of long-life components — rail, ballast, contact wire, signalling electronics — annuitised over each asset’s useful life. Conflating the two is the most common business-case error in long-life infrastructure analysis; omitting the renewal annuity understates real lifecycle cost by 40 to 60 per cent.

    $1.27B
    annual maintenance + renewal at the MID central scenario
    $1.08B–$1.52B LOW–HIGH envelope
    77%
    of the maintenance line is fixed — independent of traffic
    a floor of ~$980M/yr that no ridership reduces
    3–10×
    ALTO’s per-train-km infrastructure cost vs mature European peers
    $37–$77/train-km across 40–100 trains/day

    Applied to the worked example — a 1,000 km dedicated double-track corridor at 300 km/h, under an Eastern Canadian climate-and-terrain uplift of 1.375 — the maintenance-plus-renewal total is approximately $1.27 billion per year, or $1.27 million per route-kilometre. Stripping the Canadian uplift leaves an underlying figure of about $920k per route-km, which sits at the top end of the European HSR range — the appropriate position given Canadian labour rates and the absence of a domestic HSR supply chain.

    The structurally important fact is the fixed-cost floor. About $980 million of the annual total is incurred regardless of how many trains run. No ridership scenario reduces it. This is the single most important number for the alternative-framework comparison: a corridor that already exists and is already being maintained for other traffic does not add a fresh fixed-cost floor of this size merely because passenger services are layered onto it.

    Download Note 1
    O&M Note 1: Infrastructure Maintenance Costs for HSR (PDF)
    Cost structure, calculation formula, full asset inventory, Canadian adjustment factors, sensitivity envelope, and the seven-question diagnostic framework — 11 pages
    Download PDF
    Stream 02 · Operations

    The cost of running the trains

    Operating cost decomposes into eight categories. Three — traincrew, traction energy, and rolling-stock light and intermediate servicing — scale directly with train-kilometres. Three — station operations, network control, and insurance — are largely fixed. One (commercial) scales with revenue, and one (general and administrative overhead) is applied as a markup on direct costs. Where infrastructure is dominated by the existence of assets, operations is dominated by the act of running trains.

    $700M
    annual operating cost at the MID baseline service level
    $24 per train-km at 80 trains/day
    69%
    of operating cost is variable — it scales with traffic
    the mirror image of the maintenance line
    51%
    of operating cost sits in just three categories
    crew, rolling-stock servicing, station operations

    At the baseline 80 trains per day, total operating cost is approximately $700 million per year, or $24 per train-km after an Ontario-grid climate uplift. Three categories — traincrew, rolling-stock servicing, and station operations — account for just over half the total. Any cost-reduction strategy that does not touch those three addresses only half of operating cost.

    Two findings cut against common assumptions. Energy is small: traction power is only about 6 per cent of operating cost, so grid decarbonisation or efficiency gains will not materially move the operating line — the environmental argument for high-speed rail rests on modal shift and embodied emissions, not on operating-energy savings. And stations are the largest fixed line: at roughly $18 million per staffed station per year, each additional intermediate stop adds about that much to the fixed-cost floor regardless of how many trains call there. Station-count decisions are not cost-free.

    The alternative-framework comparison matters less here than it does for maintenance. Operating cost per train-km is largely independent of whether the corridor is dedicated high-speed track or shared with other services — so the structural cost advantage of the High Performance Rail (HPR) framework lives in the infrastructure line, not the operations line.

    Download Note 2
    O&M Note 2: Operating Costs for HSR (PDF)
    The eight cost categories, unit-cost parameters, fixed/variable decomposition, frequency sensitivity, and the operating-cost diagnostic framework — 9 pages
    Download PDF
    Stream 03 + Combination · Cost Recovery

    Stacking the three — and the break-even it implies

    The third stream is the fleet itself. Trainsets retire after 25 to 35 years; the acquisition cost is therefore the first cycle of a recurring recapitalisation. For a 30-trainset fleet at roughly $70 million per set — about $2.1 billion of fleet capital — annuitised over a conservative 25-year life at the Treasury Board reference discount rate, the annual fleet-replacement annuity is approximately $180 million per year. Whether the assumed life is 25 or 35 years moves this by only about 10 per cent; what matters is that the cost exists at all, not the exact horizon.

    Summing the three streams at the MID baseline gives the full recurring picture:

    Combined recurring cost — 1,000 km corridor, 80 trains/day, MID
    M · $1.27B
    O · $700M
    F · $180M
    Maintenance & renewal — $1.27B (59%) Operations — $700M (33%) Fleet capital — $180M (8%)
    Total recurring lifecycle cost ≈ $2.15 billion per year · 40-year present value ≈ $28.6 billion

    Collected into a single function of service frequency, combined cost is approximately $1.38 billion in fixed cost plus $9.6 million per train-per-day. Revenue rises along a different line, set by fare yield, seats, load factor, and corridor length. Whether the two lines cross — and at what passenger volume — is the cost-recovery question.

    Break-Even Condition
    Annual fare revenue=Maintenance+Operations+Fleet capital
    ridership × fare=$1.27B+$700M+$180M

    At the modelled fare yield of $0.20 per passenger-kilometre and a 65 per cent load factor, the lines cross at approximately 12.5 million full-corridor passenger trips per year. Below that ridership, the corridor cannot cover its recurring cost from fares — before any allowance for construction debt.

    Service / metric (MID)Value
    Total combined recurring cost (M + O + F)$2,147M / yr
    Fare revenue at 80 trains/day ($0.20/pkm, 65% LF)$1,708M / yr
    Annual deficit at baseline service−$439M / yr
    Cost recovery ratio at baseline0.80
    Break-even ridership12.5M pax / yr
    At baseline service, fare revenue recovers 80 per cent of recurring cost. The $439M deficit is incurred before any construction debt service or return on capital.

    Including fleet replacement raises the break-even by about 15 per cent — from 10.9 million pax/yr on an operations-and-maintenance-only basis to 12.5 million once the trains themselves are paid for. The effect is mechanical: every dollar added to the fixed-cost floor needs roughly 8.5 cents of additional annual contribution to recover.

    Download Note 3
    O&M Note 3: Combined Cost Recovery for ALTO HSR (PDF)
    Fleet-capital methodology, the combined three-stream model, break-even derivation, the yield × load-factor sensitivity matrix, and the cost-recovery diagnostic framework — 16 pages
    Download PDF
    How Fragile Is the Break-Even?

    It moves sharply with fare and load factor

    The 12.5-million figure is not a constant. It depends heavily on two assumptions a business case can set at will unless they are disclosed and benchmarked: the average fare yield, and the average load factor. A modest reduction in either pushes the required ridership up steeply.

    Fare yield ($/pax-km)LF 55%LF 65%LF 75%
    $0.1531.422.919.1
    $0.1818.715.313.5
    $0.20 (MID baseline)14.712.511.3
    $0.2311.19.89.1
    $0.269.08.17.6
    Break-even ridership in millions of full-corridor passenger trips per year. MID baseline ($0.20 yield, 65% LF) highlighted at 12.5M.

    A 25 per cent cut in yield — from $0.20 to $0.15 per passenger-kilometre — nearly doubles the break-even ridership at baseline load factor, from 12.5 to 22.9 million. This matters because $0.20 per passenger-kilometre is already above the European average: SNCF’s TGV and Trenitalia’s Frecciarossa run nearer €0.14 with higher load factors on long-haul routes. A Canadian assumption above the European benchmark requires explicit justification from route economics, demographics, and competing-mode pricing — it cannot simply be asserted.

    Why this matters

    The international record on rail demand forecasts is not encouraging: across a large sample of projects, nine in ten rail forecasts overestimated ridership, with an average overestimation around 100 per cent in the first decade. A break-even at 12.5 million leaves little margin to absorb that kind of forecasting error — and the margin shrinks further at any fare below the modelled $0.20.

    The Honest Answer

    Can the corridor pay to run itself?

    At the modelled baseline, no — not from fares alone. The corridor would need to carry roughly 12.5 million passengers a year to cover its recurring cost, and at the baseline service level it recovers only 80 per cent, running a $439 million annual deficit. And this is the easy half of the cost question. Break-even here is computed on recurring lifecycle cost only.

    The construction cost has not entered yet. At the proponent’s own $60–90 billion estimate, construction debt service alone would add on the order of $2.5 to $5 billion per year — several times the entire operating-and-maintenance surplus available at any plausible service level. The recurring cost recovers, at best, the cost of running the corridor; it does not begin to recover the cost of building it.

    This is not, in itself, an argument against the project. Most large rail systems in the world close their gaps through public subsidy and have done so for over a century. The question the methodology forces is narrower and more answerable: is the recurring cost being disclosed honestly, separated into its three streams, with the fare and load-factor assumptions stated and benchmarked — so that a reader can check whether the ridership forecast clears the break-even the arithmetic requires?

    A reader who knows the cost has three streams, knows the fixed-cost floor cannot be reduced by running more trains, and knows where the break-even sits can ask, at every turn, what the missing terms are. That is what this brief is for.

    For the Next Federal Statement

    Three questions to ask of any operating-cost claim

    Each follows directly from the methodology. None presupposes opposition to any project. Each is the kind of question the arithmetic requires to be answered before a reader can form a judgment.

    1. Are the three streams disclosed separately?

    Maintenance, operations, and fleet capital have different drivers and opposite sensitivities to traffic. A single bundled “O&M” or “lifecycle cost” figure cannot be audited. In particular: is rolling-stock replacement amortised into the recurring line, or quietly treated as one-time acquisition capital? Omitting it understates recurring cost by around 10 per cent.

    2. What fare yield and load factor are assumed?

    Both must be stated and benchmarked. A yield above $0.20 per passenger-kilometre sits above the European average and requires demographic, competitive, and route-specific justification. Without these two numbers, a ridership figure cannot be tested against break-even at all.

    3. What is the cost-recovery ratio at the central ridership forecast?

    Below 1.0, recurring cost cannot be self-funded from fares. Between 1.0 and 1.2 is a thin margin highly exposed to the normal range of forecasting error. And whatever surplus exists above break-even is the only resource available to service construction debt — which is the far larger number.

    None of these questions presupposes a view about whether the corridor should be built. Each is the kind of question a reasonable reader would ask before forming one — and each is a question the published materials have so far not been pressed to answer in the terms the arithmetic requires.

    Sources

    The three notes and their evidence base

    This brief synthesises the three operating-cost research notes produced by the Initiative. Each is available in full below, with the complete derivations, parameter tables, sensitivity analyses, and diagnostic checklists summarised here.

    1.ALTO HSR Citizen Research Initiative, O&M Note 1: Infrastructure Maintenance Costs for HSR, May 2026 — cost structure, calculation formula, asset inventory, Canadian adjustment factors, frequency sensitivity, diagnostic framework.
    2.ALTO HSR Citizen Research Initiative, O&M Note 2: Operating Costs for HSR, May 2026 — the eight operating-cost categories, unit-cost parameters, fixed/variable decomposition, operations-versus-infrastructure elasticities.
    3.ALTO HSR Citizen Research Initiative, O&M Note 3: Combined Cost Recovery for ALTO HSR, May 2026 — fleet-capital methodology, the combined three-stream model, break-even derivation, yield × load-factor sensitivity matrix.
    4.Primary cost benchmarks — California High-Speed Rail Authority, 2024 Business Plan O&M and lifecycle cost models; SNCF Réseau and SNCF Voyageurs annual financial reports; Renfe / ADIF Alta Velocidad annual accounts; UIC Lasting Infrastructure Cost Benchmarking; Federal Railroad Administration HSIPR Best Practices.
    5.Methodology and discount rates — Treasury Board of Canada Secretariat, Canada’s Cost-Benefit Analysis Guide; EU Directive 2012/34/EU and Implementing Regulation 2015/909; CATRIN Deliverable D8; IRG-Rail direct-cost reports.
    6.Demand-forecasting accuracy — Flyvbjerg, Skamris Holm and Buhl, “How (In)accurate Are Demand Forecasts in Public Works Projects?” Journal of the American Planning Association 71, no. 2 (2005); and related reference-class forecasting literature.
    7.ALTO HSR Citizen Research Initiative, Reading the Answer and Reading the Footnote, May 2026 — companion briefs reading the Q-923 cost and ridership claims, and the cost-estimate classification, against the academic record.
  • Reading Lovegrove

    Reading Lovegrove

    What the UK Cabinet Office’s review of the HS2 Civil Service failures tells us about ALTO.

    ⚠ New UK Cabinet Office Review Published

    In May 2026 the UK Cabinet Office published a review by Sir Stephen Lovegrove — former National Security Adviser and former Permanent Secretary of the Ministry of Defence — into how the British Civil Service failed to identify and act on the deterioration of HS2 before its costs reached £82.2 billion for the London–Birmingham section alone. The review is short, unusually candid, and addresses the institutional architecture Canada is now using to deliver ALTO. gov.uk

    The Lovegrove Review is not about why HS2 went wrong as an engineering project. Its purpose is to explain how a senior G7 civil service, with all the oversight tools a Westminster-system government has, failed to see the disaster coming. That makes it directly relevant to the question Canadians need to ask about ALTO.

    Critical Finding

    The Lovegrove Review documents a four-fold real-terms increase in HS2 Phase 1 costs between 2012 and 2026 — from £20.5 billion to £82.2 billion in constant 2019 prices — on a 225-kilometre stretch of railway. A directly parallel Canadian cost-escalation trajectory has already occurred on the corridor ALTO now proposes to serve: from under C$5 billion for the abandoned High Frequency Rail option in 2016 to C$80–120 billion for ALTO as confirmed in February 2025, a sixteen-to-twenty-four-fold increase within a decade.

    Three Lovegrove findings translate directly to ALTO. First, the corporate form of an arm’s-length delivery body funded entirely from the public purse — HS2 Ltd in the UK, ALTO HSR Inc. in Canada — is, in Lovegrove’s words, “fundamentally ill-suited to this type of arrangement” because the commercial disciplines the corporate form is supposed to deliver do not flow from grant-in-aid funding alone. Second, HS2 Ltd’s board and executive developed a “fortress mentality,” becoming cheerleaders for high-speed rail rather than rigorous delivery managers — a pattern the CRI has been documenting in ALTO’s recent public outputs. Third, and most directly applicable: external reviews must not substitute for official advice on alternative ways of delivering a project before a Final Investment Decision.

    The Lovegrove Review also contains an unusually explicit vindication of dissenting analysis. Lord Berkeley’s January 2020 dissent from the Oakervee panel was dismissed at the time as methodologically unsound. Six years later, the Cabinet Office writes that the thrust of his judgements has proved correct and his estimates closer to today’s outturn than those on which ministers gave the go-ahead. This is the most authoritative G7 government statement to date on the credibility of structured citizen reference-class analysis in high-speed rail governance.

    Download
    Reading Lovegrove — Full Brief (PDF)
    Detailed analysis of the Lovegrove Review’s findings and their direct application to ALTO’s current trajectory
    Download PDF
    A Published Reference Class

    The cost trajectory the UK Cabinet Office published this month

    The single most useful artefact in the Lovegrove Review is its published trajectory of HS2 Phase 1 cost estimates over time, all expressed in a 2019 price base for comparability. Phase 1 is the London to West Midlands section of approximately 225 km — the only section now being constructed, after the cancellation of Phase 2 north of Birmingham.

    YearPhase 1 cost estimate (£bn, 2019 prices)
    201220.5
    201326.8
    202044.6
    202354
    202466
    202682.2

    In 2019 prices, the 2026 estimate is more than four times the 2012 estimate for the same 225 km of railway. The increase from 2024 to 2026 alone — two years — is larger than the entire original 2012 budget. This is not a critic’s estimate. It is not an academic reconstruction. It is the British government, today, publishing the official trajectory of its own project’s cost.

    For ALTO, the importance of this trajectory is twofold. The comparator is not ancient: HS2 Phase 1 was at roughly the same stage of pre-construction maturity in 2012–2015 that ALTO is at now. And the trajectory is now an official UK government data point — not contested or speculative — which removes one of the standard rhetorical defences used in ALTO’s framing.

    The Canadian Parallel

    The same trajectory has already occurred on the Toronto–Quebec City corridor

    In 2016 the federal government funded a serious study of High Frequency Rail (HFR) for the Toronto–Quebec City corridor: 170–177 km/h conventional rail on largely dedicated tracks, costed at under C$5 billion in 2016 dollars, or under C$10 billion adjusted for construction inflation to 2024. A December 2021 Joint Project Office Business Case prepared by VIA Rail Canada and the Canada Infrastructure Bank confirmed the preferred option. tc.canada.ca

    In March 2022 the federal government issued a Request for Expressions of Interest that pivoted the procurement to a Design-Build-Finance-Operate-Maintain (DBFOM) structure and explicitly invited proposals for speeds above 200 km/h. In February 2025, without publishing a side-by-side comparison of the HFR and high-speed options, the government confirmed the project would become ALTO at 300 km/h+, costed at C$80–120 billion. Passengers will not board until the 2040s.

    ~5×
    HS2 Phase 1 real-terms increase, 2012–2026 (UK)
    Lovegrove Review, May 2026
    16–24×
    HFR to ALTO escalation, 2016–2025 (Canada)
    CRI From HFR to ALTO, March 2026
    $0
    published side-by-side comparison of HFR vs ALTO
    As of May 2026

    The escalation from HFR’s published baseline to ALTO’s announced range is of the same order of magnitude as, and on a comparable timescale to, the four-fold real-terms increase Lovegrove documents for HS2 Phase 1. The HS2 cost-trajectory table above is not a foreign curiosity. It is the comparator for a transformation that has already occurred on the project Canada is now committing to deliver.

    The “Original Sins”

    Lovegrove’s consensus diagnosis — and its ALTO analogues

    Lovegrove summarises the consensus diagnosis of why HS2 cost forecasts proved so wrong. The list is short and direct: original gold-plating of the high-speed concept; a decision to begin construction at the hardest points of the route; changing objectives and political priorities; award of the Main Works Civils Contracts at insufficient design maturity and on terms which did not manage risk; and costs and risks badly underestimated.

    The pursuit of 300 km/h electrified high-speed running across a route with the geological and ecological profile of the proposed southern corridor is itself a gold-plating decision. Reference-class analysis shows that the marginal capital cost of moving from a conventional or near-conventional dedicated passenger railway to a fully grade-separated electrified high-speed alignment is the dominant driver of total programme cost — and is the primary mechanical reason the HFR-to-ALTO transformation generated the cost escalation set out above. An alternative configuration — a lower design speed in the order of 200 km/h, on a route making use of the 401 corridor rather than a new southern alignment across Eastern Ontario — would shift the project into a different cost class and a different environmental and community-impact profile. Whether such a configuration is preferable, on a full set of criteria, is precisely the comparative question the Lovegrove framework says government should answer before a Final Investment Decision.

    The HS2 phasing parallel is not exact: ALTO plans to begin with the Ottawa-to-Montréal segment, which involves real engineering complexity including Leda clay deposits and the Ottawa River crossing, but is not the hardest section of the proposed corridor. The more challenging geological and ecological terrain remains to be worked through downstream of any Notice-to-Proceed-equivalent decision. The category of risk Lovegrove identifies nonetheless applies: committing to a DBFOM contractual architecture spanning the full corridor before the hardest sections have been designed in detail locks in contractual obligations under the same design-immaturity conditions HS2 entered when it awarded its Main Works Civils Contracts. The HS2 mistake was not solely the geographical choice to start in the Chilterns; it was the contractual choice to commit before maturity, and that part of the parallel remains direct.

    Sir Jon Thompson, the Executive Chair of HS2 Ltd, set out the resulting contractual problem directly in evidence to the House of Commons Transport Committee on 10 January 2024. parliament.uk He told the Committee that the Government and the company had decided to let cost-plus contracts under which 99% of the financial risk sat with the Government and only 1% with the contractor, describing the arrangement as extraordinary. Under a fixed-percentage fee, he noted, a contractor who runs over budget receives the same percentage of a much larger number, which effectively incentivises overspending rather than restraining it.

    The risk allocation under the ALTO co-development contract with the Cadence consortium has not been publicly disclosed. Whether it replicates, mitigates, or improves on the HS2 risk allocation cannot be assessed from public information. Under Lovegrove’s framework, that absence of disclosure is itself the relevant problem: the contractual terms that drive cost outcomes over the lifetime of a project are exactly the terms that the sponsor department, Parliament, and the Auditor General require visibility into before, not after, commitment.

    The Crown Corporation Problem

    Lovegrove’s structural critique of the delivery vehicle

    Lovegrove’s most pointed structural critique is of HS2 Ltd’s status as a Company Limited by Guarantee with government as sole guarantor. The Review concludes that this construct was institutionally incoherent. The arguments traditionally offered for it — independence from government, ability to hire at market rates, commercial discipline, decision-making at commercial speed — are real benefits, but they only work when the entity has genuine third-party shareholders with capital at risk.

    “Company structures are arguably fundamentally ill-suited to this type of arrangement.”

    — Lovegrove Review, May 2026

    HS2 Ltd received 100% of its funding from government grant-in-aid. There were no third-party shareholders, no commercial counterparties with capital at risk, no governance mechanisms forcing cost-benefit discipline from below. The advantages of the company form were thus retained only in name. What HS2 Ltd actually got was the freedom to hire at private-sector rates and to operate at arm’s length from ministers, without the corresponding discipline of having investors who would have insisted on cost control.

    ALTO HSR Inc. is in a structurally comparable position to HS2 Ltd at the corporate level. It is a federal Crown corporation, 100% publicly funded, with no third-party shareholders in the corporation itself. The contractual relationship with the Cadence consortium under the DBFOM arrangement is not publicly disclosed in sufficient detail to assess how risk, financing, and return are allocated between the parties or over what time horizon. What can be observed from the public record is the corporate-form question: a Crown corporation receiving 100% of its funding from the federal purse, used to obtain independence from political cycles and freedom to hire specialist talent, is in the same structural category as HS2 Ltd — the category Lovegrove diagnoses as institutionally incoherent because the disciplines that normally accompany the corporate form do not flow from grant-in-aid funding alone.

    The “Fortress Mentality”

    A cultural pathology, and a downstream information failure

    Beyond structure, Lovegrove identifies a cultural pathology that should be familiar to anyone tracking ALTO’s public communications. The Review records that HS2 Ltd’s board, and particularly its executive management and chair, developed what interviewees described as a fortress mentality — becoming cheerleaders not only for HS2 but for the cause of high-speed rail in the UK more generally, framing the project as ushering in a new era. The Review is unambiguous that this conception of the company’s role was misguided. Transport policy is for ministers; the company’s job is delivery within scope and budget.

    “The Board, and especially the executive management and Chair, had adopted a ‘fortress mentality’ and had become ‘cheerleaders’, not merely for HS2 but for the cause of high-speed rail in the UK more generally.”

    — Lovegrove Review, May 2026

    This cultural finding matters because it generated a downstream information failure. Lovegrove quotes board members and reviewers describing the management information packs given to the HS2 Ltd board as forming a veil behind which less good news became difficult to assess or even identify, with the same problem persisting unaddressed years later — packs remaining unwieldy, format-inconsistent, and lacking prioritisation. Because the same data flowed through to government, the sponsor department was working from the same compromised information.

    The CRI’s post-consultation work has documented precisely this pattern in ALTO’s public outputs. The disclosures in Q-923 on cost, ridership, and the self-sustaining claim use confidence framings that do not survive parametric stress-testing against McGill TRAM and Munk School sources. The marketing pivot identified through the Cossette ATI disclosures, and the unanswered status of TRAN Report 18 — published by the House of Commons Standing Committee on Transport, Infrastructure and Communities and left without a government response when Parliament was prorogued — are the documentary symptoms of an executive culture that has begun to treat advocacy as primary and delivery information as secondary. Lovegrove’s framework gives that observation a name and an authoritative diagnostic basis.

    The candour of Sir Jon Thompson’s evidence to the Transport Committee on 10 January 2024 is worth pausing on, because it confirms the Lovegrove diagnosis from inside the institution. Thompson — himself a former Permanent Secretary at HM Revenue and Customs and at the Ministry of Defence, and a double-qualified accountant — told the Committee that when he joined the HS2 board in 2021 he was struck by the lack of data and scrutiny of programme finances; that the management information presented to the board was not robust enough to assess whether main civils contractors were meeting productivity targets; and that significant improvement only arrived in October 2023, two and a half years later. He described it as a shocking thing to say, but acknowledged that the quality of board-level management information had not been good enough. That is the senior executive of a major UK arm’s-length delivery body, on the parliamentary record, confirming the exact information failure the Lovegrove Review now documents externally.

    The Notice-to-Proceed Moment

    When external reviews substitute for official advice

    The Lovegrove Review devotes substantial attention to the Notice to Proceed decision in early 2020, when government formally committed to construction of HS2 Phase 1. The sequence is instructive. The Oakervee Review, an independent panel chaired by a former HS2 Ltd chair, recommended proceeding with the full route. Its report was published shortly after a Prime Minister–Chancellor–Secretary of State trilateral meeting had already reached the same conclusion. The formal Notice to Proceed was confirmed in March 2020.

    Lovegrove’s criticism is not that the Oakervee Review was conducted in bad faith. It is that the official advice provided to ministers alongside the Oakervee report did not address alternative ways of delivering the project — as distinct from alternative projects — including options which would have led to a delay in construction while alternative designs, options, or contractual arrangements were sought. The external review effectively substituted for official advice on strategic choice.

    “Reviews by external actors (including this one) have their place in informing policy formulation, but they should not substitute for official advice.”

    — Lovegrove Review, Recommendation 14

    This is the recommendation with the most direct bearing on where ALTO now sits. The work being produced by Cadence under its co-development contract, the public outputs of ALTO HSR Inc., and the materials prepared for the parliamentary process are all in danger of functioning as external review substituting for official advice on alternatives. The category of alternative Lovegrove insists should not be foreclosed before a Final Investment Decision — different speed classes, different route alignments, different contractual structures, different phasing — is exactly the category that has not been comparatively analysed for ALTO. A lower design speed in the order of 200 km/h, and a route making use of the 401 corridor rather than a new southern alignment, are concrete examples of the alternatives that would normally be costed and compared at this stage. They have not been.

    The CRI’s March 2026 brief From HFR to ALTO already constitutes the kind of structured comparison Lovegrove says government itself should produce. It identifies eight pivotal changes that occurred between the December 2021 HFR Business Case and the February 2025 confirmation of ALTO as a high-speed system, and documents the absence of a published side-by-side cost-benefit comparison between the two options. The point under Lovegrove’s framework is not that citizen research is a substitute for official advice. It is that when an arm’s-length delivery body and the sponsor department do not produce that comparison themselves, and the government nonetheless proceeds, the conditions Lovegrove identifies as the proximate cause of the HS2 failure are present.

    Vindication of the Dissenting Voice

    The lone dissenter the Cabinet Office now says was right

    One paragraph of the Lovegrove Review deserves to be read by every parliamentarian considering ALTO. When the British government was deciding whether to proceed with HS2 in 2020, it commissioned an independent panel chaired by a former HS2 chair, Douglas Oakervee. The panel recommended proceeding with the full project. One member dissented — Lord Berkeley, a peer and former rail executive. His dissenting report cast doubt on the costings, the schedule, and the capability of HS2 Ltd to manage the project. He was dismissed at the time as methodologically unsound. His report was excluded from the panel’s formal conclusions.

    “There is no escaping the fact that the thrust of his judgements, in particular about the capability of the Company to manage the project, have proved to be correct, and his estimates much closer to today’s outturn than those upon which ministers ultimately gave the go-ahead.”

    — Lovegrove Review, May 2026

    That is the UK Cabinet Office, six years later, on the public record, telling Parliament that the man it ignored was right. His estimates were closer to reality than the ones ministers used to make the final decision. The institutional process designed to test his concerns failed.

    This matters for Canada because it is the most authoritative statement any G7 government has ever made about the value of structured outside-the-tent analysis on a major infrastructure project. It does not validate every dissenting analysis automatically — Lovegrove notes that some of Berkeley’s specific methodological steps were questionable and that some of the cost increases arose from factors Berkeley did not identify — but it establishes that the dismissal of dissenting reference-class work as inherently less credible than insider forecasts has now been formally repudiated by one G7 government.

    Corporate Overlap

    Two Cadence members were inside HS2

    Two of the six members of the Cadence consortium selected by Canada to design, build, finance, operate and maintain ALTO were directly embedded in HS2 work during the period that the Lovegrove Review now criticises.

    AtkinsRéalis

    The Canadian engineering firm that rebranded from SNC-Lavalin in 2023, and the lead Canadian engineering member of Cadence, was part of the CH2M / Atkins / SENER Engineering Delivery Partner joint venture for HS2 Phase One. That ten-year contract was awarded in 2016 and was valued between £250 million and £350 million. The Engineering Delivery Partner role placed Atkins inside HS2 Ltd, fully integrated, with explicit responsibility for supporting the preparation and procurement of the Main Works Civils Contracts — the contracts that the Lovegrove Review identifies as awarded at insufficient design maturity and on terms which did not manage risk. Atkins’s UK arm was acquired by SNC-Lavalin in 2017, mid-way through the contract, and is now part of AtkinsRéalis.

    SYSTRA

    The French rail engineering firm and a Cadence member was part of the Mott MacDonald / SYSTRA design joint venture working alongside the Balfour Beatty VINCI construction joint venture on HS2 Lots N1 and N2 of the Main Works Civils Contracts — the 90 km West Midlands stretch including the Long Itchington Wood Green tunnel and the Birmingham approaches. SYSTRA was also a partner in the BBV-SYSTRA (BBVS) joint venture for the Old Oak Common station in London. SYSTRA’s role on HS2 was thus across both design and construction-management functions on the very contracts whose financial architecture HS2’s own chair has publicly criticised before the UK Public Accounts Committee.

    These observations are factual, not attributive. The Lovegrove Review is explicit that the institutional failure on HS2 lay primarily with HS2 Ltd’s governance and culture and secondarily with the Civil Service, not with the contractor firms per se. Many of the firms involved are world-leading rail engineers, and their inclusion in Cadence reflects that. The point is that two firms whose immediately prior major HSR engagement is now the subject of a Cabinet Office post-mortem on cost control are now central to ALTO’s design, build, and ongoing operation under a DBFOM structure. For parliamentarians and analysts considering whether the lessons of HS2 are being absorbed into ALTO’s procurement and oversight, this is a fact that warrants disclosure in any briefing material on the project.

    Implications for ALTO

    What this changes

    Canada has the same parliamentary system as the United Kingdom. The same Treasury Board controls. The same Crown corporation tools. The same Public Accounts Committee. The same Auditor General. The institutional architecture that failed at HS2 — and that Lovegrove has now diagnosed in unusual detail — is the architecture being used to deliver ALTO.

    The HS2 cost trajectory is now an official G7 reference class

    The Cabinet Office published trajectory — £20.5bn (2012) to £82.2bn (2026) in constant 2019 prices — is now an official G7 data point. It belongs in every cost-related submission, briefing letter, and parliamentary communication on ALTO between now and a Final Investment Decision.

    The Crown corporation critique applies directly

    The structural critique of the Company Limited by Guarantee model translates directly to ALTO HSR Inc. The case for Crown-corporation delivery has been overstated; the commercial discipline its proponents claim does not flow from the structure adopted when 100% of funding comes from the public purse.

    Recommendation 14 creates a concrete obligation

    Government, not contractors, must produce the comparative analysis of alternative ways of delivering the project — including alternative speed classes and route corridors — before any Notice-to-Proceed-equivalent decision. Doing it after commitment is, in Lovegrove’s framework, too late.

    Berkeley’s vindication establishes a precedent

    The Cabinet Office’s 2026 vindication of Lord Berkeley’s 2020 dissenting report establishes a public-record precedent for the credibility of structured citizen reference-class analysis in HSR governance. That precedent is now available to be cited.

    The AtkinsRéalis / SYSTRA overlap warrants disclosure

    The involvement of two Cadence members in the HS2 work the Lovegrove Review now criticises is a material fact for parliamentarians considering whether ALTO’s procurement reflects institutional learning from HS2, or the application of the same contractual architecture in a different jurisdiction.

    The Lovegrove and Stewart Reviews together represent the most current, most senior statement by a G7 government on what arm’s-length high-speed rail delivery requires of a Westminster-system sponsor department. The lessons set out in the Lovegrove Review are not lessons Canada needs to learn the hard way. They are available now.

    Download Full Brief
    Reading Lovegrove (PDF)
    Complete analysis for parliamentarians, the Parliamentary Budget Officer, the Auditor General, and constituents tracking ALTO’s governance and procurement
    Download PDF
    Sources

    Primary documents and statements

    1.
    Lovegrove, Sir Stephen. Review of implications for the Civil Service and wider public sector of findings of the James Stewart Review. Cabinet Office, May 2026. Published under Open Government Licence v3.0. gov.uk
    2.
    Stewart, James. The HS2 Experience: Major Transport Projects Governance and Assurance Review. 2025.
    3.
    Thompson, Sir Jon, Executive Chair, HS2 Ltd. Oral evidence to the House of Commons Transport Committee, HS2: progress update, HC 85, 10 January 2024, Questions 393–471 (in particular Qq. 410–412 on cost-estimation methodology, Q417 on the 99/1 risk allocation under cost-plus contracts, Q428 on inadequacy of board-level management information, and Q435 on the limits of corrective action under existing contractual fundamentals). parliament.uk
    4.
    Lord Berkeley. HS2 Review Dissenting Report, January 2020.
    5.
    Government of Canada / Cadence Consortium. Announcement of selection of Cadence as preferred private developer partner for the ALTO HSR project, February 2025.
    6.
    Joint Project Office (VIA Rail Canada / Canada Infrastructure Bank). High Frequency Rail Project Business Case Update. December 2021.
    7.
    Transport Action Canada. Statement on the selection of the Cadence consortium for ALTO HSR co-development. February 2025. transportaction.ca
    8.
    ALTO HSR Citizen Research Initiative. From HFR to ALTO: How a $5 Billion Plan Became an $80–120 Billion One. March 2026.
  • Reading the ledger

    Reading the Ledger

    The single equation every operating rail corridor has to balance — and what it tells us about ALTO.

    ◆ Foundational Framework

    Most public discussion of major rail projects gets lost in the detail of individual numbers — capital cost, ridership, ticket price, subsidy, projected GDP impact. Each is presented as a standalone claim, defended or contested on its own terms. The result is a debate that produces heat without resolution.

    There is a simpler approach. Every operating rail corridor in the world, public or private, has to balance the same equation every year. The five terms in that equation are not negotiable; the equation is an accounting identity. What is negotiable is which terms are filled in, which are left implicit, and which are quietly set to zero by the proponent’s framing.

    Critical Finding

    Every operating rail corridor has to balance the same five-term equation every year. Choose any three of the four right-hand terms, and the fourth is fixed by arithmetic — not by political assertion. ALTO’s published materials supply numbers for some of the five terms, leave others implicit, and assume one — land value capture — is zero. The result, when written out, does not balance.

    This brief sets out the equation, walks through what anchors each of its five terms, and applies it to ALTO. The point is not to settle the project on a single number. It is to give the reader a structure for reading any major rail project’s published materials and asking the simple question: do the numbers balance?

    Download Full Methodology Paper
    A Framework for Independent Evaluation of the ALTO HSR Project (PDF)
    The annual fiscal ledger framework, the seven-stage analytical pipeline, and the supporting research notes underpinning each ledger term — the full apparatus this brief summarises

    Download PDF

    The Equation

    The five terms every corridor balances

    The ledger looks like this:

    The Annual Fiscal Ledger
    Capex × CRF+O&M and fleet capital=Ridership × Fare+Public subsidy+Land value capture
    annual debt service+annual operating cost=annual farebox+annual subsidy+annual LVC

    In words: the cost of running the corridor in a given year — debt service on the capital outlay, plus operations and maintenance, plus the periodic replacement of the train fleet — must equal the revenue collected from those who ride, plus the public subsidy required to close any remaining gap, plus whatever supplementary revenue is captured from land value uplift around stations.

    The identity is an accounting truism. What makes it analytically useful is that each of its five terms is independently anchored. None can be set at will. Each has a defensible value that emerges from a specific empirical or engineering methodology, rather than from political assertion. A claim that does not specify all five terms is incomplete by construction.

    The five terms group naturally into three sections. The cost side has two: capital service and operating cost. The earned revenue side has one: farebox. The gap-closing section has two: public subsidy and land value capture. Each section is anchored by a distinct methodology, and each gives a particular reader a particular handle on the project.

    Section 01 · The Cost Side

    What it costs to run the corridor each year

    The two cost terms — capital service and operating cost — are anchored by entirely separate methodologies. Both have to be answered before any debate about ticket prices or ridership begins.

    ~$4.9B
    annual capital service at the proponent-stated capex
    $75B capex, 5% / 30-yr CRF
    ~$9.3B
    annual capital service at the reference-class central capex
    $143B central RCF estimate
    ~$2.15B
    annual operating cost: O&M + fleet capital
    Stage 4 bottom-up at MID service

    Capital service (Capex × CRF) is the annual cost of paying back the capital outlay. It is the capital expenditure multiplied by the capital recovery factor, which reflects the cost of capital and the amortisation period. At the proponent-stated $75 billion capex and a representative 5% / 30-year CRF, this is approximately $4.9 billion per year. At the reference-class-adjusted central capex of $143 billion — derived from international cost-overrun patterns calibrated by the corridor’s engineering and community complexity — the same calculation produces approximately $9.3 billion per year.

    Operating cost (O&M and fleet capital) is the annual recurring cost of running the corridor, built bottom-up from corridor asset inventory and service-level inputs across three streams: infrastructure maintenance and renewals, operating categories (traincrew, traction energy, station operations, network control, commercial, insurance, general overhead), and the periodic replacement of trainsets. At MID service intensity this produces approximately $2.15 billion per year — $1.27 billion in infrastructure maintenance, $700 million in operations, and $180 million in fleet capital recapitalisation. International comparators (SNCF Réseau, Network Rail HS1, California HSRA, Spanish ADIF) are used at the end of the build for cross-validation, not as the primary estimating method.

    The crucial methodological point: operating cost is built independently of capital cost. The bottom-up engineering estimate of recurring annual cost does not depend on whatever capex figure the proponent adopts. It is therefore independent of the optimism bias that pervades capital cost estimation in the cost-overrun reference class.

    Why this matters

    A reader who is told only the capital cost has been given half the cost picture. A reader who is told operating cost will be covered by farebox has been given an answer that depends on the next section. Neither of these is a complete account of the cost side of the ledger.

    Section 02 · The Earned Revenue

    What the corridor can actually sell

    The earned revenue side of the ledger has one term: farebox. It is the only revenue source that can in principle be raised by selling something to a willing buyer; everything else on the right-hand side is either a transfer from the treasury or a charge on third parties.

    ~$1.3B
    annual farebox revenue at the welfare-efficient operating point
    Regime B: ~8M riders at fare parity with air
    5–12M
    annual ridership envelope across the operating-regime spectrum
    Stage 5 modal-shift frontier
    24–43M
    ridership figures in ALTO’s published materials
    all sit outside the achievable frontier

    Farebox revenue (Ridership × Fare) is the product of two variables that cannot be chosen independently. Raising fares reduces ridership along the air-rail and road-rail modal-shift S-curves; lowering fares reduces revenue per rider. The achievable combinations of ridership, fare, and corresponding subsidy lie on a one-dimensional frontier through a four-variable space. Choose any one variable, and the other three are fixed by the modal-shift relationships and the corridor’s demographics.

    For ALTO, the modal-shift frontier produces three discrete operating regimes. Regime A (heavy subsidy, deep fare discount to air) lands at approximately 12 million annual riders, $5 billion annual operating subsidy. Regime B (welfare-efficient, fare parity with air) lands at approximately 8 million annual riders, $2 billion annual operating subsidy, with peak fare revenue of approximately $1.29 billion. Regime C (minimal subsidy, yield-managed premium fare) lands at approximately 5 million annual riders, $1 billion annual operating subsidy.

    The Government’s published ridership figures — 24 million annually in some materials, 1.21 billion trips over the first 40 years (averaging approximately 30 million annually) and 43 million annually by 2084 in the Q-923 reply — all sit outside this achievable frontier. The reply’s $100 billion fare-revenue projection over the same forty-year window implies an average fare of approximately $83 per trip, a (fare, ridership) pair the modal-shift framework does not produce.

    Why this matters

    A claim that pairs a ridership figure with no specified fare, or a fare with no specified ridership, is not internally consistent. The two are linked by the corridor’s modal-shift mathematics. The frontier is the single-degree-of-freedom constraint that makes this so — and it is the analytical reason ALTO’s headline ridership figures cannot be defended on the modal-shift evidence.

    Section 03 · The Gap Closers

    What closes the gap between cost and earned revenue

    If farebox revenue does not equal cost — and at every operating point on the modal-shift frontier for ALTO, it does not — the gap has to be closed by something. Two instruments are available.

    $3.6–10.2B
    implied annual public subsidy across the cost and operating-regime range
    the residual that closes the ledger
    5–15%
    share of capital service typically funded by LVC in international comparators
    HS1, Crossrail, MTR, Japan
    $0
    land value capture under ALTO’s currently published scope
    no disclosed LVC instrument

    Public subsidy is the dominant gap-closer in every operational HSR network in the world. Every HSR system except the four highest-density Japanese and Chinese trunks operates with a structural annual operating subsidy on top of capital service support. Even those four required the full capital outlay from public funding. Public subsidy is the residual term in the ledger: whatever closes the gap between annual cost and the sum of farebox plus LVC. It is bounded below by zero (the corridor cannot pay passengers to board) and above by total cost.

    Land value capture is the only large-scale supplementary mechanism with an empirical track record. The known instruments — HS1’s station-area development uplift, Crossrail’s Business Rate Supplement, Hong Kong’s MTR Rail+Property model, Japan’s private-railway joint development arrangements — produce typically five to fifteen per cent of capital service requirements across these comparators. The remainder, in every case, closes through public subsidy.

    ALTO’s published materials disclose no LVC mechanism. Bill C-15 (the High-Speed Rail Network Act) provides streamlined expropriation and right-of-first-refusal authority but no betterment levy, tax-increment financing district, special assessment district, joint development framework, or air-rights regime. The forecast 60,000 to 63,000 new residential units around stations is invoked as a downstream property-tax benefit accruing to municipalities — not as a financing source for the corridor. The Senior Director, Commercial and First Nations Financial Participation role addresses Indigenous equity in Alto itself, not station-area land value capture.

    Under the current published scope, therefore, the LVC term is zero. The entire gap closes through public subsidy.

    Why this matters

    A claim that does not name a mechanism for closing the gap is implicitly claiming that public subsidy will close it. A claim that the corridor will be “self-sustaining” is a claim about a specific term — operating cost coverage by farebox — that says nothing about the much larger term of capital service. The reader who treats “self-sustaining” as a description of the project’s lifetime public cost is reading it against the narrowest available technical definition.

    Side by Side · ALTO’s Ledger

    The published numbers, written out

    Plug ALTO’s published numbers into the equation. The result, in central-case figures for the full corridor at maturity, looks like this:

    Ledger term What ALTO has disclosed
    Capex × CRF — annual capital service. At the proponent-stated $75B capex and a representative 5% / 30-yr CRF, approximately $4.9B per year. At the reference-class central capex ($143B), approximately $9.3B per year. ALTO has disclosed the capex range ($60–90B, AACE Class 5), but has not disclosed the annual capital service figure or the amortisation assumption behind it. The Q-923 reply addressed in Reading the Answer describes operations as “self-sustaining”, a claim that is silent on capital service.
    Term status:Capex disclosed, debt service not
    O&M and fleet capital — annual operating cost, built bottom-up from corridor asset inventory at MID service: ~$2.15B per year. ALTO refers in Q-923 to bottom-up O&M built from operational benchmarks and lifecycle profiles, but no figure has been published. The Stage 4 bottom-up engineering estimate in the methodology paper supplies a defensible ~$2.15B per year.
    Term status:Method described, figure not disclosed
    Ridership × Fare — annual farebox revenue. At the welfare-efficient operating point (Regime B), approximately $1.29B per year. ALTO has disclosed multiple, non-reconciled ridership figures (24M annually, 30M average over forty years, 43M by 2084). Average implied fare of ~$83 per trip from the Q-923 $100B / 40-year revenue figure sits outside the corridor’s achievable modal-shift frontier.
    Term status:Ridership figures non-reconciled and off-frontier
    Land value capture — supplementary revenue from station-area land value uplift. International comparators fund 5–15% of capital service this way. No disclosed mechanism. The forecast 60,000–63,000 new residential units around stations is invoked as a downstream property-tax benefit accruing to municipalities, not as a financing source. The LVC term is zero by default.
    Term status:No mechanism disclosed
    Public subsidy — the residual that closes the gap. With LVC at zero, this is approximately $5.76B per year at proponent-stated capex; approximately $10.16B per year at the reference-class central. Not disclosed in any form. The Q-923 reply asserts operations will be “financially self-sustaining” and “eliminating the need for ongoing operating subsidies.” That framing speaks to the operating cost term, which is the smaller of the two cost terms. It does not speak to the capital service term, which is approximately twice as large.
    Term status:Not disclosed; framed as zero

    At the reference-class central capex of $143 billion, the implied annual subsidy rises to approximately $10.16 billion. At the proponent-stated capex but the high-ridership operating regime (Regime A), the implied subsidy is approximately $3.6 billion per year — lower than the welfare-efficient case because Regime A places a heavier subsidy directly on the operating account, with a larger fare-revenue base offsetting some of it.

    None of these subsidy figures appears in ALTO’s published materials. None appears in the Government’s response to Order Paper Question Q-923. The framing speaks to the operating cost term, which is the smaller of the two cost terms. It does not speak to the capital service term, which is approximately twice as large.

    The Honest Answer

    Does the equation balance?

    Not in any of the operating regimes the modal-shift frontier permits. The corridor at any defensible operating posture produces fare revenue substantially below the sum of capital service and operating cost. The gap, in central-case figures, is between $3.6 billion and $10.2 billion per year — corresponding to a 60-year present value, at standard social discount rates, of roughly $80 billion to $230 billion.

    This is not, in itself, an argument against the project. Most large infrastructure projects in most countries close their gaps through public subsidy and have done so since the nineteenth century. The question is not whether the gap exists — the equation guarantees that it does — but whether the gap is being honestly disclosed and whether the public benefit justifies its size.

    The first half of that question can be answered by reading the published materials carefully. The second half is the political-economy judgment that the institutional process is supposed to support.

    What the methodology developed here does is make the first half answerable. The equation forces the disclosure. Every term is independently anchored, and a published claim that does not specify all five terms is incomplete by construction. A reader who knows what the equation looks like can ask, at every turn, what the missing terms are.

    For the Next Federal Statement

    Three questions to ask of any major rail project

    Each question follows naturally from the ledger framework. None presupposes opposition to any project. Each is the kind of question the equation requires to be answered before any reader can form a judgment.

    1. On the cost side

    What is the annual capital service figure at the stated capex, and over what amortisation period? What is the annual operating cost figure at the planned service level? Are the two reported separately, or aggregated under a single label that conflates them?

    2. On the revenue side

    At what fare is the stated ridership achievable on the relevant modal-shift S-curves? Does the (fare, ridership) pair sit on the corridor’s achievable frontier, or does it require modal-shift behaviour the international evidence does not support?

    3. On the closing terms

    What is the implied annual public subsidy at the stated capex, operating cost, and farebox revenue? Is land value capture being assumed as a financing source? If so, through what disclosed instrument? If not, is the LVC term acknowledged to be zero, and the subsidy term enlarged correspondingly?

    None of these questions presupposes a view about whether ALTO should be built. Each is the kind of question a reasonable reader would ask before forming a view. Each is also the kind of question the parliamentary record has so far not been pressed to answer in the terms the equation requires.

    Sources

    Methodology and supporting documents

    This brief is a synthesis of the analytical methodology developed in the Initiative’s full methodology paper, A Framework for Independent Evaluation of the ALTO HSR Project (May 2026). The methodology paper contains the detailed derivations, reference-class calibrations, and stage-by-stage rubrics summarised here.

    1.ALTO HSR Citizen Research Initiative, A Framework for Independent Evaluation of the ALTO HSR Project (Methodology Paper), May 2026 — the annual fiscal ledger framework, Section 2; the seven-stage analytical pipeline, Sections 3 through 7.
    2.Capital service calibration — CAPEX Notes 1 through 4: Engineering Complexity Rubric; ALTO Engineering Complexity Scorecard; Community Friction and HSR Cost (international comparative analysis); Engineering Complexity and Community Friction as joint predictors of HSR cost.
    3.Operating cost — O&M Notes 1 through 3: Infrastructure Maintenance Costs for HSR; Operating Costs for HSR; Combined Cost Recovery for ALTO HSR.
    4.Modal-shift frontier — MS Notes 1 through 4: Air-rail modal-shift S-curve; Road-rail modal-shift S-curve; ALTO HSR ridership envelope 2035–2080; Subsidy frontier and optimisation.
    5.Land value capture analysis — Methodology Paper, Section 2 (LVC paragraph); LVC Note 1 (assessing the $12 billion claim in the McGill TRAM financial model).
    6.Order Paper Question Q-923, 45th Parliament, 1st session. Asked by Philip Lawrence MP (Northumberland–Clarke), March 5, 2026; answered by the Minister of Transport, April 22, 2026; reply signed by Mike Kelloway, Parliamentary Secretary. ourcommons.ca
    7.ALTO HSR Citizen Research Initiative, Reading the Answer (Cost & Ridership Brief), May 2026 — the companion brief reading the three numerical claims in Q-923 against the academic record.
    8.ALTO HSR Citizen Research Initiative, Reading the Footnote (Cost Estimation Brief), May 2026 — the companion brief on the AACE Class 5 classification and what it implies for the $60–90 billion figure.
    9.ALTO HSR Citizen Research Initiative, The Report That Vanished (Parliamentary Process Brief), May 2026 — the parliamentary record into which the Q-923 reply was placed.
  • Transport Action Canada

    The Voice ALTO Has Already Heard From

    Transport Action Canada and Transport Action Ontario — the country’s principal pro-rail civil-society voice — have made detailed substantive recommendations about ALTO. What they asked for. What the record shows ALTO has so far addressed. What their voice contributes that nothing else in the public record does.

    ⚠ Documents Under Analysis

    On March 16, 2026, Transport Action Canada and Transport Action Ontario submitted an 18-recommendation written response to ALTO at the close of the January–March 2026 consultation period. The organizations also published an open letter setting out what they believe the substantive questions about the project are, and what credible alternatives have been studied previously.

    They are explicitly pro-rail. They are not opposed to high-speed rail in principle. Their concerns are technical, financial, and service-continuity concerns, and they are asking for the same documents and analyses that Parliament’s own Transport Committee asked for in September 2024 — and that have not been produced.

    Critical Finding

    The questions about ALTO’s cost, ridership, document release, and VIA-service impact are not coming only from project-affected landowners, from anti-rail critics, or from research initiatives. They are coming from the country’s principal pro-rail civil-society voice, in March 2026, on the public record, having formally engaged with ALTO through ALTO’s own consultation process.

    The brief sets out what Transport Action asked for, what the record shows ALTO has addressed, and what credible alternatives they have publicly identified.

    Download
    The Voice ALTO Has Already Heard From — Full Brief (PDF)
    What Transport Action Canada and Transport Action Ontario asked of ALTO, what ALTO has addressed, and what their voice contributes to the public record
    Download PDF
    The Witness

    Who Transport Action is

    Transport Action Canada describes itself as “Canada’s citizen advocacy organization for public transportation,” with members who have “discussed and debated the subject over the past five decades, including of course High Speed Rail and possible alternatives.” It and its provincial affiliates — including Transport Action Ontario, jointly authoring the consultation letter analysed here — are the principal national civil-society voice on Canadian intercity rail policy.

    Their position on ALTO is unambiguous. The open letter opens by welcoming “serious discussion of all options to improve passenger rail.” The consultation letter opens by describing the organizations as “a knowledgeable, passenger-focussed NGO that is very supportive of intercity passenger rail.” They explicitly recognize the underlying problem ALTO is intended to address — that VIA Rail’s constrained access to CN’s Kingston Subdivision “has long been recognized as untenable, which prompted the development and launch of VIA’s High Frequency Rail proposal in 2015.”

    They acknowledge the limits of incremental improvement: “just improving the CN route in isolation while continuing to operate alongside freight would not come close to the quintupling of capacity and slashing of travel times possible with some kind of dedicated track.” They are, in plain terms, an organization that wants more passenger rail in Canada and is substantively critical of how this particular HSR project is being delivered.

    What They Asked For

    The March 2026 consultation response

    Transport Action’s March 16, 2026 letter to ALTO’s Government and Stakeholder Relations office contains eighteen specific recommendations across seven sections. The four recommendations that most directly overlap with the existing CRI evidence base are set out below.

    Recommendation 1
    On the business case and cost
    What Transport Action asked

    “There is considerable skepticism from the public and stakeholders about the business case for HSR… It is urgent that a detailed Business Case be completed as soon as possible, including preferred corridor, capital cost, detailed ridership, fares, revenue and methods of calculation.”

    Mapped onto the parliamentary record

    This is, in substance, the same request as Recommendation 4 of TRAN Report 18 (September 2024), which asked the Minister to require an HFR-versus-HSR cost analysis within six months. As CRI’s brief The Report That Vanished documents, that analysis was never produced. Transport Action is asking, eighteen months later, for the same kind of cost-and-business-case work.

    Recommendation 2
    On ridership transparency
    What Transport Action asked

    “No details are provided on the ridership model, population assumptions, network assumptions, demand per segment, fares, cost of gasoline etc. Although the ridership assumption may be reasonable when lifted from European ridership, there is skepticism that this would be replicated in central Canada, due to lower fuel prices, absence of road tolls etc.”

    Mapped onto the parliamentary record

    This maps directly onto Claim 3 in Reading the Answer — the government’s 43-million-by-2084 ridership figure in Q-923. Transport Action specifically raises the central-Canadian fuel-price and road-toll conditions that distinguish the corridor from the European benchmarks, and quantifies the Ontario provincial subsidy to personal car use at $2.5 billion per year as a “politically tilted playing field” that any credible ridership model must account for.

    Recommendation 3
    On document release
    What Transport Action asked

    “We urge you to release a full unredacted version of the JPO report, plus any other reports that were in the ‘data room’ made available to the three bidders. At this time, with the tender process completed, there should be nothing in these reports that is business-confidential.”

    Mapped onto the parliamentary record

    This is — almost word for word — the same request as Recommendation 6 of TRAN Report 18. Transport Action makes an additional point that the procurement-completion rationale for non-disclosure no longer applies: with the bidder data-room phase concluded, there is no remaining commercial confidentiality argument. The reports have still not been released.

    Recommendation 6
    On the future of VIA service
    What Transport Action asked

    “Recent media reports from Kingston regarding possible diminution of current VIA Rail services when ALTO is operational must be heeded… It is important that ALTO and VIA Rail jointly issue a statement promptly about plans for services at these cities. Otherwise, local elected officials and residents will continue to impede ALTO’s progress.

    Mapped onto the parliamentary record

    This maps directly onto Recommendations 8 and 10 of TRAN Report 18 — the VIA-impact analysis and the no-service-reduction commitment, both unanswered since September 2024. The Senate TRCM raised the same concern in February 2026. The question has now been asked across two parliamentary chambers and one substantial stakeholder consultation submission; it has not been substantively answered.

    Transport Action’s remaining fourteen recommendations cover downtown and shoulder station design, affordable fares, intercommunity bus access for towns currently outside the rail network, emergency-management cooperation with rural fire and EMS, wildlife crossings, sufficient road and trail bridges, recognition of Ontario’s 1834 Drainage Act, First Nations contingency planning for archaeological discovery, sensitive-agricultural-use mapping (sugar bushes, vineyards, certified organic land), and compensation frameworks for intensive agricultural operations that would need to be relocated. Several bear directly on issues documented in CRI’s Five Hundred Farms brief.

    Three Alternatives They Identified

    What pro-rail technical analysis says is possible

    A question CRI has not previously had answered by a technically literate pro-rail body: were credible alternatives to ALTO actually studied, and what did the studies show? Transport Action’s open letter identifies three.

    01

    Targeted CN-route improvements

    “Further investments to improve passenger and freight fluidity, like the third track between Belleville and Napanee and station improvements… would make a big difference to reliability at modest cost.”

    Transport Action concedes this alone is insufficient to deliver the “quintupling of capacity and slashing of travel times” possible with a dedicated track — but lays out a complementary package of known modest cost.

    02

    The freight grand bargain

    “Moves most CN freight over to the CPKC route through Perth… The existing CN route could then be upgraded to support more passenger services at up to 170 km/h, with travel times of around 4 hours between Toronto and Montreal or Ottawa.”

    This is the High Performance Rail framework substantially as CRI has documented it, here independently advocated by Transport Action as a technically credible option.

    03

    HFR on the original Havelock alignment

    “A dedicated track that takes a more direct route between Toronto and Ottawa, with the advantage of reconnecting Peterborough to the railway network, was VIA Rail’s preferred option, while also preserving service on the existing route through Kingston.”

    This is the project the Joint Project Office was funded in 2017 to study, the project the Transport Committee studied in 2023–24, and the project the federal government redesignated in late 2024.

    Why earlier HSR-along-the-lakeshore studies did not proceed

    Of independent technical interest is Transport Action’s observation about why HSR following the Lake Ontario lakeshore has been studied multiple times without proceeding:

    High Speed Rail following a lakeshore from Toronto through Kingston has also been studied before, more than once, by both the federal and provincial governments, without proceeding. For safety reasons, and to achieve 7 km+ minimum radii for higher speeds, such a dedicated track could not be placed too close to the existing alignment nor right alongside Highway 401. It would thus require significant expropriation, and the number of homes and businesses close to CN’s tracks and the 401 has only grown since the last such study in 2011. The chances are that communities like Port Hope and Trenton would be bypassed entirely, and route from Kingston to Ottawa would also then also go through the same sensitive Frontenac Arch region and many of the communities expressing most concern about Alto’s southern study corridor.

    Transport Action Canada, open letter on ALTO HSR route options in eastern Ontario. read the letter

    This is the route-geometry argument set out by a pro-rail body with the technical standing to make it — the same observation about HSR’s 7-km curve-radius requirement that CRI’s engineering research has documented, here presented as a published critique by an established advocacy organization.

    What Their Voice Contributes

    A fifth source category, otherwise absent

    The Citizen Research Initiative’s briefs to date have drawn on four categories of source. Each has its own evidentiary weight; each has its own limitations. Transport Action contributes a fifth that has been substantively absent until now.

    Parliamentary record

    Order Paper questions, Transport Committee reports, Senate committee testimony, the High-Speed Rail Network Act. Authoritative but procedurally bounded.

    Academic studies

    The McGill Transportation Research and Munk School Global Economic Policy Lab analyses. Methodologically rigorous but bounded by funding and study scope.

    Journalism

    The Canadian Press and Globe and Mail reporting; CBC News; Globe coverage of the NFU response. Documentary but episodic.

    Affected stakeholders

    OFA, UPA, CFA, BFO, NFU. Authentic to affected communities but advocating for their members’ specific interests.

    Pro-rail advocacy

    Transport Action Canada and Transport Action Ontario. A credible, technically literate, pro-rail civil-society voice with no opposition to the project in principle, no economic interest in its outcome, and a fifty-year record of engagement with Canadian intercity passenger rail policy.

    This matters in two specific ways. First, it forecloses the response that the questions about ALTO’s cost, ridership, document release, and VIA-service impact are coming only from project-affected landowners or from anti-rail critics. They are coming from the country’s principal pro-rail civil-society voice, on the public record, having formally engaged with ALTO through ALTO’s own consultation process. Second, it puts the alternatives that have been considered — including the HPR framework the Initiative has been documenting — into the technical vocabulary of an organization that has the standing to describe them.

    Recommendations That Remain Live

    What still has not been produced

    As of May 2026, the public record shows that:

    The cost analysis Transport Action’s March 2026 letter asked for — and that TRAN Report 18 Recommendation 4 had asked for in September 2024 — has not been produced. The $60–90 billion AACE Class 5 figure in Q-923 stands without it.
    The Joint Project Office report Transport Action’s March 2026 letter asked to be released — and that TRAN Report 18 Recommendation 6 had asked to be released in September 2024 — has not been released. Transport Action’s additional point that the procurement-completion rationale for non-disclosure no longer applies has not been addressed.
    The VIA-impact analysis Transport Action’s March 2026 letter asked for, that the Senate TRCM raised concerns about in February 2026, and that TRAN Report 18 Recommendations 8 and 10 had asked for in September 2024, has not been produced. ALTO’s published material continues to refer to “optimization” of existing VIA services without a binding commitment.
    The ridership-model assumptions Transport Action’s March 2026 letter asked be made public have not been published. The government’s 43-million-by-2084 figure in Q-923 stands without disclosed methodology behind it.

    None of these are partisan demands. None of them is hostile to the project. All of them are recommendations from an established pro-rail advocacy organization, made through ALTO’s own consultation process, asking the same things that Parliament’s own committee was asking. Their continued non-fulfilment is procedural, not substantive — and procedurally, as The Report That Vanished sets out in detail, the questions remain available to be revived by parliamentary or stakeholder action.

    Download Full Brief
    The Voice ALTO Has Already Heard From (PDF)
    Reference document for federal decision-makers, parliamentarians, journalists, and constituents tracking the file
    Download PDF
    Sources

    Primary documents and references

    1.
    Transport Action Canada and Transport Action Ontario, Comments arising from ALTO HSR Stakeholder Roundtable and Public Consultation Sessions (letter to Peter Paz, Government and Stakeholder Relations, ALTO), March 16, 2026. Signed by Terry Johnson (President, Transport Action Canada) and Peter Miasek (President, Transport Action Ontario). ontario.transportaction.ca
    2.
    Transport Action Canada, Why did the government chose Alto? (open letter on ALTO HSR route options in eastern Ontario), 2026. ontario.transportaction.ca
    3.
    House of Commons Standing Committee on Transport, Infrastructure and Communities, Issues and Opportunities: High Frequency Rail in the Toronto to Quebec City Corridor. 18th Report, 44th Parliament, 1st Session. Tabled September 2024. ourcommons.ca
    4.
    Order Paper Question Q-923, 45th Parliament, 1st session. Asked by Philip Lawrence (MP for Northumberland–Clarke), March 5, 2026; answered April 22, 2026.
    5.
    ALTO HSR Citizen Research Initiative companion briefs: Reading the Answer (May 2026); Reading the Footnote (May 2026); The Report That Vanished (May 2026); What We Know About ALTO’s Reporting and Accountability (May 2026); Five Hundred Farms (May 2026).
  • Reading the Answer

    Reading the Answer

    What the government tells Parliament about ALTO’s cost, ridership and subsidies — and what two independent academic studies show.

    ⚠ Document Under Analysis

    On April 22, 2026, the Minister of Transport tabled the answer to Order Paper Question Q-923, asked by Philip Lawrence (MP for Northumberland–Clarke). Three numerical claims sit at the heart of that answer.

    Two independent academic analyses of the same corridor have been published by Canadian universities — one in 2025, one in 2021. Both reach quantitatively different conclusions. This brief sets them side by side.

    Critical Finding

    None of the three claims in Q-923 is factually inaccurate. Each is constructed using the most favourable available definition, range, or horizon. The result is a headline picture meaningfully different from the academic record on the same project.

    The brief looks at each claim in turn, sets the government’s wording next to the academic finding, and asks the simple question: is the government’s framing realistic?

    Download
    Reading the Answer — Full Brief (PDF)
    The three numerical claims in Q-923 (cost, ridership, subsidies), set side by side with the published academic record from McGill and the Munk School Global Economic Policy Lab
    Download PDF
    The Three Claims

    What Q-923 says

    On March 5, 2026, MP Philip Lawrence submitted Order Paper Question Q-923, asking the government about the financial viability of the ALTO project. The Minister of Transport’s answer, tabled in the House of Commons on April 22, 2026, contained three specific numerical statements.

    On subsidies
    “Self-sustaining”
    operations expected to cover their own costs — “no need for ongoing operating subsidies”
    On cost
    $60–90 B
    stated range for total project cost — classified by ALTO as AACE Class 5 (−50%/+100% accuracy band)
    On ridership
    43 M / year
    forecast for 2084 — year 55 of operations, if construction begins in 2029 as planned

    Each of these three propositions is the subject of this brief. Each is technically defensible. Neither is, on the academic record now publicly available, the only available framing of what is being described.

    The Academic Record

    Two independent studies of the same corridor

    Two academic analyses of the ALTO corridor are publicly available. They differ in age, scope, methodology and authority. They reach quantitatively similar conclusions on the questions both address.

    McGill University — Transportation Research at McGill (2025)

    The primary academic comparator. Zhang, Negm and El-Geneidy, High-Speed Rail in Canada: Insights from a corridorwide survey and a financial analysis. Combines a 6,738-respondent travel-demand survey across six Census Metropolitan Areas with a 50-year financial model that uses ALTO’s own published cost assumptions as its inputs. Funded by Queen’s University and NSERC. Describes high-speed rail throughout in favourable terms — the study is not advocacy against the project.

    Munk School (Toronto) — Global Economic Policy Lab (2021)

    An earlier independent reference point. Bien, Iqbal, Li and Stecher, under Lab Director Professor Mark Manger. High-Speed Rail: Toronto – Montreal Economic Analysis. Prepared by graduate-level “Clean Energy Analysts” within the Lab. Not a peer-reviewed publication. Covers the Toronto–Montreal segment only (540 km), not the full corridor; figures in 2021 dollars. Written four years before the formal ALTO process began. Its value here is as an early, independent reference point reaching conclusions consistent with the more recent McGill work.

    The brief below treats McGill as the primary academic comparator. Munk is cited where it provides confirming or complementary evidence on the questions both studies address.

    Claim by Claim

    The government’s framing, beside the academic finding

    For each of the three claims in Q-923, the wording of the parliamentary answer is set beside what the McGill and Munk studies show. The pattern at all three points is the same.

    Claim 01 On subsidies
    The government says

    “Operations are expected to be financially self-sustaining, with revenues covering operations and maintenance costs and eliminating the need for ongoing operating subsidies.”

    Minister of Transport, response to Q-923 (April 22, 2026)

    The academic record shows

    McGill (2025): Operations cover their own costs at full ridership. Capital must be repaid by public funds at ~C$1.23 billion per year for 47 years, totalling approximately C$61.62 billion before full cost recovery in year 48.

    Munk (2021): Operations cover their costs at a breakeven ticket of C$109. At a more affordable C$75 ticket, the Toronto–Montreal segment alone requires C$5.08 billion in subsidy. The construction phase is publicly financed in both models.

    Why this matters The government defines “subsidy” narrowly — the operating cash transfer required to keep trains running once they are running. The academic studies extend the analysis to capital servicing, which is the much larger lifetime public obligation. A useful way to think about it: a homeowner who rents out a basement suite can truthfully say the rental income covers their utilities and property tax. But the mortgage is still being paid every month, from a different account, on a different schedule. “The suite pays for itself” is technically accurate; it is also not a complete description of the cost of owning the house. ALTO operations being “self-sustaining” is the same kind of statement. The mortgage — roughly C$1.23 billion per year, for 47 years — is still being paid by the public. A reader who treats “self-sustaining” as a description of the project’s lifetime public cost is reading it against the narrowest available technical definition.
    Claim 02 On cost
    The government says

    “Between $60 and $90 billion.”

    Q-923 (April 22, 2026). ALTO’s May 8, 2026 blog post classifies the same figure as an AACE Class 5 estimate — an accuracy range of −50% to +100%.

    The academic record shows

    McGill (2025): Total construction cost C$79.8 billion in 2025 dollars for the full corridor — sits in the upper portion of the government’s range.

    Munk (2021): C$11.94 billion in 2021 dollars for the Toronto–Montreal segment alone, with a 66% contingency already built in. Methodologies and scopes are not directly comparable; neither extrapolates straightforwardly to the other.

    Why this matters The government’s stated range is wide enough to encompass quite different methodological approaches. The accuracy band attached to the underlying Class 5 classification — addressed in the Initiative’s companion brief Reading the Footnote — extends the realistic outturn substantially beyond the stated upper bound. “$60 to $90 billion” is doing the work of multiple very different underlying assumptions. Access to Information documents published by The Canadian Press on May 28, 2025 also show that the corporation now answering for the $60–90 billion figure was, beginning in September 2023, paying a marketing firm to rebrand the project from HFR to HSR — eighteen months before any HSR-specific cost analysis had been tabled to Parliament. The companion brief The Report That Vanished sets out that record in detail.
    Claim 03 On ridership
    The government says

    “43 million annual riders by 2084.”

    Q-923 (April 22, 2026). With construction beginning in 2029, this corresponds to approximately year 55 of operations.

    The academic record shows

    McGill (2025): 20.8 million annual riders on the full corridor by year 50 of operations.

    Munk (2021): 10.45 million annual riders on the Toronto–Montreal segment by year 30. Using Munk’s own observation that this segment generates ~57% of full-corridor ridership, this implies ~18 million annual full-corridor riders by year 30. The two academic projections converge within 15%; both are approximately half the government figure.

    Why this matters The government’s 43 million figure is roughly twice the academic consensus and is attached to a horizon two to three decades later than the academic projections. By selecting the latest available year and roughly doubling the mature-corridor ridership the academic studies support, the answer constructs a number that is neither directly comparable to the published analyses nor easily falsifiable for several more decades.
    How the Project Changed

    A short chronology

    The three numerical claims in Q-923 are the most recent point in a project whose definition has shifted substantially over eight years. Understanding why the government’s figures differ from the academic record requires understanding how the thing being costed and forecast changed shape along the way. The sequence below is drawn from the public parliamentary record, principally the September 2024 committee report and the Government Response tabled in October 2025.

    2016–2021 — A VIA Rail proposal for higher frequency, not higher speed. The project began as a VIA Rail concept assessed under Budget 2018. Its defining objective was frequency and reliability on dedicated track, not top speed. A witness who had worked on the original proposal told the committee it was “decision-ready by summer of 2018” and could have been in service by 2025. The estimate publicly associated with that early concept was approximately $12 billion.

    2022–2023 — Procurement, with the scope deliberately left open. A federal Crown corporation was incorporated in late 2022 to manage the project, and a procurement phase launched. Three consortia were invited to bid. Crucially, bidders were asked to submit two options: one running at up to 200 km/h, and one with some high-speed segments to reduce overall travel time. The corporation’s own leadership repeatedly told the committee that the scope, technology, and route were not yet defined, and that it would be “imprudent to throw numbers out, because the scope is not defined.” The 2021 $12 billion figure was confirmed to the committee as “probably not adequate anymore,” but no replacement figure was offered.

    September 2024 — The committee reports, still on the frequency-first premise. The committee tabled its 18-recommendation report under the title Issues and Opportunities: High Frequency Rail in the Toronto to Quebec City Corridor. The report is framed throughout around high-frequency rail. Its recommendations asked the government to define cost and timetable (including an explicit analysis of the incremental cost between the higher-frequency and high-speed options), to release the unredacted Joint Project Office report, and to analyse the effect of a dedicated line on existing VIA Rail service. The premise of the report was that the speed question remained open and that the cost difference between the two options had not been established.

    February 2025 — The pivot to high-speed rail. The government announced on February 19, 2025 that the scope of the project would shift to delivering high-speed rail. This is the decision that resolves the speed question the committee had treated as open — and it resolves it toward the more expensive of the two procurement options, the one requiring a fully protected, fenced right-of-way without at-grade crossings. The decision was made before the committee’s requested incremental-cost analysis had been produced. Access to Information records indicate the rebranding toward this framing had been operationally under way since September 2023, some seventeen months before the public announcement.

    March–September 2025 — Partner selected, timeline halved. The procurement concluded with the selection of a private developer partner, and a Pre-Development Agreement was signed on March 19, 2025, launching a multi-year co-development phase. On September 11, 2025, the government announced that construction would now be accelerated to begin in four years rather than the original eight — even as the Government Response would shortly confirm that “all costing information remains subject to change” through co-development.

    October 2025–April 2026 — The Response, then the figures. The Government Response to the committee’s report was finally tabled on October 10, 2025, more than a year after the report itself. It agreed with the intent of all 18 recommendations but downgraded several of the most consequential — including the cost-and-timetable recommendation and the release of the unredacted Joint Project Office report — to support “in principle,” deferring substance to the co-development phase. The incremental HFR-versus-HSR cost analysis the committee had asked for was never produced as such. Q-923, answered on April 22, 2026, then placed firm-sounding figures — $60 to $90 billion, 43 million riders, no operating subsidy — on a project whose own governing documents still described its costs as undefined.

    The throughline is this: the project began as a frequency-first concept with a roughly $12 billion estimate, was procured with its scope deliberately undefined, was redirected to high-speed rail before the cost comparison the committee requested had been done, had its construction timeline halved while its costs were still officially “subject to change,” and only then acquired the specific $60–90 billion and 43-million-rider figures that Q-923 presents. The figures did not emerge from a defined scope; the scope was redefined around an ambition, and the figures followed. That is the context the academic comparison in this brief is read against.

    The Disclosure Context

    The parliamentary record Q-923 sits in

    Q-923 was answered on April 22, 2026. As the chronology above sets out, the parliamentary record on ALTO that surrounds it is materially thinner than it might otherwise have been. The committee’s 18-recommendation report asked specifically for an HFR-versus-HSR cost analysis (Recommendation 4), the release of the Joint Project Office’s full unredacted report (Recommendation 6), and an analysis of the impact of a dedicated rail line on existing VIA Rail service (Recommendation 8). The first of these was never produced as such; the second was downgraded to release “in principle” in redacted form. The $60–90 billion figure cited in Q-923 therefore sits within a disclosure context in which the central cost question the committee posed was redirected rather than answered.

    The Initiative’s companion brief The Report That Vanished sets out this parliamentary-process record in detail — the documentary evidence on the marketing-led pivot, the procedural mechanics of prorogation, and the parliamentary mechanisms by which the unanswered recommendations remain available to be revived. The two briefs are intended to be read together: Reading the Answer documents the headline framing of the three specific numerical claims in Q-923, and The Report That Vanished documents the parliamentary record into which those claims were placed.

    Side by Side

    Same project, three different pictures

    Read as one comparison, the three claim cards point in the same direction at every turn. The government’s number describes the largest, latest, or narrowest-defined version of each quantity. The academic record describes a more constrained or more comprehensively defined version.

    Subsidies

    Gov:No operating subsidies

    Acad:~C$61.6 B over 47 yrs (capital)

    Cost

    Gov:$60–90 B (Class 5)

    Acad:C$11.9 B (T–M) — C$79.8 B (full)

    Ridership

    Gov:43 M/yr by 2084 (yr 55)

    Acad:~18–21 M/yr (yr 30–50)

    No single divergence, taken alone, would carry the weight of an argument. Stacked together — cost, ridership, subsidies, all framed in the most favourable way each can be framed — they describe a pattern. The pattern is the brief’s subject.

    The honest answer

    Is the government’s framing realistic?

    The answer depends on what “realistic” is asked to mean.

    If realistic means technically defensible — yes. Each of the three figures in Q-923 can be constructed using some defensible technical methodology. The Minister’s answer is a carefully drafted parliamentary response that would survive most reasonable tests of literal accuracy.

    If realistic means consistent with the picture an informed reader would expect — the answer is more complicated. Two independent academic studies, written by different teams under different funding, with no involvement in the ALTO process, converge on a project that:

    • carries roughly half the ridership the government’s 2084 figure implies, at a horizon two to three decades earlier;
    • requires substantial sustained public capital subsidy over four to five decades, even when operations cover their own costs;
    • could plausibly cost as much as the upper end of the government’s range, or, depending on methodology, materially less.

    The framing in Q-923 is technically defensible. It is not the only available framing of the same underlying material. It is the framing that produces the most favourable headline impression at each of the three points where a choice could be made. Whether to characterise it as “realistic” is finally a judgment for the reader. What this brief documents is that the framing is a choice, and that the academic record provides the basis for reading what each statement leaves out.

    For the next federal statement

    Three questions to ask

    Where the next federal statement on ALTO is concerned — whether in a future Order Paper answer, a ministerial statement, a corporate plan summary, or a public communication from ALTO itself — three questions follow naturally.

    1. On subsidies: What definition is being applied? Does the figure cover operations only, or operations and capital servicing? If capital servicing is excluded, what is its size and duration, and over what time horizon is the public obligation expected to extend?
    2. On cost: What is the basis of the figure? Bottom-up engineering estimate, reference-class-adjusted estimate, or some other methodology? What accuracy band does it carry? Where does the figure sit relative to comparable international HSR projects, adjusted for distance, geography, and construction context?
    3. On ridership: At what horizon is the figure cited? How does it compare to the academic projections at the same horizon? If the comparison is unfavourable, on what basis is the higher figure defended? What sensitivity analysis has been conducted, and what does it show?

    None of these questions presupposes opposition to the project. Each is the kind of question a reasonable reader would ask before forming a view. Each is also the kind of question the parliamentary record has so far not been pressed to answer.

    Download Full Brief
    Reading the Answer (PDF)
    Reference document for federal decision-makers, parliamentarians, journalists, and constituents tracking the file
    Download PDF
    Sources

    Primary documents and references

    1.
    Order Paper Question Q-923, 45th Parliament, 1st session. Asked by Philip Lawrence (MP for Northumberland–Clarke), March 5, 2026; answered by the Minister of Transport and Leader of the Government in the House of Commons, April 22, 2026. ourcommons.ca
    2.
    The Canadian Press, “Via Rail subsidiary paid Quebec marketing firm $330K as it pivoted to high-speed rail,” May 28, 2025. The Globe and Mail published a parallel report on the same Access to Information disclosures the same day. theglobeandmail.com
    3.
    Zhang, B., Negm, H., & El-Geneidy, A. (2025). High-Speed Rail in Canada: Insights from a corridorwide survey and a financial analysis. Transportation Research at McGill, McGill University. Funded by Queen’s University and the Natural Sciences and Engineering Research Council of Canada (NSERC).
    4.
    Bien, P., Iqbal, S., Li, A., & Stecher, I. (2021). High-Speed Rail: Toronto – Montreal Economic Analysis. Global Economic Policy Lab, Munk School of Global Affairs & Public Policy, University of Toronto. Lab Director: Professor Mark Manger.
    5.
    ALTO, “How Much Will Alto’s High-Speed Rail Cost Canadians and how is it Funded?”, blog post published May 8, 2026 — source of the AACE Class 5 classification of the $60–90 billion figure. altotrain.ca
    6.
    ALTO HSR Citizen Research Initiative, Reading the Footnote (Cost Estimation Brief), May 2026 — the companion brief analysing the AACE Class 5 footnote in detail.
    7.
    ALTO HSR Citizen Research Initiative, The Report That Vanished (Parliamentary Process Brief), May 2026 — the companion brief setting out the TRAN Report 18 record, the documented marketing-led HFR-to-HSR pivot, and the procedural mechanisms by which the committee’s recommendations remain unanswered.